

Abstract
Specific protein glycoforms may be uniquely informative about the pathological state of a cyst and may serve as accurate biomarkers. Here we tested that hypothesis using antibody-lectin sandwich arrays in broad screens of protein glycoforms and in targeted studies of candidate markers. We profiled 16 different glycoforms of proteins captured by 72 different antibodies in cyst fluid from mucinous and nonmucinous cysts (n = 22), and we then tested a three-marker panel in 22 addition samples and 22 blinded samples. Glycan alterations were not widespread among the proteins and were mainly confined to MUC5AC and endorepellin. Specific glycoforms of these proteins, defined by reactivity with wheat germ agglutinin and a blood group H antibody, were significantly elevated in mucinous cysts, whereas the core protein levels were not significantly elevated. A three-marker panel based on these glycoforms distinguished mucinous from nonmucinous cysts with 93% accuracy (89% sensitivity, 100% specificity) in a prevalidation sample set (n = 44) and with 91% accuracy (87% sensitivity, 100% specificity) in independent, blinded samples (n = 22). Targeted lectin measurements and mass spectrometry analyses indicated that the higher wheat germ agglutinin and blood group H reactivity was due to oligosaccharides terminating in GlcNAc or N-acetyl-lactosamine with occasional α1,2-linked fucose. The results show that MUC5AC and endorepellin glycoforms may be highly specific and sensitive biomarkers for the differentiation of mucinous from nonmucinous pancreatic cysts.
Cysts in the pancreas can be a clinical challenge to patients and physicians, because some are precancerous and may progress to invasive cancer, whereas others remain indolent (1). The first step in diagnosis is to determine the type of cyst. Two types of pancreatic cysts—intraductal papillary mucinous neoplasms (IPMNs)1 and mucinous cystic neoplasms (MCNs), together termed “mucinous cysts”—have malignant potential, and other types of cysts, such as serous cystadenomas (SCs) and pseudocysts (PCs), are essentially benign. To date, there are difficulties in correctly determining the cyst type. The methods commonly used to assess pancreatic cysts are endoscopic ultrasound and cyst fluid aspiration followed by the carcinoembryonic antigen (CEA) assay and cytology. The most useful is CEA, which distinguishes mucinous cysts from nonmucinous cysts with 70% to 80% accuracy (2–4). Cytology (microscopic analysis of the cells in the fluid) has limited value because of the lack of consistency in obtaining reliable cellular material (2). Other biomarkers, including DNA analysis, have yet to achieve widespread use (5).
Because the current tests are not conclusive for many patients, new, more effective molecular markers are needed to provide more accurate diagnoses and to help guide management. Researchers have investigated molecular features such as DNA mutations (6, 7), specific protein levels (8), microRNAs (9), inflammatory cytokines (10), and the presence of mucin (11, 12). Broad searches utilizing genomic, proteomic, and glycomic profiling (13–15) have uncovered other candidate biomarkers that require further study and validation.
We previously investigated whether specific protein glycoforms are present exclusively in the fluid from mucinous cysts (16). The reason for investigating specific glycoforms, rather than simply the protein levels, is that the glycoforms may be more closely associated with disease. Cells can rework the glycosylation machinery as they become neoplastic and progress to invasive cancer. For example, cancer cells and dysplastic cells can enhance N-glycan complexity through increased branching (17), produce truncated O-glycans through the lost activity of an enzyme critical for O-glycan extension (18), or increase fucosylation or the production of Lewis structures (19). Such glycan restructuring can affect cellular adhesiveness, migration, cytokine signaling, receptor recycling, or immune cell interactions (20), all potentially involved in cancer progression. Therefore, we potentially can get more information about the differentiation state of a cell by detecting protein glycosylation in addition to protein abundance.
The protein MUC5AC in cyst fluid demonstrated such potential in a previous study by our group (16). We examined both protein levels and specific glycoform levels of MUC5AC in fluid from mucinous cysts relative to nonmucinous cysts. A glycoform of MUC5AC, one that binds the lectin wheat germ agglutinin (WGA), was almost exclusively found in the mucinous cysts and was a better biomarker than the MUC5AC protein measured over all glycoforms. Furthermore, the glycosylation patterns in pancreatic cysts were different from those we found in pancreatic ductal adenocarcinomas (21, 22).
In the current study, we performed a broad search of addition glycoforms of MUC5AC and other proteins that may be up-regulated in mucinous cysts and tested the hypothesis that the detection of specific glycoforms can serve to accurately discriminate mucinous from nonmucinous cysts. We confirmed the importance of the WGA-reactive glycoform of MUC5AC and found a second glycoform of MUC5AC, displaying the blood group H (BGH) antigen, up-regulated in mucinous cysts. We found a new marker, endorepellin, that also displayed elevated WGA-reactive and BGH-reactive glycoforms in mucinous cysts. A panel of three markers, comprising two glycoforms of MUC5AC and one of endorepellin, classified the samples with high sensitivity and specificity, providing the potential for more accurate diagnoses of pancreatic cysts. We further characterized the diagnostic glycoforms using mass spectrometry and targeted lectin analyses, which provided information about the molecular features of cystic precursors of cancer and routes for the further development of biomarker assays.
MATERIALS AND METHODS
Cyst Fluid Samples
The study was conducted in compliance with the guidelines of the local institutional review boards involved in the study. Cyst fluid samples were collected at the University of Michigan Medical Center, Memorial Sloan-Kettering Cancer Center, the University of Arizona Medical Center, and Ospedale Sacro Cuore-Don Calabria, Negrar, Italy (supplemental Table S1). All samples were collected via either endoscopic ultrasound-guided fine-needle aspiration or fine-needle aspiration from surgically removed cysts. We had verified previously that the method of collecting the cyst fluid does not greatly affect specific marker levels (25). The specimens were kept on ice until aliquots were made and frozen at −80 °C, within 2 h of collection. An aliquot that had been thawed no more than twice was used for each experiment. Prior to each experiment, we removed the cellular debris and clot fragments from each aliquot by centrifuging the sample for 10 min at 2,400 × g and collecting the supernatant. All patients enrolled in this study had an operative procedure to remove the cystic lesion. The surgical pathology report confirmed the histological diagnosis of cyst type in all patients.
The samples were collected prior to diagnosis, and the subjects were selected for the study without regard to diagnosis; we selected all subjects undergoing evaluation of a pancreatic cyst and for whom a cyst fluid sample was available. We confirmed no statistical differences between the cyst types (mucinous and nonmucinous) in the ages and genders of the patients and the sizes of the cysts (supplemental Table S2). Each of the four sites contributed fluid from both mucinous and nonmucinous cysts, except for Memorial Sloan-Kettering, which contributed six samples of the mucinous type only (supplemental Table S2).
Western Blot
The cyst fluid samples were diluted 1:1 in sample buffer consisting of Laemmli Sample Buffer (Bio-Rad, Hercules, CA) and 2-mercaptoethanol while being heated for 5 min at 100 °C. Fifteen microliters of each sample was loaded per lane onto precast 4% to 12% Bis-Tris SDS-PAGE gels (Criterion XT, Bio-Rad, Hercules, CA). After electrophoresis, the separated proteins were transferred onto a 0.2-μm PVDF membrane (Sequi-blot, Bio-Rad, Hercules, CA) using Trans Blot® SD Semi-Dry Transfer Cell (Bio-Rad, Hercules, CA). The PVDF membrane was blocked with 3% BSA for 1 h at room temperature. Detection was done by means of two 1-h sequential incubations with the primary biotinylated anti-endorepellin antibody (supplemental Table S3; 1:3,000 dilution) and the secondary horseradish peroxidase conjugated streptavidin (Thermal Scientific, Rockford, IL; 1:10,000 dilution). The membrane was washed in PBST0.05 between detection steps and developed with Super Signal West Pico Chemiluminescent Substrate (Thermo Scientific, Rockford, IL) according to the manufacturer's instructions. After staining, the membrane was visualized using a Gel Doc XR+ System (Bio-Rad, Hercules, CA).
Processing of Antibodies and Lectins
The antibodies and lectins were purchased from various sources (supplemental Table S3). The capture antibodies to be printed onto microarray slides were purified via dialysis (Slide-A-Lyzer, Pierce Biotechnology, Rockford, IL) to phosphate buffered saline (PBS) and ultracentrifuged. Antibody or lectin was biotinylated with the EZ-Link-sulfo-NHS-LC-Biotin kit (Pierce Biotechnology, Rockford, IL) according to the manufacturer's instructions.
Biological Reagents
The buffers and biological solutions used in microarray assays included PBST0.5 or 0.1 (1X PBS + 0.5% or 0.1% Tween-20), 10X sample buffer (1X PBS + 1% Tween-20 + 1% Brij-35 (Thermo Scientific, Rockford, IL)), 4X IgG blocking mixture (400 μg/ml each for mouse, sheep, and goat IgG; 800 μg/ml rabbit IgG in 1X PBS; antibodies from Jackson ImmunoResearch, West Grove, PA), 10X protease inhibitor (Complete Tablet, Roche Applied Science, Indianapolis, IN), and 2X sample dilution buffer (2X sample buffer + 2X protease inhibitor + 2X IgG mixture in 1X PBS).
Microarray Fabrication
The capture antibodies (supplemental Table S3) were spotted onto protein microarray PATH® film slides (Grace Bio-Labs, Bend, OR), which are coated with nitrocellulose. The antibody printing step was performed by a 2470 Arrayer Microarray Printing Platform (Aushon Biosystems, Billerica, MA). All antibodies that were used for printing were adjusted to 250 μg/ml. Each slide contained 48 identical arrays arranged in a 4 × 12 grid with 4.5-mm spacing between arrays, and each array had the same antibodies printed in six-replicate. A wax-based hydrophobic boarder was imprinted to define boundaries between the arrays (SlideImprinter, The Gel Company, San Francisco, CA). The printed slides were stored at 4 °C in a desiccated, vacuum-sealed slide box until use.
Microarray Assays
The antibody microarray assay with PATH slides was adapted and modified from a protocol described previously (16). The cyst fluid samples were diluted with 2X sample dilution buffer and incubated at 4 °C overnight for IgG blocking with gentle agitation. Unless otherwise stated, all the following steps were conducted at room temperature. The next day, the PATH slides were blocked with 1% BSA (Fisher Scientific, Fair Lawn, NJ) in PBST0.5 for 1 h, washed in three changes of PBST0.5 for 3 min each, and dried by means of brief centrifugation at 160 × g. We did not chemically derivatize the glycans on the capture antibodies as previously described (16), because in control experiments we observed very little binding of the detection reagents to the glycans on the capture antibodies.
A total of 6 μl of overnight-IgG-blocked cyst fluid sample was applied to each array and incubated for 1 h. After sample incubation, the slides were washed three times in PBST0.1 and spin-dried. Then the captured antigens underwent detection for 1 h with biotinylated antibodies or lectins (3 μg/ml) prepared in PBST0.1 buffer, followed by 1 h incubation with the secondary streptavidin-phycoerythrin (2 μg/ml), with three washes between steps. Lastly, all the spin-dried slides were scanned for fluorescence at 532 nm using a microarray scanner (LS Reloaded, TECAN, Durham, NC). The resulting images were quantified and analyzed with the software GenePix Pro 5.0 (Molecular Devices, Sunnyvale, CA) using both automatic and manual spot-finding features. The local background was subtracted from the median intensity of each spot. The quantified results for each image were further processed to remove any outlier from the six-replicate spots with Grubbs' test using a custom script. The script calculates the Grubbs' statistic for the spot farthest from the mean of the replicates and rejects the spot if the Grubbs' statistic exceeds a preset threshold (here p < 0.1). The script repeatedly removes spots until no outliers remain or to a minimum of three spots. It then calculates the geometric mean of the remaining replicate spots as the final output, along with the associated coefficient of variation, which is used for quality control. We repeated assays for measurements that had a cv > 0.4 and signals in the quantifiable response range of the assay (determined by dilution series of pooled samples) (26).
Total Protein Quantification
Total protein measurements of cyst fluid were done with a Micro BCA Protein Assay kit (Thermo Scientific, Rockford, IL) according to the manufacturer's microplate protocol. 96-well, flat-bottom, 0.4-ml-well microplates (Nalge Nunc International, Rochester, NY) were used for the assays. Absorbance in each well was measured with a SpectraMax M2 Microplate Spectrophotometer (Molecular Devices, Sunnyvale, CA). A BSA dilution series was fitted, and the curve was used to calculate the protein concentration in the samples.
Glycomic Analyses
N-linked glycans from total cyst fluid glycoproteins were released according to previously described methods (27, 28). Briefly, samples (∼125 μg protein, 20 μl total volume) were thawed, diluted 2-fold with 8 m urea, 25 mm ammonium bicarbonate (pH 7.8), and clarified via centrifugation at 4 °C at 12,000 × g for 20 min. Supernatant samples were reduced by the addition of DTT to 10 mm for 30 min, alkylated by the addition of iodoacetamide to 25 mm for 30 min, and quenched by an additional 25 mm DTT. Samples were then diluted to <1 M urea with 25 mm ammonium bicarbonate (pH 7.8) and subjected to trypsinolysis (total reaction volume ∼ 400 μl). The reaction was stopped by the addition of 30% (v/v) acetic acid to reduce the pH to below 3. Tryptic peptides were adsorbed to and released from a Waters C18-SepPak (100 mg) using 50% acetonitrile/0.1% trifluoroacetic acid, dried, resuspended in 25 mm ammonium bicarbonate, and treated with PNGase F. Peptides were removed via passage through a C18-SepPak. Glycans were recovered from the flow-through by adsorption to and release from an activated charcoal cartridge (Carbograph, Grace, Deerfield, IL) and dried via vacuum centrifugation. Glycans were permethylated in a mixture of dimethyl sulfoxide and iodomethane and supplemented with 500 mm NaCl prior to extraction into CHCl3 (29). The CHCl3 layer was multiply extracted with water and dried as described above. Native and permethylated samples were characterized by means of MALDI-TOF/TOF mass spectrometry with an Ultraflex II (Bruker Daltonics, Billerica, MA) operated in reflectron-positive ion mode (26).
MS data and tandem MS data (where available) were processed using flexAnalysis 2.0 (Bruker). Glycan compositions were assigned based on database searching of MS peak lists in GlycoWorkbench (30, 31) with the following criteria: (i) mass error ≤ 0.2 Da, (ii) fixed modifications including nonreduced terminus and permethylation (if appropriate), and (iii) variable numbers of monosaccharides (Hex (3–14), HexNAc (2–14), deoxyHex (0–5), NeuAc (0–7), NeuGc (0–5), phosphates (0–5), sulfate (0–5)). Only spectra with ≥10 glycan ions (with S/N ≥ 6 and relative intensity ≥ 10% of base peak intensity) were used for the quantification of glycans, calculated as the percent abundance relative to the total glycan ion current over m/z 1500–5000. Average standard errors of the mean were ≤10% of glycan abundances for full technical replicates of a control human serum glycoprotein sample run in parallel with pancreatic cyst fluid samples. Two pancreatic cyst fluid samples also had similar average standard errors of the mean for replicates.
Statistical Analyses and Presentation
The data were analyzed and prepared using Microsoft Office Excel, OriginPro 8 (OriginLab, Northampton, MA), and MedCalc 12.3.0.0 (MedCalc Software, Mariakerke, Belgium). The particular statistical tests used throughout the study are indicated with each relevant table or figure. The figures were prepared using Canvas XII (ACD Systems, Seattle, WA).
RESULTS
Protein Glycoforms Associated with Mucinous Cysts
To test whether mucinous cysts (IPMNs and MCNs) and nonmucinous cysts (SCs and pseudocysts PCs) produce different levels of particular protein glycoforms, we used the antibody-lectin sandwich array platform (23, 24) to survey multiple glycan levels on a variety of proteins captured from cyst fluid. The antibody-lectin sandwich array enables measurements of specific glycoforms of multiple proteins from biological solutions. By comparing the antibody-lectin sandwich array with standard sandwich assays, one can determine the relationship between protein abundance and glycosylation (Figs. 1A and 1B).
Fig. 1.
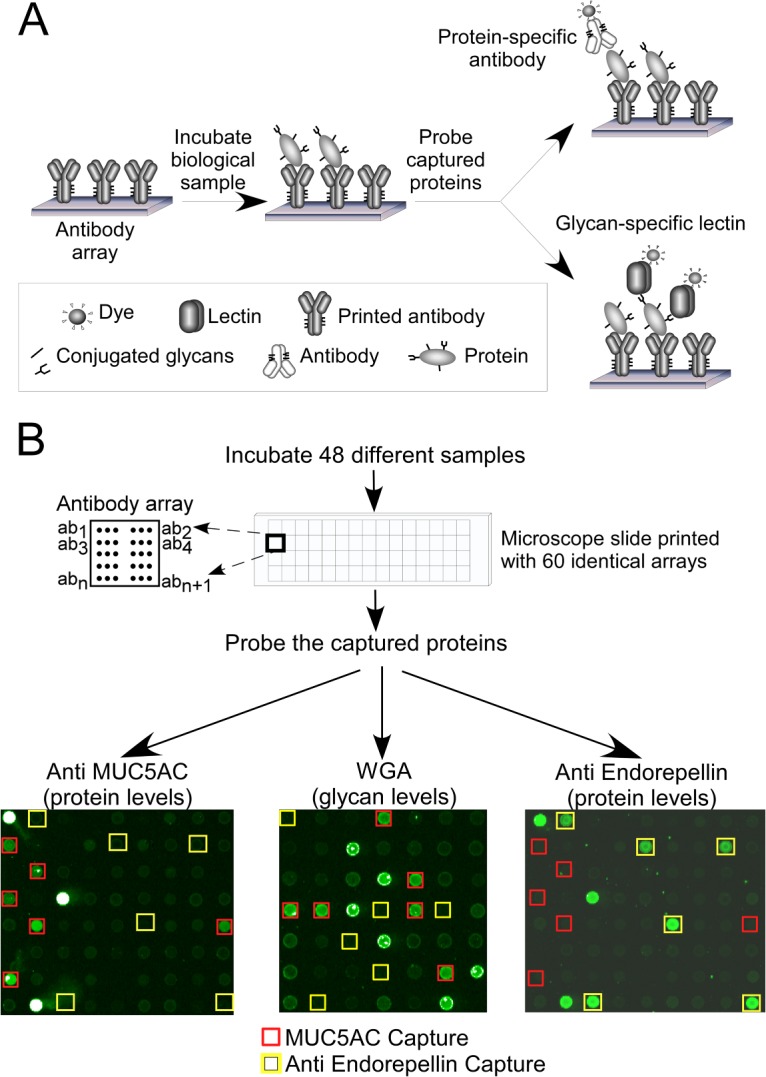
Detection of individual proteins' abundances and glycoforms. A, the proteins captured by an antibody array may be probed with either an antibody, to measure the abundance of the core protein, or a lectin, to measure the glycans on the captured proteins. B, multiple, identical arrays may be run on a single microscope slide for high-throughput and low-volume sample processing. The probing of an array with anti-MUC5AC or anti-endorepellin antibody shows signals only at the anti-MUC5AC or anti-endorepellin capture spots, respectively, but probing the array with WGA shows signals at several capture antibodies. The brightest spots in each array (with white pixels indicating saturation of signal) are biotinylated positive-control proteins that were not used in the analysis.
We profiled 22 cyst fluid samples—11 from mucinous cysts (5 IPMNs and 6 MCNs) and 11 from nonmucinous cysts (5 PCs and 6 SCs)—in two experiment sets, one involving 72 capture antibodies and 12 glycan-binding detection reagents, and the other involving 27 capture antibodies (a subset of the 72 captures) and 5 detection reagents (supplemental Table S4). Each combination of capture antibody and detection reagent formed a unique assay, producing approximately 1000 ((72 × 12) + (27 × 5) = 999) antibody-lectin measurements. The antibody arrays targeted some 30 different proteins, including mucins, matrix components, and secreted glycoproteins. The detection reagents probed a variety of glycan structures that could be elevated in mucinous cysts (based on previous analyses of pancreatic cysts and cancers), including modifications to N-acetyl-lactosamine (LacNAc), ABO blood group structures, and Lewis family glycans.
Several antibody-lectin measurements were significantly different between the mucinous and nonmucinous cysts (supplemental Table S4). The markers that best distinguished the groups were endorepellin detected by WGA (designated endorepellin-WGA) and MUC5AC-WGA (p = 0.0045 and p = 0.013, respectively), followed by bradykinin detected by anti-BGH (bradykinin-BGH, p = 0.015), MUC5AC-EEL (p = 0.020), and eight other markers with p < 0.05. The pancreatic cancer serum marker CA 19–9 was highly elevated in about 30% of all the cyst fluid samples, with approximately even distribution between the different types of cysts.
Although not the main purpose of the study, we also examined whether any markers differentiated mucinous cysts by grade of dysplasia, an important factor in determining treatment. None of the markers had levels associated with grade of dysplasia, which was known only for a subset of the mucinous cysts (six IPMNs with high- or moderate-grade dysplasia, four cysts with invasive components, and three IPMNs and five MCNs with low-grade dysplasia). CEA did not provide information about disease grade here or in a previous study (4). The limited number of samples did not allow investigations of relationships with other features of the cysts, such as location, size, and histological subtype (pancreatobiliary, gastric, intestinal, or oncocytic). None of the markers identified immediately above was significantly different between MCNs and IPMNs, suggesting similarities in glycoform regulation between the two types of mucinous cysts.
We next investigated whether combinations of markers provided added value over any individual marker for discriminating mucinous from nonmucinous cysts. We used the Marker State Space method (32) to scan thresholds defining the elevation for each marker and then search for combinations of markers demonstrating differential classification between the mucinous and nonmucinous cysts. The Marker State Space method gives robust performance for classifying clinical samples and may have some advantages of other classification algorithms for handling subgroups of patients (32). Endorepellin and MUC5AC, detected with either WGA or BGH, provided nearly all the discriminatory power in the classifications. A three-marker panel consisting of MUC5AC-WGA, MUC5AC-BGH, and endorepellin-WGA showed clear differences between the groups. The samples that were elevated in any two of those markers were all of the mucinous type, and all the samples that were elevated in only one or fewer of the markers were of the nonmucinous type (Fig. 2).
Fig. 2.
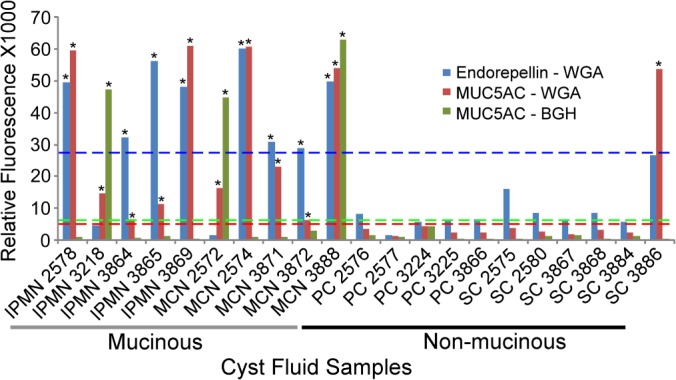
A three-marker panel for distinguishing mucinous from nonmucinous cysts. An elevation of two or more of the three markers (as defined by the threshold for each marker) was observed in all of the mucinous cyst samples (intraductal papillary mucinous neoplasms (IPMNs) and mucinous cystic neoplasms (MCNs)) but in none of the nonmucinous cyst samples (serous cystadenomas (SCs) and pseudocysts (PCs)). An asterisk above a bar indicates a measurement that was above its respective threshold. The dashed lines are the thresholds for the respective markers, with colors matched between the dashed lines and the marker data.
Testing and Characterization of a Diagnostic Three-marker Panel
We next sought to test the consistency of the identified marker panel using a larger sample set (n = 44, including 14 of the previously used 22 samples, which were included to accurately calibrate where the thresholds should be for each marker). This set tested whether the predefined three-marker panel and the individual markers had the same performance in the new samples, and the previously used samples were included for reference. As before, MUC5AC and endorepellin detected with WGA were significantly different between the groups, and the BGH-reactive glycoforms also were significantly different between the groups in this larger sample set (supplemental Table S5 and Fig. 3). Other significant markers were bradykinin detected with either WGA or BGH, as before, and CEA detected with WGA but not BGH. MUC16-WGA was slightly lower in the mucinous cysts (p = 0.033).
Fig. 3.

Protein and glycan levels of MUC5AC and endorepellin. The plots show quantified, logged fluorescence values from the anti-MUC5AC (Ab1) (A) and anti-endorepellin (B) capture antibodies. Probing the anti-MUC5AC capture antibody with an anti-MUC5AC (Ab1) detection antibody (upper left) gives the MUC5AC protein levels, and anti-endorepellin detection at the anti-endorepellin capture antibody (same antibody for capture and detection) gives the endorepellin protein levels (lower left). Detection by WGA and anti-BGH gives the respective glycan levels at each capture antibody. Each point is the average signal from triplicate arrays for an individual sample, and results from 44 samples are shown. The boxes give the upper and lower quartiles, the vertical and narrow horizontal lines define the signal range (including data that are between the 1.5 interquartile range (IQR) of the lower quartile and the 1.5 IQR of the upper quartile), and the wide horizontal lines mark the median values. The +1 or +2 signs above or below some of the box plots indicate the number of data points that are outside the range of the display. We calculated the p values using the two-tailed t test on the unlogged values. M, mucinous; NM, nonmucinous; NS, not significant.
In the detection of glycans on captured proteins, elevations could result from a change in the glycosylation of the protein or a change in the protein abundance, or both. To better characterize the relationship between glycan and protein levels, we determined the relative protein abundances of MUC5AC and endorepellin using antibody sandwich assays. We previously had confirmed the specificity of the anti-MUC5AC antibody (16), and here we confirmed the specificity of the anti-endorepellin antibody using immunoblots (supplemental Fig. S1). The MUC5AC protein levels were moderately higher in the mucinous cysts, as previously observed by our group (16) and others (33), but not nearly as elevated as the WGA-reactive and BGH-reactive glycoforms of MUC5AC (Fig. 3A). Likewise, endorepellin protein levels were not significantly different between the cyst types, but the WGA-reactive and BGH-reactive glycoforms were (Fig. 3B). Both the protein measurements and the glycoform measurements were largely in the linear ranges of the assays, and both had good reproducibility in replicate experiments (not shown). These analyses indicate that glycosylation states, and not just protein levels, differ between the cyst types.
The three-marker panel correctly identified 24/27 (89%) of the mucinous and 17/17 (100%) of the nonmucinous cysts (Fig. 4A), for an accuracy of 93%, demonstrating good consistency with the initial evaluation (Fig. 2). The performance was similar after the 14 samples already used in discovery were removed: sensitivity 90% (18/20), specificity 100% (10/10), and accuracy 93.3% (28/30). The panel did not identify the three samples collected from cysts associated with pancreatic neuroendocrine tumors (PNETs), suggesting that the molecular profiles of PNET cyst fluids are distinct from those of IPMNs and MCNs.
Fig. 4.

Performance of the three-marker panel in independent sample sets. A, the three-marker panel was applied to 44 cyst fluid samples (27 mucinous, 17 nonmucinous, and 3 PNETs). Each column represents results from a sample, and the first three rows indicate each marker value. A yellow square indicates that the marker exceeded the threshold, and a black square indicates that it was below the threshold. The bottom row indicates the classification. If two or more markers were elevated, a sample was classified as mucinous (yellow square); otherwise it was classified as nonmucinous (black square). The sample columns were grouped by marker pattern for clarity. B, the panel was applied blinded to 25 cyst fluid samples (15 mucinous, 7 nonmucinous, and 3 PNETs) that had not been used for marker development. Note the similarity in subgroups of marker patterns between panels A and B.
We further tested the biomarker panel with an independent, blinded set of cyst fluid samples (n = 22) that had not been used in previous experiments. 13 of the samples were collected at a site (Verona, Italy) that had not contributed to the samples used in the previous experiments. We determined the threshold for each marker using data from selected previously run samples. The marker panel had a performance of 87% sensitivity (13/15), 100% specificity (7/7), and 91% accuracy (20/22) (Fig. 4B). The patterns of marker elevation were approximately the same as in the previous sample set, and as before, the PNETs were not classified as mucinous. This consistency between the data sets suggests the existence of patient subgroups with distinct marker-expression patterns.
This performance is superior to the previously reported performance of CEA, which varies widely across studies (accuracies of 70% to 80% (2–4)). Here, using our antibody-array assay, CEA discriminated the patient groups in the prevalidation samples (n = 42) with accuracies of 64% to 93%, depending on the capture antibody and cutoff used (supplemental Fig. S2). In the prevalidation set and a subset of the validation set, the panel correctly classified one and two samples, respectively, that were misclassified using the top-performing CEA antibody and cutoff (supplemental Fig. S2). None of the samples misclassified by the panel was correctly classified by CEA. The CEA antibodies appear to have divergent binding to distinct CEA glycoforms, as revealed by immunoblot comparisons (supplemental Fig. S2), which might contribute to the variability observed between CEA assays. These findings suggest that the panel outperforms CEA and that CEA does not provide additive value (for example, by correctly classifying samples that were misclassified by the panel), although larger studies are needed in order to more thoroughly compare the relative performance of these assays.
Analysis of the Glycans Using Targeted Lectin Comparisons
We next investigated the nature of the glycan structures associated with mucinous cysts through analyses of the specificities of the lectins that bind those glycans. The main, known binding preferences of WGA are for N-acetylglucosamine that is not substituted at the 3′ carbon and, more weakly, for sialic acid. An analysis of glycan array data, however, showed a more complex binding pattern (34). To get more information about the glycan structures elevated in the mucinous cysts, we probed 10 of the samples, 5 mucinous and 5 nonmucinous, with five additional lectins. We chose lectins with specificities that overlap with but are distinct from that of WGA. The lectins GSL II, ECA, and STL showed binding to captured MUC5AC that was similar to that of WGA, but DSL and LEL bound weakly to the captured MUC5AC in all the cyst fluid samples (supplemental Fig. S3). GSL II binds terminal N-acetyl-glucosamine (GlcNAc), ECA binds terminal β1,4-linked galactose and terminal LacNAc, and STL binds internal or terminal LacNAc and terminal Galβ1,4. In contrast, DSL and LEL mainly target internal LacNAc. All the lectins were verified as functional and specific through the use of positive and negative control samples (supplemental Fig. S3). These data suggest that MUC5AC displays terminal LacNAc and GlcNAc in the mucinous cysts, but not extended, poly-LacNAc structures.
A comparison of the BGH binding profile to the profiles from antibodies against various Lewis and ABO antigens (which target structures containing fucose (obtained in the first set of experiments)) showed little correlation (not shown). This result indicates that the increased BGH signals were not from general fucosylation, which would result in a wide variety of fucosylated structures, but rather were primarily from the H antigen (fucose α1,2 linked to terminal galactose).
Analysis of the Glycans Using Glycomics Profiling
We gathered additional information about the glycans using N-glycomic profiling of total glycoproteins via mass spectrometry. This analysis does not tell us about glycans on individual proteins, but it could give insights into the major glycosylation shifts between the sample types. N-linked glycans were individually isolated from five mucinous and two nonmucinous cyst fluid samples, and m/z values were determined using MALDI-TOF/TOF-MS. We quantified 86 glycan compositions (various combinations of hexose, N-acetylhexosamine, deoxyhexose, and sialic acid residues). As enumerated in supplemental Table S6, cyst-to-cyst variation was striking compared with the relative conservation of profiles reported for human neutrophils, kidney and liver tissue, and sera (28, 35, 36). Nevertheless, systematic commonalities were also observed (Table I). For mucinous cysts, these included structures (inferred by imposing biosynthetic rules on compositions) with terminal LacNAc or GlcNAc, short extensions, prevalent fucosylation, and lack of sialylation. In comparison, nonmucinous cyst structures often exhibited capping sialic acids on their LacNAc extensions, with an overall predicted structure profile reminiscent of serum glycoproteins, potentially due to serum infusion (see above). The average differences between mucinous and nonmucinous samples with respect to predicted GlcNAc or Fuc-terminated glycans, as summarized in Table I, generally correlated with potential increased binding of WGA and BGH Ab to MUC5AC and endorepellin as described above. Further studies are needed to determine whether lectin recognition is targeted to N- or O-glycans on these glycoproteins, both of which likely are present. Nevertheless, the correlation suggests that mucinous cyst epithelia have elevated activities of selected GlcNAc-, Gal-, and Fuc-transferases that modify their N-glycans (and potentially O-glycans as well) with distinct peripheral glycan substructures.
Table I. N-linked glycans with differential abundance between cyst types. The normalized abundances of each composition were averaged within the mucinous and the nonmucinous cysts, and the differences in average abundances were calculated. The ions with the greatest differential abundance are shown. See supplemental Table S6 for the complete dataset.
| Mass | Composition | Possible structure | Mucinous (n = 7) |
Nonmucinous (n = 2) |
Difference (%) |
||
|---|---|---|---|---|---|---|---|
| Present (%) | Average (%) | Present (%) | Average (%) | (Mucinous − serous) | |||
| 2070.04 | Hex5-HexNAc4- | 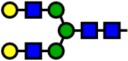 |
100 | 11.74 | 100 | 1.21 | +10.53 |
| 2244.13 | Hex5-HexNAc4-Fuc1- | 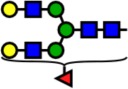 |
100 | 6.18 | 100 | 1.03 | +5.15 |
| 2519.26 | Hex6-HexNAc5- | 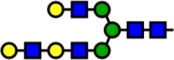 |
71 | 3.92 | 100 | 0.87 | +3.05 |
| 2489.25 | Hex5-HexNAc5-Fuc1- | 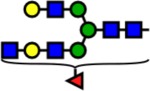 |
71 | 2.75 | 0 | 0.00 | +2.75 |
| 2040.03 | Hex4-HexNAc4-Fuc1- | 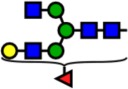 |
100 | 4.11 | 100 | 1.71 | +2.40 |
| 2285.15 | Hex4-HexNAc5-Fuc1- | 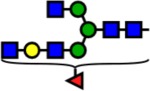 |
100 | 2.55 | 100 | 0.52 | +2.03 |
| 1835.93 | Hex3-HexNAc4-Fuc1- | 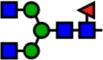 |
71 | 2.45 | 50 | 0.58 | +1.86 |
| 2592.30 | Hex5-HexNAc4-Fuc3- | 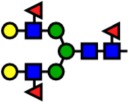 |
43 | 1.79 | 0 | 0.00 | +1.79 |
| 1865.94 | Hex4-HexNAc4- | 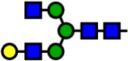 |
86 | 2.11 | 50 | 0.52 | +1.59 |
| 2214.11 | Hex4-HexNAc4-Fuc2- | 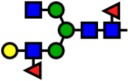 |
100 | 2.70 | 100 | 1.33 | +1.37 |
| 2693.35 | Hex6-HexNAc5-Fuc1- | 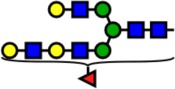 |
71 | 1.98 | 100 | 0.61 | +1.37 |
| 1590.80 | Hex3-HexNAc3-Fuc1- | 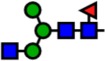 |
57 | 1.73 | 50 | 0.39 | +1.35 |
| 2388.20 | Hex4-HexNAc4-Fuc3- | 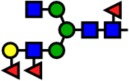 |
57 | 1.35 | 0 | 0.00 | +1.35 |
| 2143.08 | Hex4-HexNAc3-Fuc3- | 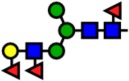 |
57 | 1.33 | 0 | 0.00 | +1.33 |
| 3041.53 | Hex6-HexNAc5-Fuc3- | 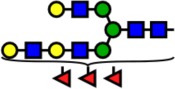 |
57 | 1.30 | 0 | 0.00 | +1.30 |
| 4413.00 | Hex7-HexNAc6-NeuAc4- | 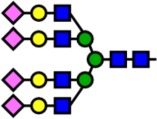 |
0 | 0.00 | 100 | 0.82 | −0.82 |
| 3241.61 | Hex6-HexNAc5-NeuAc2- | 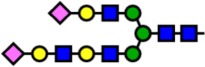 |
0 | 0.00 | 100 | 1.44 | −1.44 |
| 3602.78 | Hex6-HexNAc5-NeuAc3- | 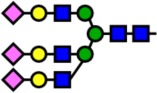 |
14 | 0.28 | 100 | 2.72 | −2.44 |
| 2431.21 | Hex5-HexNAc4-NeuAc1- | 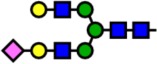 |
71 | 4.60 | 100 | 9.35 | −4.75 |
| 2792.38 | Hex5-HexNAc4-NeuAc2- | 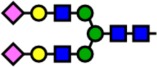 |
43 | 3.23 | 100 | 54.26 | −51.03 |
Notes: Yellow circles represent galactose, blue squares are N-acetylglucosamine, green circles are mannose, red triangles are fucose, and pink diamonds are sialic acid. Hex, hexose; HexNAc, N-acetylhexosamine; Fuc, fucose.
DISCUSSION
The first step in diagnosing a pancreatic cyst is to determine the type of cyst, whether mucinous, a cancer precursor, or nonmucinous, with no malignant potential. We identified a three-marker panel that performed well for that distinction in two independent sets of samples. If the results hold up in larger studies, the new biomarker will have the potential to positively affect clinical practice. For example, a negative reading from the panel could prevent the unnecessary surgical removal of nonmucinous cysts, as nearly all of the mucinous cysts had high readings, and a positive reading from the panel would unequivocally direct treatment toward the management of a mucinous cyst.
The key to the accuracy of the biomarker panel was the detection of glycoforms of specific proteins, as opposed to total protein levels or total glycan levels. The protein levels of MUC5AC and endorepellin, without respect to glycosylation, were not different between the cyst types (Fig. 3), nor were the total levels of any particular glycan measured over all protein carriers. In contrast, specific glycoforms of MUC5AC and endorepellin showed very strong associations with mucinous cysts (Fig. 3). Furthermore, glycoform differences were not widespread among the various proteins tested; they were largely restricted to MUC5AC and endorepellin. The possibility exists that WGA and BGH modifications are more widespread but are undetectable on many other proteins. But because several other proteins measured here would be expected to have generally high concentrations, the lack of significant WGA-reactive and BGH-reactive glycoforms of those proteins indicates that the glycan modifications are somewhat selective. These findings support the concept that the glycosylation of specific proteins is dependent on context and can be highly associated with disease states. For that reason, biomarker assays based on the detection of specific glycoforms might be more effective than conventional protein assays, as also demonstrated by previous work on glycoforms of α-fetoprotein (37), haptoglobin (38), and human IgG (39).
The biomarker panel presented here compares favorably with previously disclosed biomarkers in cyst fluid. As noted above, CEA performance is highly variable between studies, perhaps because of differences between antibodies in affinities for diverse CEA glycoforms (supplemental Fig. S2). By incorporating into each assay the glycan features that are specific to certain disease states, our approach may better account for and make use of glycoform diversity. Furthermore, a three-marker panel may be better than a single marker for identifying all patients, because subgroups of patients might not be identified with a single marker. Consistent with that concept, the three individual markers of the biomarker panel were elevated in distinct but overlapping groups of patients (Fig. 4), so that their combination outperformed any individual marker. The repeated observation of the same subgroups of marker elevation patterns (Fig. 4) supports the possibility that these patterns represent real distinctions in the patients. Future research will investigate the associations of the subgroups with clinical phenotypes such as time to progression or overall survival (no such associations have been observed thus far).
Another potential biomarker for the classification of pancreatic cysts is genetic alteration of DNA found in the cyst fluid. In a study of pancreatic cyst tissue employing whole-exome sequencing (7), nine of nine (100%) IPMNs had a genetic alteration in RNF43, KRAS, or GNAS, seven of eight (88%) MCNs had an alteration in either KRAS or RNF43, and eight of eight (100%) SCs had an alteration in the VHL gene. Another study demonstrated the feasibility of a clinical assay based on DNA from cyst fluid, with alterations found in either GNAS or KRAS in 96% of IPMNs (6). The sensitivity and specificity of these genetic assays are similar to those achieved in the current study, and further studies are required in order to evaluate the relative performance of the distinct approaches.
This research was not designed to develop markers for determining which mucinous cysts are likely to progress to cancer, which is the critical clinical challenge once the diagnosis of a mucinous cyst is made. For such studies, protein and glycan biomarkers may have an advantage over genetic biomarkers. Genetic alterations give valuable information about etiology but so far do not differentiate high-grade from low-grade dysplasia in IPMNs (6). In contrast, particular genes (40, 41) and proteins (33), especially the inflammatory cytokine IL-1-β (10), are expressed at elevated levels in IPMNs with invasive or highly dysplastic cells. As protein glycosylation can be affected by inflammatory cytokine signaling (42), specific protein glycoforms may be present only in cysts with high-grade dysplasia. The value of these molecules as biomarkers of prognosis is still unknown.
The nature of the proteins and the altered glycans presented in this study suggests that they contribute to the biology of the disease. Endorepellin is a cleavage product from the C terminus of the matrix glycoprotein perlecan, a proteoglycan found in nearly all epithelial basement membranes. The N terminus of perlecan has been reported to be proangiogenic in tumors (43), but endorepellin may inhibit angiogenesis (43, 44). A previous study found that increased angiogenesis portends poor outcomes in IPMNs (45), so the balance between the pro- and antiangiogenic activities of perlecan could have consequences for tumor progression. MUC5AC expression is associated with malignancy in IPMNs (46), perhaps as a result of MUC5AC stimulating the loss of cell–cell contacts and the expression of factors promoting invasion (47).
The contribution of glycans to these processes is not known but is suggested by previous studies on the relevant structures. Both the H antigen and terminal GlcNAc have links to gut cell phenotypes and changes in differentiation state. The BGH antigen, which consists of fucose alpha-linked to the 2′ carbon of a terminal galactose, may modulate bacterial colonization of the gut, given the increased risk for certain gut infections and autoimmune diseases in people who cannot make the H antigen (48). In addition, levels of H antigen are higher in induced pluripotent stem cells (49) and embryonic stem cells (50) than in fully differentiated cells. The terminal GlcNAc structure, which may be up-regulated in the tissue of several different types of carcinoma (51), can provide protection in the gut from invasion by H. pylori (52). An up-regulation of intestinal-type molecules is further suggested by the intestinal morphology adopted by some IPMNs. If glycoforms indeed are good markers of differentiation states, they could provide useful information about the trajectory of each lesion.
The biomarker panel presented here is highly promising for clinical utility. In addition to the >90% accuracy in both the prevalidation and blinded sample sets, the three-marker panel has other characteristics making it suitable for clinical use: it requires only tiny amounts of cyst fluid, and it could be readily adapted to a rapid and inexpensive clinical assay. The detection of specific glycoforms provided more accurate biomarker performance than the detection of core protein levels, showing the potential importance of glycans in the disease biology.
Supplementary Material
Acknowledgments
We thank Katie Partyka for laboratory support.
Footnotes
* Funding was received from the National Cancer Institute (1U01CA152653) and the Van Andel Research Institute. We gratefully acknowledge additional funding of this work by the Early Detection Research Network (Grant No. 1U01CA152653 to B.B.H.).
 This article contains supplemental material.
1 The abbreviations used are:
- CEA
- carcinoembryonic antigen
- BGH
- blood group H
- MCN
- mucinous cystic neoplasm
- IPMN
- intraductal papillary mucinous neoplasm
- PC
- pseudocyst
- PNET
- pancreatic neuroendocrine tumor
- SC
- serous cystadenoma
- WGA
- wheat germ agglutinin.
REFERENCES
- 1. Matthaei H., Schulick R. D., Hruban R. H., Maitra A. (2011) Cystic precursors to invasive pancreatic cancer. Nat. Rev. Gastroenterol. Hepatol. 8, 141–150 [DOI] [PMC free article] [PubMed] [Google Scholar]
- 2. van der Waaij L. A., van Dullemen H. M., Porte R. J. (2005) Cyst fluid analysis in the differential diagnosis of pancreatic cystic lesions: a pooled analysis. Gastrointest. Endosc. 62, 383–389 [DOI] [PubMed] [Google Scholar]
- 3. Brugge W. R., Lewandrowski K., Lee-Lewandrowski E., Centeno B. A., Szydlo T., Regan S., del Castillo C. F., Warshaw A. L. (2004) Diagnosis of pancreatic cystic neoplasms: a report of the cooperative pancreatic cyst study. Gastroenterology 126, 1330–1336 [DOI] [PubMed] [Google Scholar]
- 4. Nagula S., Kennedy T., Schattner M. A., Brennan M. F., Gerdes H., Markowitz A. J., Tang L., Allen P. J. (2010) Evaluation of cyst fluid CEA analysis in the diagnosis of mucinous cysts of the pancreas. J. Gastrointest. Surg. 12, 1997–2003 [DOI] [PubMed] [Google Scholar]
- 5. Khalid A., Zahid M., Finkelstein S. D., LeBlanc J. K., Kaushik N., Ahmad N., Brugge W. R., Edmundowicz S. A., Hawes R. H., McGrath K. M. (2009) Pancreatic cyst fluid DNA analysis in evaluating pancreatic cysts: a report of the panda study. Gastrointest. Endosc. 69, 1095–1102 [DOI] [PubMed] [Google Scholar]
- 6. Wu J., Matthaei H., Maitra A., Dal Molin M., Wood L. D., Eshleman J. R., Goggins M., Canto M. I., Schulick R. D., Edil B. H., Wolfgang C. L., Klein A. P., Diaz L. A., Jr., Allen P. J., Schmidt C. M., Kinzler K. W., Papadopoulos N., Hruban R. H., Vogelstein B. (2011) Recurrent GNAS mutations define an unexpected pathway for pancreatic cyst development. Sci. Transl. Med. 3, 92ra66. [DOI] [PMC free article] [PubMed] [Google Scholar]
- 7. Wu J., Jiao Y., Dal Molin M., Maitra A., de Wilde R. F., Wood L. D., Eshleman J. R., Goggins M. G., Wolfgang C. L., Canto M. I., Schulick R. D., Edil B. H., Choti M. A., Adsay V., Klimstra D. S., Offerhaus G. J., Klein A. P., Kopelovich L., Carter H., Karchin R., Allen P. J., Schmidt C. M., Naito Y., Diaz L. A., Jr., Kinzler K. W., Papadopoulos N., Hruban R. H., Vogelstein B. (2011) Whole-exome sequencing of neoplastic cysts of the pancreas reveals recurrent mutations in components of ubiquitin-dependent pathways. Proc. Natl. Acad. Sci. U.S.A. 108, 21188–21193 [DOI] [PMC free article] [PubMed] [Google Scholar]
- 8. Raty S., Sand J., Alfthan H., Haglund C., Nordback I. (2004) Cyst fluid tumor-associated trypsin inhibitor may be helpful in the differentiation of cystic pancreatic lesions. J. Gastrointest. Surg. 8, 569–574 [DOI] [PubMed] [Google Scholar]
- 9. Ryu J. K., Matthaei H., Dal Molin M., Hong S. M., Canto M. I., Schulick R. D., Wolfgang C., Goggins M. G., Hruban R. H., Cope L., Maitra A. (2011) Elevated microrna mir-21 levels in pancreatic cyst fluid are predictive of mucinous precursor lesions of ductal adenocarcinoma. Pancreatology 11, 343–350 [DOI] [PMC free article] [PubMed] [Google Scholar]
- 10. Maker A. V., Katabi N., Qin L. X., Klimstra D. S., Schattner M., Brennan M. F., Jarnagin W. R., Allen P. J. (2011) Cyst fluid interleukin-1beta (il1beta) levels predict the risk of carcinoma in intraductal papillary mucinous neoplasms of the pancreas. Clin. Cancer Res. 17, 1502–1508 [DOI] [PMC free article] [PubMed] [Google Scholar]
- 11. Shami V. M., Sundaram V., Stelow E. B., Conaway M., Moskaluk C. A., White G. E., Adams R. B., Yeaton P., Kahaleh M. (2007) The level of carcinoembryonic antigen and the presence of mucin as predictors of cystic pancreatic mucinous neoplasia. Pancreas 34, 466–469 [DOI] [PubMed] [Google Scholar]
- 12. Hammel P. R., Forgue-Lafitte M. E., Levy P., Voitot H., Vilgrain V., Flejou J. F., Molas G., Gespach C., Ruszniewski P., Bernades P., Bara J. (1997) Detection of gastric mucins (m1 antigens) in cyst fluid for the diagnosis of cystic lesions of the pancreas. Int. J. Cancer 74, 286–290 [DOI] [PubMed] [Google Scholar]
- 13. Mann B. F., Goetz J. A., House M. G., Schmidt C. M., Novotny M. V. Glycomic and proteomic profiling of pancreatic cyst fluids identifies hyperfucosylated lactosamines on the N-linked glycans of overexpressed glycoproteins. Mol. Cell. Proteomics 11, M111.015792. [DOI] [PMC free article] [PubMed] [Google Scholar]
- 14. Cuoghi A., Farina A., Z'Graggen K., Dumonceau J. M., Tomasi A., Hochstrasser D. F., Genevay M., Lescuyer P., Frossard J. L. (2011) Role of proteomics to differentiate between benign and potentially malignant pancreatic cysts. J. Proteome Res. 10, 2664–2670 [DOI] [PubMed] [Google Scholar]
- 15. Visser B. C., Yeh B. M., Qayyum A., Way L. W., McCulloch C. E., Coakley F. V. (2007) Characterization of cystic pancreatic masses: relative accuracy of CT and MRI. AJR Am. J. Roentgenol. 189, 648–656 [DOI] [PubMed] [Google Scholar]
- 16. Haab B. B., Porter A., Yue T., Li L., Scheiman J., Anderson M. A., Barnes D., Schmidt C. M., Feng Z., Simeone D. (2010) Glycosylation variants of mucins and CEACAMs as candidate biomarkers for the diagnosis of pancreatic cystic neoplasms. Ann. Surg. 251, 937–945 [DOI] [PMC free article] [PubMed] [Google Scholar]
- 17. Lau K. S., Dennis J. W. (2008) N-glycans in cancer progression. Glycobiology 18, 750–760 [DOI] [PubMed] [Google Scholar]
- 18. Wang Y., Ju T., Ding X., Xia B., Wang W., Xia L., He M., Cummings R. D. (2010) Cosmc is an essential chaperone for correct protein O-glycosylation. Proc. Natl. Acad. Sci. U.S.A. 107, 9228–9233 [DOI] [PMC free article] [PubMed] [Google Scholar]
- 19. Okuyama N., Ide Y., Nakano M., Nakagawa T., Yamanaka K., Moriwaki K., Murata K., Ohigashi H., Yokoyama S., Eguchi H., Ishikawa O., Ito T., Kato M., Kasahara A., Kawano S., Gu J., Taniguchi N., Miyoshi E. (2006) Fucosylated haptoglobin is a novel marker for pancreatic cancer: a detailed analysis of the oligosaccharide structure and a possible mechanism for fucosylation. Int. J. Cancer 118, 2803–2808 [DOI] [PubMed] [Google Scholar]
- 20. Dennis J. W., Granovsky M., Warren C. E. (1999) Glycoprotein glycosylation and cancer progression. Biochim. Biophys. Acta 1473, 21–34 [DOI] [PubMed] [Google Scholar]
- 21. Yue T., Goldstein I. J., Hollingsworth M. A., Kaul K., Brand R. E., Haab B. B. (2009) The prevalence and nature of glycan alterations on specific proteins in pancreatic cancer patients revealed using antibody-lectin sandwich arrays. Mol. Cell. Proteomics 8, 1697–1707 [DOI] [PMC free article] [PubMed] [Google Scholar]
- 22. Yue T., Maupin K. A., Fallon B., Li L., Partyka K., Anderson M. A., Brenner D. E., Kaul K., Zeh H., Moser A. J., Simeone D. M., Feng Z., Brand R. E., Haab B. B. (2011) Enhanced discrimination of malignant from benign pancreatic disease by measuring the CA 19–9 antigen on specific protein carriers. PLoS One 6, e29180. [DOI] [PMC free article] [PubMed] [Google Scholar]
- 23. Chen S., LaRoche T., Hamelinck D., Bergsma D., Brenner D., Simeone D., Brand R. E., Haab B. B. (2007) Multiplexed analysis of glycan variation on native proteins captured by antibody microarrays. Nat. Methods 4, 437–444 [DOI] [PubMed] [Google Scholar]
- 24. Haab B. B. (2010) Antibody-lectin sandwich arrays for biomarker and glycobiology studies. Expert Rev. Proteomics 7, 9–11 [DOI] [PMC free article] [PubMed] [Google Scholar]
- 25. Partyka K., McDonald M., Maupin K. A., Brand R., Kwon R., Simeone D. M., Allen P., Haab B. B. (2012) Comparison of surgical and endoscopic sample collection for pancreatic cyst fluid biomarker identification. J. Proteome Res. 11, 2904–2911 [DOI] [PMC free article] [PubMed] [Google Scholar]
- 26. Haab B. B., Yue T. (2011) High-throughput studies of protein glycoforms using antibody-lectin sandwich arrays. Methods Mol. Biol. 785, 223–236 [DOI] [PMC free article] [PubMed] [Google Scholar]
- 27. Feasley C. L., Johnson J. M., West C. M., Chia C. P. (2010) Glycopeptidome of a heavily N-glycosylated cell surface glycoprotein of dictyostelium implicated in cell adhesion. J. Proteome Res. 9, 3495–3510 [DOI] [PubMed] [Google Scholar]
- 28. West M. B., Segu Z. M., Feasley C. L., Kang P., Klouckova I., Li C., Novotny M. V., West C. M., Mechref Y., Hanigan M. H. (2010) Analysis of site-specific glycosylation of renal and hepatic gamma-glutamyl transpeptidase from normal human tissue. J. Biol. Chem. 285, 29511–29524 [DOI] [PMC free article] [PubMed] [Google Scholar]
- 29. Kang P., Mechref Y., Novotny M. V. (2008) High-throughput solid-phase permethylation of glycans prior to mass spectrometry. Rapid Commun. Mass Spectrom. 22, 721–734 [DOI] [PubMed] [Google Scholar]
- 30. Ceroni A., Dell A., Haslam S. M. (2007) The GlycanBuilder: a fast, intuitive and flexible software tool for building and displaying glycan structures. Source Code Biol. Med. 2, 3. [DOI] [PMC free article] [PubMed] [Google Scholar]
- 31. Ceroni A., Maass K., Geyer H., Geyer R., Dell A., Haslam S. M. (2008) GlycoWorkbench: a tool for the computer-assisted annotation of mass spectra of glycans. J. Proteome Res. 7, 1650–1659 [DOI] [PubMed] [Google Scholar]
- 32. Fallon B. P., Curnutte B., Maupin K. A., Partyka K., Choi S., Brand R. E., Langmead C. J., Tembe W., Haab B. B. (2013) The Marker State Space (MSS) method for classifying clinical samples. PLoS One. 8, e65905 In press [DOI] [PMC free article] [PubMed] [Google Scholar]
- 33. Maker A. V., Katabi N., Gonen M., Dematteo R. P., D'Angelica M. I., Fong Y., Jarnagin W. R., Brennan M. F., Allen P. J. (2010) Pancreatic cyst fluid and serum mucin levels predict dysplasia in intraductal papillary mucinous neoplasms of the pancreas. Ann. Surg. Oncol. 18, 199–206 [DOI] [PMC free article] [PubMed] [Google Scholar]
- 34. Porter A., Yue T., Heeringa L., Day S., Suh E., Haab B. B. (2010) A motif-based analysis of glycan array data to determine the specificities of glycan-binding proteins. Glycobiology 20, 369–380 [DOI] [PMC free article] [PubMed] [Google Scholar]
- 35. Babu P., North S. J., Jang-Lee J., Chalabi S., Mackerness K., Stowell S. R., Cummings R. D., Rankin S., Dell A., Haslam S. M. (2009) Structural characterisation of neutrophil glycans by ultra sensitive mass spectrometric glycomics methodology. Glycoconj. J. 26, 975–986 [DOI] [PMC free article] [PubMed] [Google Scholar]
- 36. Knezevic A., Polasek O., Gornik O., Rudan I., Campbell H., Hayward C., Wright A., Kolcic I., O'Donoghue N., Bones J., Rudd P. M., Lauc G. (2009) Variability, heritability and environmental determinants of human plasma N-glycome. J. Proteome Res. 8, 694–701 [DOI] [PubMed] [Google Scholar]
- 37. Wu J. T. (1990) Serum alpha-fetoprotein and its lectin reactivity in liver diseases: a review. Ann. Clin. Lab. Sci. 20, 98–105 [PubMed] [Google Scholar]
- 38. Miyoshi E., Nakano M. (2008) Fucosylated haptoglobin is a novel marker for pancreatic cancer: detailed analyses of oligosaccharide structures. Proteomics 8, 3257–3262 [DOI] [PubMed] [Google Scholar]
- 39. Parekh R. B., Dwek R. A., Sutton B. J., Fernandes D. L., Leung A., Stanworth D., Rademacher T. W., Mizuochi T., Taniguchi T., Matsuta K., Takeuchi F., Nagano Y., Miyamoto T., Kobata A. (1985) Association of rheumatoid arthritis and primary osteoarthritis with changes in the glycosylation pattern of total serum IgG. Nature 316, 452–457 [DOI] [PubMed] [Google Scholar]
- 40. Cremonesi L., Ferrari M., Giordano P. C., Harteveld C. L., Kleanthous M., Papasavva T., Patrinos G. P., Traeger-Synodinos J. (2007) An overview of current microarray-based human globin gene mutation detection methods. Hemoglobin 31, 289–311 [DOI] [PubMed] [Google Scholar]
- 41. Sato N., Fukushima N., Maitra A., Iacobuzio-Donahue C. A., van Heek N. T., Cameron J. L., Yeo C. J., Hruban R. H., Goggins M. (2004) Gene expression profiling identifies genes associated with invasive intraductal papillary mucinous neoplasms of the pancreas. Am. J. Pathol. 164, 903–914 [DOI] [PMC free article] [PubMed] [Google Scholar]
- 42. Wu Y. M., Nowack D. D., Omenn G. S., Haab B. B. (2009) Mucin glycosylation is altered by pro-inflammatory signaling in pancreatic-cancer cells. J. Proteome Res. 8, 1876–1886 [DOI] [PMC free article] [PubMed] [Google Scholar]
- 43. Whitelock J. M., Melrose J., Iozzo R. V. (2008) Diverse cell signaling events modulated by perlecan. Biochemistry 47, 11174–11183 [DOI] [PMC free article] [PubMed] [Google Scholar]
- 44. Mongiat M., Sweeney S. M., San Antonio J. D., Fu J., Iozzo R. V. (2003) Endorepellin, a novel inhibitor of angiogenesis derived from the C terminus of perlecan. J. Biol. Chem. 278, 4238–4249 [DOI] [PubMed] [Google Scholar]
- 45. Tachezy M., Reichelt U., Melenberg T., Gebauer F., Izbicki J. R., Kaifi J. T. (2010) Angiogenesis index cd105 (endoglin)/cd31 (pecam-1) as a predictive factor for invasion and proliferation in intraductal papillary mucinous neoplasm (IPMN) of the pancreas. Histol. Histopathol. 25, 1239–1246 [DOI] [PubMed] [Google Scholar]
- 46. Kanno A., Satoh K., Kimura K., Hirota M., Umino J., Masamune A., Satoh A., Asakura T., Egawa S., Sunamura M., Endoh M., Shimosegawa T. (2006) The expression of MUC4 and MUC5AC is related to the biologic malignancy of intraductal papillary mucinous neoplasms of the pancreas. Pancreas 33, 391–396 [DOI] [PubMed] [Google Scholar]
- 47. Inaguma S., Kasai K., Ikeda H. (2011) GLI1 facilitates the migration and invasion of pancreatic cancer cells through MUC5AC-mediated attenuation of E-cadherin. Oncogene 30, 714–723 [DOI] [PubMed] [Google Scholar]
- 48. Rausch P., Rehman A., Kunzel S., Hasler R., Ott S. J., Schreiber S., Rosenstiel P., Franke A., Baines J. F. (2011) Colonic mucosa-associated microbiota is influenced by an interaction of Crohn disease and FUT2 (secretor) genotype. Proc. Natl. Acad. Sci. U.S.A. 108, 19030–19035 [DOI] [PMC free article] [PubMed] [Google Scholar]
- 49. Hasehira K., Tateno H., Onuma Y., Ito Y., Asashima M., Hirabayashi J. (2012) Structural and quantitative evidence for dynamic glycome shift on production of induced pluripotent stem cells. Mol. Cell. Proteomics 11, 1913–1923 [DOI] [PMC free article] [PubMed] [Google Scholar]
- 50. Satomaa T., Heiskanen A., Mikkola M., Olsson C., Blomqvist M., Tiittanen M., Jaatinen T., Aitio O., Olonen A., Helin J., Hiltunen J., Natunen J., Tuuri T., Otonkoski T., Saarinen J., Laine J. (2009) The N-glycome of human embryonic stem cells. BMC Cell Biol. 10, 42. [DOI] [PMC free article] [PubMed] [Google Scholar]
- 51. Satomaa T., Heiskanen A., Leonardsson I., Angstrom J., Olonen A., Blomqvist M., Salovuori N., Haglund C., Teneberg S., Natunen J., Carpen O., Saarinen J. (2009) Analysis of the human cancer glycome identifies a novel group of tumor-associated N-acetylglucosamine glycan antigens. Cancer Res. 69, 5811–5819 [DOI] [PubMed] [Google Scholar]
- 52. Kobayashi M., Lee H., Nakayama J., Fukuda M. (2009) Roles of gastric mucin-type O-glycans in the pathogenesis of Helicobacter pylori infection. Glycobiology 19, 453–461 [DOI] [PMC free article] [PubMed] [Google Scholar]
Associated Data
This section collects any data citations, data availability statements, or supplementary materials included in this article.