

Abstract
Amyloid plaques are crucial for the pathogenesis of Alzheimer disease (AD). Phagocytosis of fibrillar β-amyloid (Aβ) by activated microglia is essential for Aβ clearance in Alzheimer disease. However, the mechanism underlying Aβ clearance in the microglia remains unclear. In this study, we performed stable isotope labeling of amino acids in cultured cells for quantitative proteomics analysis to determine the changes in protein expression in BV2 microglia treated with or without Aβ. Among 2742 proteins identified, six were significantly up-regulated and seven were down-regulated by Aβ treatment. Bioinformatic analysis revealed strong over-representation of membrane proteins, including lipoprotein lipase (LPL), among proteins regulated by the Aβ stimulus. We verified that LPL expression increased at both mRNA and protein levels in response to Aβ treatment in BV2 microglia and primary microglial cells. Silencing of LPL reduced microglial phagocytosis of Aβ, but did not affect degradation of internalized Aβ. Importantly, we found that enhanced cyclin-dependent kinase 5 (CDK5) activity by increasing p35-to-p25 conversion contributed to LPL up-regulation and promoted Aβ phagocytosis in microglia, whereas inhibition of CDK5 reduced LPL expression and Aβ internalization. Furthermore, Aβ plaques was increased with reducing p25 and LPL level in APP/PS1 mouse brains, suggesting that CDK5/p25 signaling plays a crucial role in microglial phagocytosis of Aβ. In summary, our findings reveal a potential role of the CDK5/p25-LPL signaling pathway in Aβ phagocytosis by microglia and provide a new insight into the molecular pathogenesis of Alzheimer disease.
Alzheimer disease (AD)1 is one of the most common neurodegenerative disorders, which is characterized by pathological hallmarks such as neuronal and synaptic loss, neurofibrillary tangles (NFTs), and senile plaques. The intracellular NFTs are mainly composed of hyper-phosphorylated microtubule-associated protein tau, whereas toxic fibrillar β-amyloid (fAβ) as the main component of senile plaques is generated by sequential proteolytic cleavage of trans-membrane β-amyloid precursor protein (APP) by β- and γ-secretases. fAβ can induce oxidative stress-mediated neuronal cell death and cause cognitive impairment in mouse brains (1). Many reports suggest that fAβ induces dysregulation of two pivotal kinases CDK5 (2, 3) and GSK-3 (4), which are crucial regulators of hyperphosphorylated tau and increased production of Aβ from APP, and thereby triggers the cascade of signal transduction events underlying neuronal cell death in AD pathogenesis.
As the resident immune cells in the brain, microglia can be activated in response to fAβ and often accumulate around the amyloid deposits in the brains of AD patients. Activated microglia trigger the production of inflammatory factors, reactive oxygen species, and chemokines, which may cause neuronal cell death (5). Furthermore, increasing evidence supports that activated microglia exert a vital beneficial role in the clearance of Aβ by phagocytosis. Many receptors, including scavenger receptor A (SR-A) (6), scavenger receptor class B type I (SR-BI) (7), lipopolysaccharide receptor (CD14) (8), CD33 (9), B-class scavenger receptor CD36 (10), CD47 (11), β1 integrin (12), toll-like receptor 2 (TLR2) (13), and toll-like receptor 4 (TLR4) (14), have been implicated in microglial phagocytosis of fAβ via direct or indirect binding to Aβ. Microglial phagocytosis of fAβ is also regulated by proinflammatory cytokines (15) and chemokine receptor CX3CR1 (16). Farfara et al. reported that the γ-secretase component presenilin, which is responsible for APP cleavage and Aβ production in neurons, is important for microglial fAβ clearance, indicating a dual role for presenilin in neuronal cell death and microglial phagocytosis (17). In addition, accumulating evidence suggests a critical role of lipids and lipoproteins in microglial fAβ phagocytosis and clearance. Lee et al. reported that apolipoprotein E (ApoE) enhances fAβ trafficking and degradation, indicating a role of cholesterol in fAβ degradation (18). After internalization, fAβ is degraded through the lysosome pathway (19, 20). However, the mechanism underlying microglial internalization of fAβ remains unclear.
Stable isotope labeling of amino acids in cell culture (SILAC) is an accurate and reproducible mass spectrometry-based quantitative proteomics approach for examining changes in protein expression or post-translational modifications at a large scale (21, 22). Here, we used the SILAC quantitative proteomics strategy to investigate changes in the protein levels in BV2 microglia treated with fAβ. We found that 6 proteins were up-regulated and 7 were down-regulated significantly by Aβ treatment. Interestingly, bioinformatic analysis revealed that most of these up- or down-regulated proteins, including lipoprotein lipase (LPL), were mainly distributed in the cell membrane. We verified that LPL was up-regulated at both gene and protein levels in BV2 and primary microglia in response to fAβ, thereby indicating its role in the microglial phagocytosis of Aβ. Importantly, we further demonstrated that CDK5, which is a critical serine/threonine kinase in the pathogenesis of AD, regulated the expression of LPL and played a critical role in Aβ phagocytosis of microglia. Moreover, we found that increase in the p35-to-p25 conversion contributed to the enhanced CDK5 activity under Aβ stimulus and played a vital role in regulation of LPL expression and microglial Aβ phagocytosis. Our results suggest a role of the CDK5/p25-LPL signaling pathway in Aβ phagocytosis of microglia and provide valuable information to understand the molecular mechanism underlying microglial fAβ phagocytosis.
EXPERIMENTAL PROCEDURES
Preparation of fAβ and Electron Microscopy
Human Aβ1–42 (AnaSpec, San Jose, CA) was dissolved in 1 mm PBS and incubated at 37 °C for 1 week before use. The ultrastructure of the peptide aggregates was assessed by transmission electron microscopy. Twenty microliters of 1 mm Aβ1–42 was incubated on a Formvar-coated 300-mesh copper grid for 10 min. Then, the samples on the grids were stained with 2% phosphotungstic acid and analyzed by transmission electron microscopy at 120 kV (Tecnai G2 20; FEI, Hillsboro, OR).
Cell Culture
BV2 microglia were obtained from the Cell Resource Center of Peking Union Medical College Hospital and maintained in Dulbecco's modified Eagle medium (DMEM) supplemented with 10% fetal bovine serum (FBS) (Hyclone, Los Angeles, CA), 100 U/ml penicillin, and 100 μg/ml streptomycin. BV2 cells were cultured at 37 °C with 5% CO2 and 95% relative humidity. For SILAC labeling, BV2 cells were cultured in L-lysine- and L-arginine-depleted high glucose DMEM (ThermoFisher Scientific, Rockford, IL) supplemented with 10% dialyzed FBS (ThermoFisher Scientific), antibiotics, and either 12C6 L-lysine and 12C614N4 L-arginine (light labeled) or 13C6 L-lysine and 13C615N4 L-arginine (heavy labeled). At 80–90% confluence, cells were subcultured at a ratio of 1:3. After 5 subcultures, 60% confluent cells were pretreated with serum-free medium for 24 h. Then, heavy-labeled cells were treated with 2 μM fAβ for 24 h and light-labeled cells were treated with the same volume of PBS as the control.
Primary rat microglia were prepared from whole brains of 1–2-day-old Sprague-Dawley rats according to a previously published protocol (23, 24). Briefly, pups were decapitated, and the meninges and blood vessels were completely removed from the cortices, which were then minced and digested with trypsin (0.25%) and Dnase I (0.01%) for 30 min at 37 °C. DMEM containing 10% FBS and 1% penicillin-streptomycin was used to stop the digestion. Cells were then triturated and plated on 150-mm dishes (Corning, New York, NY). The medium was replaced with fresh DMEM containing 10% FBS, and the cells were cultured for 14–21 days at 37 °C and 5% CO2. Primary microglia were isolated by shaking the tissue culture plates for 2 h at 260 rpm at room temperature to remove loosely adherent microglia. Cells were counted and plated at the appropriate density for experiments in DMEM/F12 containing 2% FBS overnight. The remaining mixed cells were cultured and shaken as described to obtain primary microglia continuously. Before the experiments, the medium was changed to serum-free DMEM/F12 and the cells were cultured overnight. The enriched microglia were >98% pure, as determined by counting cells that were immunoreactive for Iba-1 and glial fibrillary acidic protein (GFAP).
Sample Preparation and OFFGEL Separation
Light and heavy labeled BV2 cells were washed three times with ice-cold PBS, and lysed in lysis buffer (40 mm Tris, 7 m urea, 2 m thiourea, 4% 3-[(3-cholamidopropyl)dimethylammonio]propanesulfonate, 1% dithiothreitol, 1% PI, and 10% D/RNase) with brief sonication. Following centrifuged at 12,000 × g and 4 °C, the protein content of the supernatant was measured with a 2-D Quant kit (GE Healthcare, Pittsburgh, PA). Cell lysates were mixed and protein samples containing 100 μg of protein were prepared. The protein samples were digested with sequencing-grade trypsin (Promega, Madison, WI) according to the filter aided sample preparation (FASP) method (25). The peptide mixtures were dissolved in a focusing buffer containing 5% glycerol and 2% IPG buffer (pH 3–10; GE Healthcare, USA) and loaded into 24 wells over a 24-cm Immobiline Dry Strip (pH 3–10, GE Healthcare, Pittsburgh, PA). Then, the peptide mixtures were separated by IEF on a 3100 OFFGEL fractionator (Agilent Technologies, Santa Clara, CA) according to the method recommended by the manufacturer. Twenty-four fractions were acidified with trifluoroacetic acid and desalted with C18 StageTips (26).
LC-MS/MS Analysis
The digests were dissolved in 0.2% formic acid, and then separated by a Nano-LC system (Micro-Tech Scientific, Vista, CA) which was equipped with a C18 reverse phase column. The column was eluted with linear gradients of 5–32% acetonitrile in 0.2% formic acid at a constant flow rate of 500 nl/min for 100 min. The HPLC system was coupled to an LTQ Orbitrap XL (ThermoFisher Scientific, Rockford, IL) coupled to a nano-ES ion source (Proxeon Biosystems, Denmark). The spray voltage was set to 2.0 kV. Full-scan MS survey spectra (m/z 300–1600) in profile mode were acquired in the Orbitrap with a resolution of 60,000 after accumulation of 1,000,000 ions. The five most intense peptide ions from the preview scan in the Orbitrap were fragmented by collision-induced dissociation (normalized collision energy, 35%; activation Q, 0.250; and activation time, 30 ms) in the LTQ after the accumulation of 30,000 ions. Maximal filling times were 500 ms for the full scans and 150 ms for the MS/MS scans. Precursor ion charge state screening was enabled, and all unassigned charge states as well as singly charged species were rejected. The dynamic exclusion list was restricted to a maximum of 500 entries with a maximum retention period of 60 s and a relative mass window of 10 ppm. The data were acquired using Xcalibur 2.2 (ThermoFisher Scientific, Rockford, IL).
Data Analysis
Raw mass spectra files were processed with MaxQuant software (27, 28) (version 1.3.0.5), that performs peak list generation, SILAC and extracted ion current-based quantitation, false positive rate determination based on search engine results, peptide to protein group assembly, and data filtration and presentation. All raw data of the four biological repeats were searched together. The data were searched against the UniProt mouse protein sequence database (last update: April 2013, 50,798 protein sequences), supplemented with frequently observed contaminants and concatenated with reversed copies of all sequences. Searching parameters were set as follows: enzyme was trypsin; up to two missed cleavages; carbamidomethyl cysteine as fixed modification; oxidized methionine and N-acetylation were set as variable modifications. Maximum allowed mass deviation was set initially to 6 ppm for monoisotopic precursor ions and to 0.5 Da for fragment ions. The required false discovery rate was set to 1% at peptide and protein levels, and the minimum required peptide length was set to seven amino acids. At least one unique or razor peptide per protein group was required for protein identification. Only protein groups with at least two quantified peptides were considered for data analysis.
Bioinformatics
The GeneCoDis web-based tool v.3 was used to determine whether certain Gene Ontology (GO) categories and their combinations were over-represented among differentially expressed proteins (http://genecodis.cnb.csic.es/) (29, 30). GO cellular components (GOCC) and KEGG pathway analysis were performed by aligning the UniProt numbers of the proteins in a defined input list. Over-representation of the selected GO categories (GOCC and KEGG pathway) in the input gene lists was determined using the hypergeometric test with stimulation-based correction.
RNA Isolation and Quantitative Real-time PCR
Real-time quantitative PCR was used to determine the expression of LPL in BV2 cells or mouse primary microglia. BV2 cells or primary microglia were seeded in 12-well culture plates and incubated in the absence or presence of 2 μM Aβ1–42 for 24 h in serum-free DMEM. The cells were washed 3 times with PBS and lysed in 0.5 ml Trizol reagent (Invitrogen, Carlsbad, CA) to recover the total RNA according to the manufacturer's protocol. One microgram of total RNA was reverse transcribed to cDNA using a HiFi-MMLV cDNA first strand synthesis Kit (CW Bio, China). Quantitative PCR was carried out using GoTaqq PCR Master Mix (Promega, Madison, WI) and detected by a Real Time PCR Detection system (Bio-Rad, Hercules, CA). The primers were designed according to the gene sequences in GenBank (LPL: sense strand, 5′-ATGGATGGACGGTAACGGGAA-3′; antisense strand, 5′-CCCGATACAACCAGTCTACTACA-3′). Quantification of mRNA expression was calculated by the comparative cycle method as described by the manufacturer.
Western Blotting
The cells were harvested in lysis buffer consisting of 50 mm Tris-HCl (pH 7.5), 150 mm NaCl, 1% Nonidet P-40, 1% SDS, and a protease inhibitor mixture. The protein concentration was measured by a 2-D Quant kit (GE Healthcare, Pittsburgh, PA). Protein homogenates were resolved by 12.5% SDS-PAGE and transferred onto PVDF membranes using a semi-dry blotting apparatus (Bio-Rad, Hercules, CA). After blocking with 5% milk powder in PBS with 0.05% Tween 20, the membranes were incubated overnight at 4 °C with primary antibodies and then a HRP-conjugated secondary antibody (Jackson ImmunoResearch, West Grove, PA). The following primary antibodies were used in this study: mouse monoclonal anti-lipoprotein lipase (ab21356; Abcam, Cambridge, UK), monoclonal mouse anti-Aβ1–16 (6E10) (SIG39320; Covance, Princeton, NJ), and anti-p25/35 (#2680; Cell Signaling Technology, Danvers, MA). Protein bands were visualized by chemiluminescence. The protein content was normalized to the expression level of GAPDH protein. Bands were quantified using Image J software (National Institutes of Health, Bethesda, MD).
RNA Interference
BV2 cells grown in 12-well plates for 24 h were transfected with siRNAs against target genes (LPL siRNA: sc-44901; CDK5 siRNA: sc-35047; p35 siRNA: sc-36154; Santa Cruz Biotechnology, Santa Cruz, CA) or control siRNA (sc-37007, Santa Cruz Biotechnology) with Lipofectamine RNAiMAX (Invitrogen, Carlsbad, CA). At 36 h post-transfection, cells were treated with 500 nm Aβ1–42 at 37 °C for 0.5 h, and then Aβ in the cytoplasm was analyzed as described above.
CDK5 Inhibitor Treatment
BV2 cells or primary microglia were treated with 20 μM roscovitine (R7772; Sigma, St. Louis, MO) or vehicle for 8 h. Then, the cells were treated with 500 nm Aβ1–42 for 0.5 h. Aβ levels in the cytoplasm were analyzed as described above.
p25 Overexpression Assay
The pcDNA3.1 plasmid with GFP-tagged human p25 (plasmid 1343; Addgene, Cambridge, MA) was transfected into BV2 cells using pcDNA3.1 as the control. After 24 h of transfection, the cells were treated with 500 nm Aβ1–42 at 37 °C for 0.5 h. The levels of p25, LPL, and Aβ in the cytoplasm were analyzed as described above.
CDK5 Kinase Assay
BV2 cells were treated with 2 μM fAβfor 24 h, lysed in buffer containing 50 mm Tris-HCl (pH 7.4), 150 mm NaCl, 1% Nonidet P-40, 5 mm EDTA, 1% PI, 1 mm Na3VO4, and 1 mm NaF on ice, placed on a roller at 4 °C for 30 min, and then centrifuged at 14,000 × g for 15 min. The protein extracts were immunoprecipitated with an anti-CDK5 primary antibody (#2506; Cell Signaling Technology, Danvers, MA) at 4 °C for 2 h. Protein A agarose beads were added, followed by incubation for 2 h at 4 °C. The beads were washed with lysis buffer and then kinase buffer (50 mm Tris-HCl [pH 7.4], 10 mm MgCl2, 1 mm dithiothreitol, 1 mm EGTA, and 1 mm NaF). A kinase reaction buffer consisting of 150 μM ATP, 10 μCi [γ-32P]-ATP (specific activity: 6000 Ci/mmol; NEN, Boston, MA), and 125 μg/ml histone H1 was added to the protein samples, followed by incubation at 30 °C for 30 min. The kinase reaction was then terminated by addition of 4× SDS loading buffer. Samples were boiled for 5 min and separated by 12.5% SDS-PAGE. The gel was dried and visualized by autoradiography.
Examination of LPL and p25 Expression in the APP/PS1 AD Mouse Model
Mouse cerebral cortices were homogenized in the lysis buffer and then centrifuged at 12,000 × g for 30 min. Protein samples (25 μg) were separated by 12.5% SDS-PAGE and immunoblotted with specific antibodies for p25, LPL, and Aβ.
Aβ1–42 Degradation Assay
BV2 cells were transfected with siRNA or control siRNA as described above. At 36 h post-transfection, microglia were incubated with 500 nm Aβ1–42 at 37 °C for 0.5 h. Then, the cells were washed 3 times with DMEM and incubated in DMEM for 3, 12, 24, and 36 h. Aβ levels in the cell lysates were then analyzed by Western blotting as described above.
Statistical Analysis
Data were analyzed using the GraphPad Prism 5.0 software and represented as the means ± S.D. of at least three independent experiments. Multiple sets of data were analyzed by one-way or two-way ANOVA, and Student's t test was used to analyze two sets of data. The significance level was set at p < 0.05.
RESULTS
fAβ1–42 Can Activate BV2 Microglia
The structure of Aβ1–42 aggregates was characterized by electron microscopy. Electron microscopic analysis showed that Aβ1–42 formed several micrometers of fibrils (supplemental Fig. S1). Notably, IL-1β and iNOS were the main factors involved in the inflammatory activation process of microglia (31, 32). Activation of BV2 cells induced by 2 μM fAβ was revealed by RT-PCR detection of IL-1β and iNOS. As shown in Fig. 1A, IL-1β was observed as early as 0.5 h after fAβ treatment and reached higher levels after 1 h, whereas iNOS appeared at 3 h post-fAβ treatment. These results indicated that fAβ enhanced the microglial production of inflammatory factors and induced microglial activation.
Fig. 1.
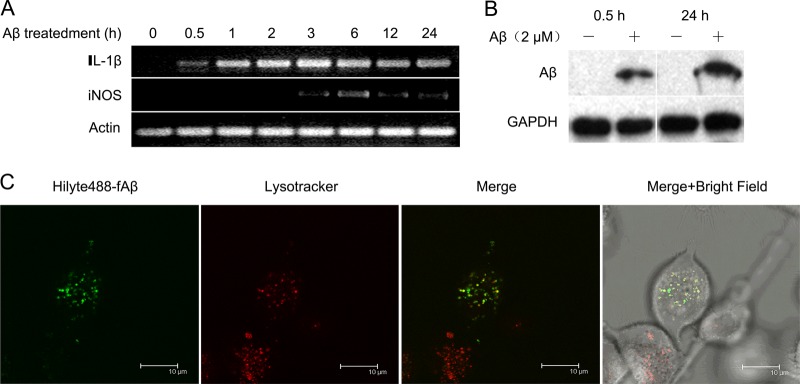
Aβ internalization model in BV2 microglial cells. A, Inflammation assay. BV2 cells were treated with 2 μM fAβ for 0.5, 1, 2, 3, 6, 12, and 24 h. The inflammatory IL-1 and iNOS were examined using RT-PCR. B, Phagocytosis assay. BV2 cells were incubated with Aβ (500 nm) at 37 °C for 0.5 h and 24 h. The Aβ levels in BV2 cells were determined by Western blotting. C, Colocalization assay. Confocal microscopy of intracellular Aβ positioning in BV2 cells incubated with acidophilic lysomotropic dye (LysoTracker Red; red) and HiLyte 488-conjugated Aβ (green). Arrows indicate phagocytosed Aβ overlaid with the lysomotropic dye in small lysosomes; Scale bar, 10 μm.
Activated Microglia Phagocytose fAβ for Degradation in the Lysosome Pathway
To determine whether activated microglia can phagocytose fAβ, BV2 cells were incubated with 2 μM fAβ. A significant amount of Aβ was detected in BV2 cells after 0.5 h of fAβ treatment, indicating that BV2 cells internalized Aβ rapidly. We also obtained increased levels of cellular Aβ after 24 h of treatment with 2 μM fAβ (Fig. 1B). To gain an insight into the degradation pathway of internalized Aβ1–42, we examined the localization of internalized Aβ1–42 through immunocytochemistry and confocal microscopy. BV2 cells were incubated with Hilyte 488-conjugated Aβ1–42 (500 nm) and lysotracker (acidophilic lysomotropic marker) for 0.5 h. We found that many Hilyte 488-conjugated Aβ1–42 signals were co-localized with lysotracker signals, suggesting that the internalized Aβ1–42 was quickly trafficked into late lysosomal compartments (Fig. 1C).
A Proteomic Screen to Detect Changes in BV2 Cell Phagocytosis of fAβ
Considering that BV2 cells could be activated and phagocytose fAβ, we investigated the proteins that might be implicated in microglial phagocytosis of fAβ by performing SILAC quantitation and high resolution nanoLC-MS/MS analysis (Fig. 2A). BV2 microglia were prelabeled with either 12C6 L-lysine and 12C614N4 L-arginine (light labeled) or 13C6 L-lysine and 13C615N4 L-arginine (heavy labeled). Heavy-labeled cells were treated with 2 μM fAβ for 24 h. Equal protein quantities from light- and heavy-labeled cells were processed using the FASP method. Digested peptides were fractionated by IEF and subjected to high resolution nanoLC-MS/MS analysis. SILAC experiments were carried out as four biological replicates (replicates a, b, c, and d). A total of 96 raw data sets (24 × 4 replicates) were compiled for MaxQuant analysis. Based on four measurements, 2742 proteins were identified at a false discovery rate of < 1% after removing contaminants, reverse assignments, and proteins without unique peptides, of which 2528 proteins were quantified (supplemental Table S1). Fig. 2B shows the SILAC ratio distribution for all quantified proteins. By calculating the correlation among the four separate biological replicates, we obtained a mean correlation among measurements of 0.71 (supplemental Fig. S2). Proteins with a normalized H/L ratio of at least 1.5 or no more than 0.67 were considered as altered proteins. For all subsequent data analysis, we only chose proteins that were quantified in at least two biological replicates. Using these rigorous criteria, 13 protein groups were found to be changed, among which six were up-regulated and seven were down-regulated by Aβ treatment (Table I & supplemental Table S2).
Fig. 2.

SILAC workflow and protein quantification analysis. A, A schematic workflow of the SILAC experiments. In experiments, heavy labeled BV2 microglial cells were treated with 2 μM Aβ for 24 h. The cell lysate with equal protein were mixed and digested according to FASP method. The peptide mixtures were separated in 24 fractions by peptide IEF on a OFFGEL fractionator. The 24 fractions were acidified, desalted with C18 StageTips, and analyzed by LC-MS/MS. B, The SILAC ratio distribution for each protein represents the relative expression difference between heavy- and light- labeled BV2 microglial cells. Proteins were sorted and plotted by log2 SILAC ratios.
Table I. Significantly altered protein abundances of Aβ treated BV2 cell.
| Protein ID (Uniprot) | Protein name | Gene name | Unique peptidesa | SILAC ratiob | Locationc |
|---|---|---|---|---|---|
| Q8BGX0 | E3 ubiquitin-protein ligase TRIM23 | Trim23 | 1 | 2.724 | GM, LM, N |
| P08226 | Apolipoprotein E | Apoe | 11 | 2.105 | M |
| P11152 | Lipoprotein lipase | Lpl | 5 | 1.680 | M |
| Q9JLZ6 | Hypermethylated in cancer 2 protein | Hic2 | 1 | 1.666 | PM, N |
| O08992 | Syntenin-1 | Sdcbp | 3 | 1.557 | M |
| P41731 | CD63 antigen | Cd63 | 1 | 1.522 | M, E, L |
| Q9JK38 | Glucosamine 6-phosphate N-acetyltransferase | Gnpnat1 | 3 | 0.448 | M, E, G |
| P15864 | Histone H1.2 | Hist1h1c | 1 | 0.431 | N |
| D3Z6Q9 | Bridging integrator 2 | Bin2 | 2 | 0.254 | M, C |
| P12023 | Amyloid beta A4 protein | App | 3 | 0.158 | M |
| Q8BJI1 | Sodium-dependent neutral amino acid transporter SLC6A17 | Slc6a17 | 1 | 0.156 | PM |
| Q8C196 | Carbamoyl-phosphate synthase [ammonia] | Cps1 | 1 | 0.113 | Mito, N |
| Q60850 | Solute carrier family 23 member 3 | Slc23a3 | 1 | 0.008 | M, C |
a Number of unique peptides identified by MS/MS.
b SILAC normalized ratio that analyzed by MaxQuant which combined with four biological repeats. Accurated to three decimal places.
c Subcellular localization (C: cytoplasm; E: endosome; G: golgi apparatus; L: lysosome; LM: lysosome membrane; M: membrane; Mito: mitochondria; N: nucleus; PM: Plasma membrane ).
To gain an insight into the functional importance of these up- and down-regulated proteins, we performed enrichment analysis of the GO and KEGG terms of regulated proteins, as determined by SILAC, using GeneCodis (Table I). Interestingly, we found that eight altered proteins, including ApoE and LPL, were distributed in the cell membrane by GO cellular component analysis (Supplemental Fig. S4). ApoE plays a critical role in Aβ clearance through its capacity to enhance Aβ uptake and degradation (18). These results further confirmed the reliability of our proteomic data. Through the KEGG pathway analysis, we found that these up- and down-regulated proteins were also involved in AD, the PPAR signaling pathway, and lysosomes (supplemental Fig. S3). PPAR-γ signaling and the lysosome pathway are critical in Aβ clearance by activated microglia (33).
Validation of LPL in BV2 and Rat Primary Microglia
Modulation of the expression levels of the identified proteins by fAβ treatment suggested that these proteins may be involved in fAβ mediated microglial activation or phagocytosis. LPL catalyzes the hydrolysis of triacylglycerol and mediates cellular uptake of lipoproteins by functioning as a “bridging molecule” between lipoproteins and sulfated glycosaminoglycans or lipoprotein receptors in blood vessels (34, 35). Further, it has been reported to be up-regulated in AD brains. Therefore, we focused on LPL for further analysis.
LPL expression was measured in fAβ-treated BV2 and rat primary microglia by quantitative PCR and Western blotting analysis. As shown in Fig. 3, LPL increased at mRNA and protein levels by fAβ treatment. These results were consistent with the SILAC quantification results (Table I).
Fig. 3.

qPCR and Western blotting confirmation of LPL in BV2 and primary microglial cells. BV2 or primary microglial cells were incubated with Aβ (2 μM) at 37 °C for 24 h. A, LPL mRNA levels were measured by quantitative PCR (qPCR). B, The LPL protein levels in cells were determined by Western blotting. The bands were analyzed by Image J, and the relative gray-scale was presented by the bar. (*p < 0.05, **p < 0.01, comparison against nontreated teams, two-tailed t test.). Bars, means ±S.D. (n = 3).
Knockdown of LPL Decreases Microglial Phagocytosis of Aβ, but Does Not Affect Internalized Aβ Degradation
To examine whether LPL is involved in microglial phagocytosis of fAβ, transient knockdown of LPL expression was performed by transfection of siRNA specific for LPL. After 36 h of transfection, both the mRNA and protein levels of LPL decreased to 11.0% and 41.3% of that in the control (supplemental Fig. S5), respectively. Next, the cells were treated with 500 nm fAβ at 37 °C for 0.5 h. Western blotting results showed that cellular internalization of fAβ by microglia was significantly decreased by LPL knockdown (Fig. 4A).
Fig. 4.

LPL knockdown decreases microglial phagocytosis of Aβ but has no effect on the degradation of Aβ. BV2 cells were transfected with 10 nm siRNA specific for LPL (siRNALPL) and control siRNA (siRNACON). Thirty six hours after transfection, cells were treated with Aβ1–42 (500 nm) at 37 °C for 0.5 h. A, The level of Aβ1–42 of microglia phagocytosis was determined by Western blotting. B, The remanent Aβ in cell medium were washed away, then the cells were incubated in DMEM at 37 °C for 3, 12, 24, and 36 h. The amount of Aβ1–42 remaining in BV2 cells was determined by Western blotting. The bands of Western blotting were analyzed by Image J, and the relative gray-scale was presented by the bar (**p < 0.01; comparison against control siRNA teams, two-tailed t test.). Bars, means ±S.D. (n = 3).
We next tested whether LPL participated in degradation of the internalized Aβ. After transfection of LPL specific siRNA for 36 h, BV2 cells were incubated with 500 nm fAβ at 37 °C for 0.5 h, washed three times in DMEM, and cultured at 37 °C for an additional 3, 12, 24, or 36 h. The Aβ levels in cell lysate were determined by Western blotting. After Aβ was removed for 12 h, Aβ remaining in the control cell lysate partially disappeared, whereas cellular Aβ was almost cleared in LPL knockdown cells. After 36 h, Aβ had completely disappeared in both experimental groups, indicating that the internalized Aβ had degraded in control and LPL siRNA-transfected BV2 cells in a time-dependent manner. This result suggested that knockdown of LPL has no effect on the degradation of internalized Aβ (Fig. 4B).
CDK5 Participates in Microglia Phagocytosis of Aβ by Regulating LPL Expression
As an upstream signaling kinase, dysregulation of CDK5 is involved in tau hyperphosphorylation and Aβ overproduction, and responsible for neuronal cell death (36). Little is known about its function in activated microglia and Aβ phagocytosis. In this study, to define the role of CDK5 in LPL expression and microglial phagocytosis of fAβ, we treated BV2 cells with the specific CDK5 inhibitor roscovitine and observed significant down-regulation of LPL (Fig. 5A), which suggested that CDK5 affected LPL expression. Because LPL is involved in fAβ phagocytosis by microglia, we next assessed the effects of roscovitine on the phagocytic phenotype of fAβ in BV2 cells. As shown in Fig. 5B, roscovitine decreased cellular internalization of Aβ1–42 in microglia to 55.6% of that observed in the untreated control. In rat primary microglia, we observed that roscovitine treatment led to substantial decrease in the internalization of cellular Aβ to 19.3% (Fig. 5D). Next, we found that CDK5 knockdown decreased LPL expression and significantly impaired microglial phagocytosis of Aβ (Fig. 5E). These results suggested that CDK5 might play a critical role in microglial phagocytosis of Aβ, and its decline may decrease Aβ internalization as an upstream regulatory factor for LPL.
Fig. 5.

Inhibition of CDK5 decreases microglial phagocytosis of Aβ by down-regulating LPL expression. A, BV2 cells were treated with 20 μM CDK5 specific inhibitor roscovitine for 8 h. LPL mRNA levels were measured by qPCR. B, After roscovitine treatment for 8 h, BV2 cells were incubated with Aβ1–42 (500 nm) at 37 °C for 0.5 h. The amount of Aβ1–42 remaining in cells was determined by Western blotting. C, D, Primary microglial cells were treated as A, B. E, BV2 cells were transfected with 10 nm siRNA specific for CDK5 (siRNACDK5) and control siRNA (siRNACON). Thirty six hours after transfection, cells were treated with Aβ1–42 (500 nm) at 37 °C for 0.5 h. The levels of CDK5, LPL, and internalized Aβ were determined by Western blotting. The bands were analyzed by Image J, and the relative gray-scale was presented by the bar (*p < 0.05, **p < 0.01; comparison against DMSO or control siRNA, two-tailed t test.). Bars, means ±S.D. (n = 3).
Increased Conversion of p35 to p25 Activates CDK5 and Mediates Microglial Phagocytosis of Aβ
p35 is an indispensible regulatory subunit in CDK5 activation. Proteolytic cleavage of p35 to p25 by calpain leads to enhanced CDK5 activity, hyperphosphorylation of tau proteins, and neuronal cell death (37, 38). To determine whether the CDK5 co-activator p25 is involved in Aβ phagocytosis, we treated primary microglia with 2 μM fAβ for 24 h and found that the conversion of p35 to p25 increased significantly (Fig. 6A). In addition, CDK5 was immunoprecipitated to assess its activity using histone H1 as a substrate in fAβ-treated BV2 cells. As shown in Fig. 6B, CDK5 kinase activity was significantly elevated after fAβ treatment. To access whether p25 is implicated in regulation of LPL expression and Aβ phagocytosis, we transfected siRNA specific for p35 and control siRNA into BV2 cells for 48 h. Next, BV2 cells were treated with 500 nm fAβ at 37 °C for 0.5 h. As shown in Fig. 6C, p35 knockdown decreased LPL expression and impaired microglial phagocytosis of Aβ significantly. Moreover, p25 overexpression induced an increase of LPL and enhanced microglial phagocytosis of Aβ (Fig. 6D). These findings suggested that the increase in p35 to p25 cleavage consequently increased CDK5 activity and enhanced Aβ internalization by regulating LPL expression, suggesting that CDK5/p25 signaling is activated, which subsequently up-regulates LPL expression and promotes microglial phagocytosis of Aβ1–42.
Fig. 6.

Increased conversion of p35 to p25 enhances Aβ phagocytosis through strengthening CDK5/p25-LPL pathway. A, Primary microglial cells were incubated with 2 μM Aβ for 24 h. The levels of p35 and p25 were detected by Western blotting. B, In Aβ treated BV2 cells, CDK5 kinase activity was measured as described under “Experimental Procedures.” C, BV2 cells were transfected with 10 nm siRNA specific for p35 (siRNAp35) and control siRNA (siRNACON) for 36h. D, Plasmid pcDNA 3.1 with GFP tagged p25 was transfected into BV2 cells for 24 h. In C, D, cells were treated with 500 nM Aβ1–42 and then incubated at 37 °C for 0.5 h. The levels of p35, p25, LPL, and Aβ in cytoplasm were determined by Western blotting. The bands were analyzed by Image J, and the relative gray-scale was presented by the bar (*p < 0.05, **p < 0.01; comparison against control siRNA or control empty plasmid teams, two-tailed t test.). Bars, means ±S.D. (n = 3).
CDK5/p25-LPL Signaling in APP/PS1 Mouse Brains
Activated microglia have been suggested to play a beneficial role in Aβ clearance. We considered that an elevated level of p25 may enhance CDK5 activity and up-regulate LPL expression to promote Aβ phagocytosis. Therefore, we investigated whether CDK5/p25 signaling is activated in APP/PS1 mouse brains. We measured p35 to p25 cleavage, LPL expression, and Aβ deposition at different stages of APP/PS1 Mouse cerebral cortices (1, 2, 5, and 13 m). We detected a significant increase in p25 and LPL expression in the brains of 1 and 2 m APP/PS1 mice compared with that in age-matched wild-type mice that showed no Aβ deposition. However, accompanying down-regulation of p25 cleavage and LPL levels in the brains was increase of Aβ deposition in the brains of 5 m and 13 m of APP/PS1 mice (Fig. 7). These results suggest that CDK5/p25-LPL signaling is activated in the microglia, which exerts a beneficial effect on microglial Aβ clearance in AD.
Fig. 7.

CDK5/p25-LPL signaling pathway in APP/PS1 mouse brains. Mouse (1, 2, 5, and 13 m) cerebral cortices were homogenized in the lysis buffer. The levels of Aβ, LPL, and p25 were detected with specific antibody for Aβ, LPL, and p25 using Western blotting (*p < 0.05; **p < 0.01; comparison against age-matched C57 mouse, two-way ANOVA.). Bars, means ±S.D. (n = 3).
DISCUSSION
The age-related deterioration of Aβ homeostasis is considered a critical factor in AD risk. As the main component of senile plaques, soluble Aβ oligomers and abnormal Aβ are crucial in AD pathogenesis. In the brains of individuals with AD, activated microglia have been suggested to be critical for regulation of toxic Aβ clearance (39, 40). The mechanism underlying the microglial internalization of Aβ remains unclear. In the present study, we investigated the changes of proteins in BV2 microglia treated with fAβ using the SILAC approach and identified six up-regulated and seven down-regulated proteins in Aβ-activated BV2 microglia. Several of these proteins are closely associated with AD. Interestingly, we found that many of these regulated proteins were cell membrane proteins. Among these, LPL expression increased at mRNA and protein expression levels in BV2 and primary microglia with fAβ stimulus. We also found that silencing of LPL reduced microglial Aβ phagocytosis, but had no effect on the degradation of internalized Aβ. Furthermore, we demonstrated that the CDK5/p25 complex was activated and that it was involved in Aβ phagocytosis, at least in part, by regulating LPL expression, suggesting that CDK5/p25 signaling plays an important role in microglial phagocytosis of Aβ.
As the innate immune cell type in brains, activated microglia are a key source of toxic neuroinflammatory factors, such as IL-1β and TNF-α, which are harmful to neurons (41). NF-κB inflammatory signaling is essential for the release of toxic IL-1β and TNF-α from activated microglia. In our study, TRIM23 and syntenin-1 were implicated in regulating NF-κB signaling (42, 43). Nonetheless, activated microglia also possess phagocytic and proteolytic activities to uptake and degrade toxic Aβ (6). The receptors on cell membranes are critical for recognition and subsequent uptake of Aβ. Several membrane proteins are involved in Aβ uptake, including SR-A (6), SR-BI (7), CD14 (8), CD33 (9), CD36 (10), CD47 (11), β1 integrin (12), TLR2 (13), and TLR4 (14). In our study, eight of the proteins regulated by Aβ treatment were mainly annotated as cell membrane proteins including ApoE and LPL. ApoE and LPL were up-regulated in Aβ-stimulated microglia, suggesting their potential role in microglial phagocytosis of Aβ. In fact, ApoE has been reported to affect the metabolism of Aβ by influencing Aβ aggregation (44) and facilitating cellular Aβ degradation (45, 46). Moreover, Nishitsuji et al. reported that LPL promotes uptake of Aβ in astrocytes by forming a complex with Aβ without the assistance of ApoE, suggesting a role of LPL in the microglial internalization of Aβ (47).
LPL catalyzes the hydrolysis of triacylglycerol and mediates the cellular uptake of lipoproteins (34, 35). Previous studies have shown that lipoproteins have a critical role in AD pathogenesis. LPL has been reported to be present in amyloid plaques in the hippocampus of AD brains (48, 49). A single nucleotide polymorphism in the LPL coding region is associated with AD incidence (50). In recent epidemiological studies, the prevalence of AD was found to be reduced among individuals taking statins, and this correlation is supported by studies of transgenic mice overexpressing the amyloid precursor protein (51). Given that statins have been shown to stimulate LPL activity (52), LPL may represent a promising target for the treatment and prevention of AD. Our results indicated that LPL knockdown reduced the internalization of Aβ, but had no effect on the degradation of Aβ in microglia. The up-regulation of LPL in response to Aβ stimulus would be helpful to enhance microglial Aβ uptake and clearance. Therefore, we have demonstrated, for the first time, the role of LPL as a regulator of microglial phagocytosis and clearance of Aβ in the brain.
We uncovered a novel role for the CDK5/p25 complex in Aβ phagocytosis and clearance by microglia. CDK5 is a critical proline-directed protein kinase in AD pathogenesis, and its activity is tightly regulated by cleavage of the catalytic subunit p35 to p25. CDK5 plays a critical role in neuronal cell migration, neurite growth, and synaptogenesis in the developing brain (53, 54). In AD brains, increased cleavage of p35 to p25 because of Aβ deposition results in formation of the CDK5/p25 complex and CDK5 overactivation (3), which dysregulates the downstream substrates of CDK5, such as hyperphosphorylated tau proteins (36). Moreover, expression of the CDK5/p25 complex in cultured primary neurons induces cytoskeletal disruption, morphological degeneration, mitochondrial fission (54), and apoptosis (55). In addition, CDK5/p25 increases Aβ production by regulating BACE1 expression, and enhances the Aβ-calpain-CDK5/p25 cycle that aggravates the disease in AD brains. On the other hand, Muyllaert et al. reported that inducible p25 overexpression driven by the CaMKII promoter triggers intense neuroinflammation and rapid microgliosis (56). Whether CDK5 has a role in phagocytosis of Aβ in microglia is unclear. In this study, we found that the increased in the p35-to-p25 conversion in the microglia contributed to enhanced CDK5 activity, which was paralleled by increase in LPL expression and improvement of microglial Aβ phagocytosis. Microglia can be activated before obvious amyloid plaque deposition in the early stages of AD (57) and they play a critical role in reducing Aβ accumulation by enhancing Aβ phagocytosis, clearance, and degradation (58, 59). Here, we found that the CDK5/p25 complex was necessary for microglial phagocytosis of Aβ and induced by regulation of LPL expression. Investigation of CDK5/p25-mediated pathways in microglial Aβ uptake may provide new therapeutic targets for AD treatment.
In summary, we used quantitative proteomics analysis to reveal the changes in the protein levels in BV2 microglia perturbed by fAβ. Among the 2742 identified proteins, six were up-regulated and seven were down-regulated significantly by Aβ. Several of these up- and down-regulated proteins were cell membrane proteins such as ApoE and LPL. We verified that LPL is a novel functional molecule in internalization of Aβ, but not a participant in Aβ degradation by microglia. Furthermore, we found that the CDK5/p25 complex is activated and contributes to LPL up-regulation, which in turn participates in microglial Aβ phagocytosis (Fig. 8). Further studies are needed to establish how CDK5/p25 signaling regulates LPL expression and microglial phagocytosis at the transcriptional level. Considering the critical role of CDK5/p25 signaling in regulating neuronal cell death, our results may revitalize interest in CDK5 inhibitors for the treatment of AD. Our findings provide new insights into the molecular pathogenesis of AD and a potential strategy for AD therapy.
Fig. 8.
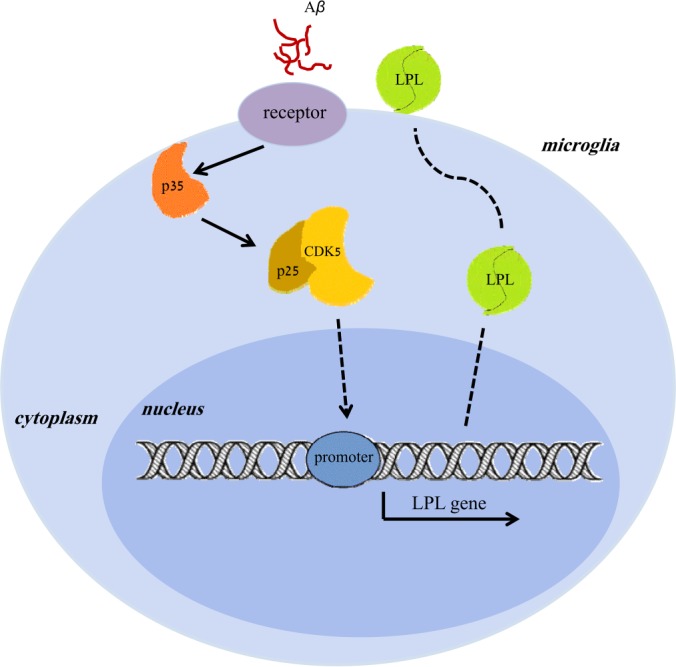
Proposed model of CDK5/p25-LPL signaling mediates microglial phagocytosis of Aβ. In AD, fibrillar Aβ leads to increased conversion of p35 to p25 cleavage, which resultantly enhances CDK5 activity. Activated CDK5/p25 signaling regulates LPL expression at the transcription level and results in LPL up-regulation. Finally, the increased LPL translocates to the outer membrane of microglia and plays a role in facilitating fAβ phagocytosis and clearance by microglia.
Supplementary Material
Footnotes
* This work was supported by grants from National Natural Science Foundation of China (No. 31270872, 30970652, 31200610) and National Key Basic Research Program of China (No. 2010CB912203, 2011CB915504).
 This article contains supplemental Figs. S1 to S5 and Tables S1 and S2.
1 The abbreviations used are:
- AD
- Alzheimer's disease
- ApoE
- Apoliprotein E
- APP
- β-amyloid precursor protein
- CNBP
- Cellular nucleic acid-binding protein
- EM
- electron microscopy
- fAβ
- fibrillar β-amyloid
- FASP
- filter aided sample preparation
- GAG
- glycosaminoglycan
- GFAP
- glial fibrillary acidic protein
- LPL
- lipoprotein lipase
- NFT
- neurofibrillary tangle
- PBS
- phosphate-buffered saline
- SILAC
- stable isotope labeling of amino acid in cell cultures
- SNP
- single nucleotide polymorphism
- SR-A
- scavenger receptor A
- SR-BI
- scavenger receptor class B type I
- TLR2
- Toll-like receptor 2
- TLR4
- Toll-like receptor 4.
REFERENCES
- 1. Sultana R., Butterfield D. A. (2010) Role of oxidative stress in the progression of Alzheimer's disease. J. Alzheimers Dis. 19, 341–353 [DOI] [PubMed] [Google Scholar]
- 2. Cruz J. C., Kim D., Moy L. Y., Dobbin M. M., Sun X., Bronson R. T., Tsai L. H. (2006) p25/cyclin-dependent kinase 5 induces production and intraneuronal accumulation of amyloid beta in vivo. J. Neurosci. 26, 10536–10541 [DOI] [PMC free article] [PubMed] [Google Scholar]
- 3. Patrick G. N., Zukerberg L., Nikolic M., de la Monte S., Dikkes P., Tsai L. H. (1999) Conversion of p35 to p25 deregulates Cdk5 activity and promotes neurodegeneration. Nature 402, 615–622 [DOI] [PubMed] [Google Scholar]
- 4. Avila J., Wandosell F., Hernández F. (2010) Role of glycogen synthase kinase-3 in Alzheimer's disease pathogenesis and glycogen synthase kinase-3 inhibitors. Expert Rev. Neurother. 10, 703–710 [DOI] [PubMed] [Google Scholar]
- 5. Amor S., Puentes F., Baker D., van der Valk P. (2010) Inflammation in neurodegenerative diseases. Immunology 129, 154–169 [DOI] [PMC free article] [PubMed] [Google Scholar]
- 6. Paresce D. M., Ghosh R. N., Maxfield F. R. (1996) Microglial cells internalize aggregates of the Alzheimer's disease amyloid beta-protein via a scavenger receptor. Neuron 17, 553–565 [DOI] [PubMed] [Google Scholar]
- 7. Husemann J., Loike J. D., Kodama T., Silverstein S. C. (2001) Scavenger receptor class B type I (SR-BI) mediates adhesion of neonatal murine microglia to fibrillar beta-amyloid. J. Neuroimmunol. 114, 142–150 [DOI] [PubMed] [Google Scholar]
- 8. Liu Y., Walter S., Stagi M., Cherny D., Letiembre M., Schulz-Schaeffer W., Heine H., Penke B., Neumann H., Fassbender K. (2005) LPS receptor (CD14): a receptor for phagocytosis of Alzheimer's amyloid peptide. Brain 128, 1778–1789 [DOI] [PubMed] [Google Scholar]
- 9. Griciuc A., Serrano-Pozo A., Parrado A. R., Lesinski A. N., Asselin C. N., Mullin K., Hooli B., Choi S. H., Hyman B. T., Tanzi R. E. (2013) Alzheimer's Disease Risk Gene CD33 Inhibits Microglial Uptake of Amyloid Beta. Neuron 78, 631–643 [DOI] [PMC free article] [PubMed] [Google Scholar]
- 10. Kunjathoor V. V., Tseng A. A., Medeiros L. A., Khan T., Moore K. J. (2004) beta-Amyloid promotes accumulation of lipid peroxides by inhibiting CD36-mediated clearance of oxidized lipoproteins. J. Neuroinflammation 1, 23. [DOI] [PMC free article] [PubMed] [Google Scholar]
- 11. Miller T. W., Isenberg J. S., Shih H. B., Wang Y., Roberts D. D. (2010) Amyloid-beta inhibits No-cGMP signaling in a CD36- and CD47-dependent manner. PLoS One 5, e15686. [DOI] [PMC free article] [PubMed] [Google Scholar]
- 12. Koenigsknecht J., Landreth G. (2004) Microglial phagocytosis of fibrillar beta-amyloid through a beta1 integrin-dependent mechanism. J. Neurosci. 24, 9838–9846 [DOI] [PMC free article] [PubMed] [Google Scholar]
- 13. Chen K., Iribarren P., Hu J., Chen J., Gong W., Cho E. H., Lockett S., Dunlop N. M., Wang J. M. (2006) Activation of Toll-like receptor 2 on microglia promotes cell uptake of Alzheimer disease-associated amyloid beta peptide. J. Biol. Chem. 281, 3651–3659 [DOI] [PubMed] [Google Scholar]
- 14. Song M., Jin J., Lim J. E., Kou J., Pattanayak A., Rehman J. A., Kim H. D., Tahara K., Lalonde R., Fukuchi K. (2011) TLR4 mutation reduces microglial activation, increases Abeta deposits and exacerbates cognitive deficits in a mouse model of Alzheimer's disease. J. Neuroinflammation 8, 92. [DOI] [PMC free article] [PubMed] [Google Scholar]
- 15. Koenigsknecht-Talboo J., Landreth G. E. (2005) Microglial phagocytosis induced by fibrillar beta-amyloid and IgGs are differentially regulated by proinflammatory cytokines. J. Neurosci. 25, 8240–8249 [DOI] [PMC free article] [PubMed] [Google Scholar]
- 16. Liu Z., Condello C., Schain A., Harb R., Grutzendler J. (2010) CX3CR1 in microglia regulates brain amyloid deposition through selective protofibrillar amyloid-beta phagocytosis. J. Neurosci. 30, 17091–17101 [DOI] [PMC free article] [PubMed] [Google Scholar]
- 17. Farfara D., Trudler D., Segev-Amzaleg N., Galron R., Stein R., Frenkel D. (2011) gamma-Secretase component presenilin is important for microglia beta-amyloid clearance. Ann. Neurol. 69, 170–180 [DOI] [PubMed] [Google Scholar]
- 18. Lee C. Y., Tse W., Smith J. D., Landreth G. E. (2012) Apolipoprotein E promotes beta-amyloid trafficking and degradation by modulating microglial cholesterol levels. J. Biol. Chem. 287, 2032–2044 [DOI] [PMC free article] [PubMed] [Google Scholar]
- 19. Majumdar A., Capetillo-Zarate E., Cruz D., Gouras G. K., Maxfield F. R. (2011) Degradation of Alzheimer's amyloid fibrils by microglia requires delivery of ClC-7 to lysosomes. Mol. Biol. Cell 22, 1664–1676 [DOI] [PMC free article] [PubMed] [Google Scholar]
- 20. Majumdar A., Cruz D., Asamoah N., Buxbaum A., Sohar I., Lobel P., Maxfield F. R. (2007) Activation of microglia acidifies lysosomes and leads to degradation of Alzheimer amyloid fibrils. Mol. Biol. Cell 18, 1490–1496 [DOI] [PMC free article] [PubMed] [Google Scholar]
- 21. Ong S. E., Mann M. (2006) A practical recipe for stable isotope labeling by amino acids in cell culture (SILAC). Nat. Protoc. 1, 2650–2660 [DOI] [PubMed] [Google Scholar]
- 22. Ong S. E., Blagoev B., Kratchmarova I., Kristensen D. B., Steen H., Pandey A., Mann M. (2002) Stable isotope labeling by amino acids in cell culture, SILAC, as a simple and accurate approach to expression proteomics. Mol. Cell. Proteomics 1, 376–386 [DOI] [PubMed] [Google Scholar]
- 23. McDonald D. R., Brunden K. R., Landreth G. E. (1997) Amyloid fibrils activate tyrosine kinase-dependent signaling and superoxide production in microglia. J. Neurosci. 17, 2284–2294 [DOI] [PMC free article] [PubMed] [Google Scholar]
- 24. Saura J., Tusell J. M., Serratosa J. (2003) High-yield isolation of murine microglia by mild trypsinization. Glia 44, 183–189 [DOI] [PubMed] [Google Scholar]
- 25. Wisniewski J. R., Zougman A., Nagaraj N., Mann M. (2009) Universal sample preparation method for proteome analysis. Nat. Methods 6, 359–362 [DOI] [PubMed] [Google Scholar]
- 26. Thingholm T. E., Jørgensen T. J., Jensen O. N., Larsen M. R. (2006) Highly selective enrichment of phosphorylated peptides using titanium dioxide. Nat Protoc 1, 1929–1935 [DOI] [PubMed] [Google Scholar]
- 27. Cox J., Mann M. (2008) MaxQuant enables high peptide identification rates, individualized p.p.b.-range mass accuracies and proteome-wide protein quantification. Nat. Biotechnol. 26, 1367–1372 [DOI] [PubMed] [Google Scholar]
- 28. Cox J., Matic I., Hilger M., Nagaraj N., Selbach M., Olsen J. V., Mann M. (2009) A practical guide to the MaxQuant computational platform for SILAC-based quantitative proteomics. Nat. Protoc. 4, 698–705 [DOI] [PubMed] [Google Scholar]
- 29. Nogales-Cadenas R., Carmona-Saez P., Vazquez M., Vicente C., Yang X., Tirado F., Carazo J. M., Pascual-Montano A. (2009) GeneCodis: interpreting gene lists through enrichment analysis and integration of diverse biological information. Nucleic Acids Res. 37, W317–W322 [DOI] [PMC free article] [PubMed] [Google Scholar]
- 30. Tabas-Madrid D., Nogales-Cadenas R., Pascual-Montano A. (2012) GeneCodis3: a non-redundant and modular enrichment analysis tool for functional genomics. Nucleic Acids Res. 40, W478–W483 [DOI] [PMC free article] [PubMed] [Google Scholar]
- 31. Halle A., Hornung V., Petzold G. C., Stewart C. R., Monks B. G., Reinheckel T., Fitzgerald K. A., Latz E., Moore K. J., Golenbock D. T. (2008) The NALP3 inflammasome is involved in the innate immune response to amyloid-beta. Nat. Immunol. 9, 857–865 [DOI] [PMC free article] [PubMed] [Google Scholar]
- 32. Liu J., Hong Z., Ding J., Liu J., Zhang J., Chen S. (2008) Predominant release of lysosomal enzymes by newborn rat microglia after LPS treatment revealed by proteomic studies. J. Proteome Res. 7, 2033–2049 [DOI] [PubMed] [Google Scholar]
- 33. Kota B. P., Huang T. H., Roufogalis B. D. (2005) An overview on biological mechanisms of PPARs. Pharmacol. Res. 51, 85–94 [DOI] [PubMed] [Google Scholar]
- 34. Mulder M., Lombardi P., Jansen H., van Berkel T. J., Frants R. R., Havekes L. M. (1993) Low density lipoprotein receptor internalizes low density and very low density lipoproteins that are bound to heparan sulfate proteoglycans via lipoprotein lipase. J. Biol. Chem. 268, 9369–9375 [PubMed] [Google Scholar]
- 35. Williams K. J., Fless G. M., Petrie K. A., Snyder M. L., Brocia R. W., Swenson T. L. (1992) Mechanisms by which lipoprotein lipase alters cellular metabolism of lipoprotein(a), low density lipoprotein, and nascent lipoproteins. Roles for low density lipoprotein receptors and heparan sulfate proteoglycans. J. Biol. Chem. 267, 13284–13292 [PubMed] [Google Scholar]
- 36. Lee M. S., Kwon Y. T., Li M., Peng J., Friedlander R. M., Tsai L. H. (2000) Neurotoxicity induces cleavage of p35 to p25 by calpain. Nature 405, 360–364 [DOI] [PubMed] [Google Scholar]
- 37. Lim A. C., Qu D., Qi R. Z. (2003) Protein-protein interactions in Cdk5 regulation and function. Neurosignals 12, 230–238 [DOI] [PubMed] [Google Scholar]
- 38. Tsai L. H., Delalle I., Caviness V. S., Jr., Chae T., Harlow E. (1994) p35 is a neural-specific regulatory subunit of cyclin-dependent kinase 5. Nature 371, 419–423 [DOI] [PubMed] [Google Scholar]
- 39. Mandrekar-Colucci S., Landreth G. E. (2010) Microglia and inflammation in Alzheimer's disease. CNS Neurol. Disord. Drug Targets 9, 156–167 [DOI] [PMC free article] [PubMed] [Google Scholar]
- 40. Rivest S. (2009) Regulation of innate immune responses in the brain. Nat. Rev. Immunol. 9, 429–439 [DOI] [PubMed] [Google Scholar]
- 41. Streit W. J., Mrak R. E., Griffin W. S. (2004) Microglia and neuroinflammation: a pathological perspective. J. Neuroinflammation 1, 14. [DOI] [PMC free article] [PubMed] [Google Scholar]
- 42. Poole E., Groves I., MacDonald A., Pang Y., Alcami A., Sinclair J. (2009) Identification of TRIM23 as a cofactor involved in the regulation of NF-kappaB by human cytomegalovirus. J. Virol. 83, 3581–3590 [DOI] [PMC free article] [PubMed] [Google Scholar]
- 43. Boukerche H., Aissaoui H., Prévost C., Hirbec H., Das S. K., Su Z. Z., Sarkar D., Fisher P. B. (2010) Src kinase activation is mandatory for MDA-9/syntenin-mediated activation of nuclear factor-kappaB. Oncogene 29, 3054–3066 [DOI] [PMC free article] [PubMed] [Google Scholar]
- 44. Kim J., Basak J. M., Holtzman D. M. (2009) The role of apolipoprotein E in Alzheimer's disease. Neuron 63, 287–303 [DOI] [PMC free article] [PubMed] [Google Scholar]
- 45. Jiang Q., Lee C. Y., Mandrekar S., Wilkinson B., Cramer P., Zelcer N., Mann K., Lamb B., Willson T. M., Collins J. L., Richardson J. C., Smith J. D., Comery T. A., Riddell D., Holtzman D. M., Tontonoz P., Landreth G. E. (2008) ApoE promotes the proteolytic degradation of Abeta. Neuron 58, 681–693 [DOI] [PMC free article] [PubMed] [Google Scholar]
- 46. Koistinaho M., Lin S., Wu X., Esterman M., Koger D., Hanson J., Higgs R., Liu F., Malkani S., Bales K. R., Paul S. M. (2004) Apolipoprotein E promotes astrocyte colocalization and degradation of deposited amyloid-beta peptides. Nat. Med. 10, 719–726 [DOI] [PubMed] [Google Scholar]
- 47. Nishitsuji K., Hosono T., Uchimura K., Michikawa M. (2011) Lipoprotein lipase is a novel amyloid beta (Abeta)-binding protein that promotes glycosaminoglycan-dependent cellular uptake of Abeta in astrocytes. J. Biol. Chem. 286, 6393–6401 [DOI] [PMC free article] [PubMed] [Google Scholar]
- 48. Baum L., Chen L., Masliah E., Chan Y. S., Ng H. K., Pang C. P. (1999) Lipoprotein lipase mutations and Alzheimer's disease. Am. J. Med. Genet. 88, 136–139 [DOI] [PubMed] [Google Scholar]
- 49. Ben-Zeev O., Doolittle M. H., Singh N., Chang C. H., Schotz M. C. (1990) Synthesis and regulation of lipoprotein lipase in the hippocampus. J. Lipid Res. 31, 1307–1313 [PubMed] [Google Scholar]
- 50. Blain J. F., Aumont N., Théroux L., Dea D., Poirier J. (2006) A polymorphism in lipoprotein lipase affects the severity of Alzheimer's disease pathophysiology. Eur. J. Neurosci. 24, 1245–1251 [DOI] [PubMed] [Google Scholar]
- 51. Wolozin B. (2001) A fluid connection: cholesterol and Abeta. Proc. Natl. Acad. Sci. U.S.A. 98, 5371–5373 [DOI] [PMC free article] [PubMed] [Google Scholar]
- 52. Schoonjans K., Peinado-Onsurbe J., Fruchart J. C., Tailleux A., Fiévet C., Auwerx J. (1999) 3-Hydroxy-3-methylglutaryl CoA reductase inhibitors reduce serum triglyceride levels through modulation of apolipoprotein C-III and lipoprotein lipase. FEBS Lett. 452, 160–164 [DOI] [PubMed] [Google Scholar]
- 53. Gupta A., Tsai L. H., Wynshaw-Boris A. (2002) Life is a journey: a genetic look at neocortical development. Nat. Rev. Genet. 3, 342–355 [DOI] [PubMed] [Google Scholar]
- 54. Meuer K., Suppanz I. E., Lingor P., Planchamp V., Göricke B., Fichtner L., Braus G. H., Dietz G. P., Jakobs S., Bähr M., Weishaupt J. H. (2007) Cyclin-dependent kinase 5 is an upstream regulator of mitochondrial fission during neuronal apoptosis. Cell Death Differ. 14, 651–661 [DOI] [PubMed] [Google Scholar]
- 55. Patrick G. N., Zukerberg L., Nikolic M., de la Monte S., Dikkes P., Tsai L. H. (1999) Conversion of p35 to p25 deregulates Cdk5 activity and promotes neurodegeneration. Nature 402, 615–622 [DOI] [PubMed] [Google Scholar]
- 56. Muyllaert D., Terwel D., Kremer A., Sennvik K., Borghgraef P., Devijver H., Dewachter I., Van Leuven F. (2008) Neurodegeneration and Neuroinflammation in cdk5/p25-Inducible Mice: A Model for Hippocampal Sclerosis and Neocortical Degeneration. Am. J. Pathol. 172, 470–485 [DOI] [PMC free article] [PubMed] [Google Scholar]
- 57. Rodriguez J. J., Witton J., Olabarria M., Noristani H. N., Verkhratsky A. (2010) Increase in the density of resting microglia precedes neuritic plaque formation and microglial activation in a transgenic model of Alzheimer's disease. Cell Death Dis. 1, e1. [DOI] [PMC free article] [PubMed] [Google Scholar]
- 58. Frautschy S. A., Yang F., Irrizarry M., Hyman B., Saido T. C., Hsiao K., Cole G. M. (1998) Microglial response to amyloid plaques in APPsw transgenic mice. Am. J. Pathol. 152, 307–317 [PMC free article] [PubMed] [Google Scholar]
- 59. Qiu W. Q., Walsh D. M., Ye Z., Vekrellis K., Zhang J., Podlisny M. B., Rosner M. R., Safavi A., Hersh L. B., Selkoe D. J. (1998) Insulin-degrading enzyme regulates extracellular levels of amyloid beta-protein by degradation. J. Biol. Chem. 273, 32730–32738 [DOI] [PubMed] [Google Scholar]
Associated Data
This section collects any data citations, data availability statements, or supplementary materials included in this article.