Abstract
Domain 2 of the anthrax protective antigen (PA) prepore heptamer unfolds and refolds during endosome acidification to generate an extended 100 Å beta barrel pore that inserts into the endosomal membrane. The PA pore facilitates the pH dependent unfolding and translocation of bound toxin enzymic components, lethal factor (LF) and/or edema factor (EF), from the endosome into the cytoplasm. We constructed immobilized complexes of the prepore with the PA-binding domain of LF (LFN) to monitor the real-time prepore to pore kinetic transition using surface plasmon resonance (SPR) and bio-layer interferometry (BLI). The kinetics of this transition increased as the solution pH was decreased from pH 7.5 to pH 5.0, mirroring acidification of the endosome. Once transitioned, the LFN-PA pore complex was removed from the BLI biosensor tip and deposited onto EM grids, where the PA pore formation was confirmed by negative stain electron microscopy. When the soluble receptor domain (ANTRX2/CMG2) binds the immobilized PA prepore, the transition to the pore state was observed only after the pH was lowered to early or late endosomal pH conditions (5.5 to 5.0 respectively). Once the pore formed, the soluble receptor readily dissociated from the PA pore. Separate binding experiments with immobilized PA pores and soluble receptor indicate that the receptor has a weakened propensity to bind to the transitioned pore. This immobilized anthrax toxin platform can be used to identify or validate potential antimicrobial lead compounds capable of regulating and/or inhibiting anthrax toxin complex formation or pore transitions.
The Anthrax toxin (Atx) is comprised of three different protein components: the protective antigen (PA), lethal factor (LF) and edema factor (EF). During infection, PA binds cell surface receptors (ANTXR1/TEM8 or ANTXR2/CMG2) in the plasma membrane of a host cell. A furin family protease cleaves a 20 kDa N-terminal portion of PA, enabling the PA to oligomerize into a heptameric prepore structure. This heptameric prepore can bind up to three molecules of LF and/or EF. Alternatively, PA monomers can be cleaved in solution wherein LF or EF binding facilitates PA dimerization, leading to the formation of a PA octamer, which then binds to the cell surface receptors (1). The entire receptor bound PA prepore LF/EF complex is endocytosed and trafficked to an endosomal compartment. Acidification of the endosomal compartment (pH 5.5–5.0) leads to a dramatic pH-dependent conformational change of PA where the soluble ring like prepore (~85Å length, 144 Å wide) refolds to form a membrane-insertable PA pore with an extended beta barrel tubular stem (~100Å in length) and ring like cap. The toxic effector enzymes LF and/or EF are then directionally translocated from the endosome to the cytoplasm through the PA pore across the pH gradient (2).
To increase our understanding of the kinetic transitions that occur for the anthrax toxin complex during acidification, we surmised that it may be possible to monitor the protective antigen prepore to pore conformational transition using label free methods. Large-scale protein conformational changes can be observed using surface plasmon resonance (SPR). For example, SPR was previously utilized to observe the conformational changes/unfolding that results from urea induced unfolding of immobilized luciferase, lysozyme and RNAse proteins (3, 4). The SPR signal is dependent on the refractive index and changes in the dielectric medium in the immediate vicinity of the protein bound to the sensor surface. Significant protein unfolding exposes buried hydrophobic residues, leading to changes in the local water structure and hence the refractive index. The only caveat for monitoring conformational changes during unfolding occurs in instances where proteins interact with the negatively charged CMD matrix due to electrostatic interactions during pH induced unfolding (pH 4 to 10) (5). When matrix effects are specifically avoided, conformational changes due to unfolding are readily observable (3, 4). Naturally, protein denaturation changes often generate signals that are much lower than signals observed for protein-protein interactions. Based on structural properties of the PA pore barrel, it was surmised that the transitioned PA pore will not interact with the negatively charged CMD (carboxymethyldextran) SPR matrix due to intrinsic electrostatic repulsion. Specifically, the pore tip is negatively charged at the end of the barrel due to the concentration of negatively charged glutamic and aspartic residues (within the pore tip interior lumen).
We also examined the feasibility of using biolayer interferometry (BLI) as a detection platform to monitor the conformational change accompanying the prepore to pore unfolding/refolding transitions. Unlike SPR matrices, the BLI biolayer should allow us to position the PA prepore away from the biosensor surface, thus avoiding interfering matrix effects. BLI primarily detects changes in protein thickness because changes in the reflectance interference wave pattern between the sample and an internal reflectance reference layer results in a phase shift (Δ nm) and these real time changes can be followed in both kinetic and quantitative modes. In all instances tested to date, protein-protein or protein-ligand interactions that can be observed in SPR are also observed using BLI measurements. Moreover, since BLI is a rapid dip and read procedure, it is a particularly attractive technique for high throughput development.
As the PA prepore undergoes a major unfolding-refolding transition during acidification, it forms a long beta barrel pore structure that can insert into lipid membranes. This prepore to pore conformational transition results in change in length from ~85Å to ~between 170 to 180Å. If this PA prepore complex is positioned correctly above the biosensor surface, this large change should be observable by SPR and BLI methods. In both instances, any changes in the pore length should result in positive deflections in both label-free signals. Once the pore is formed, it no longer transitions back to the prepore state (6, 7) leading to the additional prediction that any observed upward deflection in signal should remain and not return to the original baseline position of the prepore state in neutral pH solutions.
The optimal orientation of the PA prepore on a biosensor surface should position the prepore so that the beta barrel formation will be roughly perpendicular to the biosensor surface. To accomplish this, the PA prepore was bound to an orientation specific thiol-attached truncated version of the lethal factor (LFN) (N-terminal prepore binding domain). For the SPR and BLI experiments, this particular orientation insures 1) that the large scale unfolding/refolding beta barrel formation would point away from the biosensor surface and 2) that the PA pore will be positioned ~ 20Å above the biosensor matrices, thereby diminishing any pH dependent matrix effects on the protein unfolding/refolding events. This particular platform construction was previously used for assembly and formation of LFN-PA pore-nanodisc complexes for EM analysis (8, 9). In that previous structural work, the orientation of the disulfide immobilized LFN construct (containing a cysteine replacing a glutamate at position 126 (E126C) within an exterior beta turn) on a bead surface provided optimal prepore binding for transitioning the prepore to PA pores. Once the PA pore has formed, a lipid nanodisc could be assembled around the newly exposed PA pore hydrophobic membrane insertion region. The PA pore nanodisc complexes eluted from this bead support results in a rapid purification procedure that enables one to easily visualize these complexes using electron microscopy (8). This orientation-specific binding of PA prepore onto the LFN positioned platform is based on the solved LFN-PA prepore crystal structures by Krantz and coworkers (10).
Using these label-free orientation-specific PA-LFN platforms, one can directly measure the kinetics of the prepore to pore transition conformational change as the pH was changed from 7.5 to a final pH value ranging from 6.75 to 5.0. In addition, one can determine if this pH dependent pore transition is slowed or inhibited when soluble receptor domains (ANTRX2) initially binds to the prepore state. The orientation of the hydrophobic PA pore tip away from the biosensor surface should also allow one to examine lipid micelle binding to this hydrophobic region. The micelles that will be used are somewhat uniform in size and are compromised of a matrix scaffold protein (MSP)-(cholate)-(POPC) mixture (11). Finally, if the LFN-bound PA prepore or pore complex is successfully attached to BLI biosensors through reversible sulfhydryl linkages, it should be possible to remove these complexes and deposit these complexes onto EM grids to validate the PA pore transition using electron microscopy (8).
EXPERIMENTAL PROCEDURES
Materials and instrumentation
The SPR measurements were carried out on a commercially available CM5 (carboxymethylated-dextran matrix) chip (GE healthcare) using a Biacore 3000 (GE healthcare). CM5 is a general-purpose chip that allows one to perform detailed quantitative interaction studies for analyzing interaction kinetics, affinity, concentration and binding between various biomolecules such as small organic molecules, proteins, lipids, carbohydrates, and nucleic acids. The BLI measurements were carried out on an Octet 96 Red at the forteBio facility in Menlo Park, CA and with the new single channel BLItz instrument (forteBio inc.) installed in this laboratory. PA, LFN (E126C Cys mutant of N-terminal truncated lethal factor) and CMG2 were purified as outlined previously (8, 12). PDEA was purchased from GE healthcare. Sulfo-NHS, EDC, L-Cysteine hydrochloride was purchased from Sigma. Sodium chloride, sodium acetate and sodium borate used in making the buffers were also purchased from Sigma.
Immobilization of PA
The immobilization of PA onto both the SPR and BLI biosensors was achieved via non-covalent affinity binding to an optimally orientated LFN E126C construct that can be covalently linked through a sulfhydryl linkage to the biosensors. Specifically for both SPR and BLI, a thiol surface utilizing EDC/NHS and 2-(2-pyridinyldithio) ethaneamine hydrochloride (PDEA) (Figure 1) was initially generated. EDC/NHS were mixed in a 1:1 molar ratio and allowed to incubate with the biosensor surface for 7 minutes to activate the surface. PDEA dissolved in 0.1 M borate buffer (pH 8.3) was then allowed to covalently couple onto the activated surface for 5 minutes to generate the activated thiol surface. The thiol surface was then incubated with 100 nM LFN in 10 mM acetate buffer (pH 5.0) to generate a disulfide linkage through the lone cysteine on LFN E126C. Excess reactive thiol groups remaining on the surface were then quenched using a solution of 50mM cysteine in a 1M sodium chloride, 10 mM sodium acetate buffer (pH 5.0). The resulting biosensor surfaces now contained immobilized LFN properly orientated to bind to the PA prepore. Various concentrations of PA were then incubated with the immobilized LFN for 10 minutes to bind and immobilize PA. The PA prepore binds to LFN with high affinity binding (Kd of 1 nM) (13) and the off rate is negligible within the time of the experiment, indicating that PA remains tightly bound to the sensor surface during the course of the pH jump experiments. Once transitioned, the PA pore attached biosensors were also used as reference surfaces to measure solvent bulk effects that were subsequently used for baseline correction purposes for both BLI and SPR.
Figure 1.
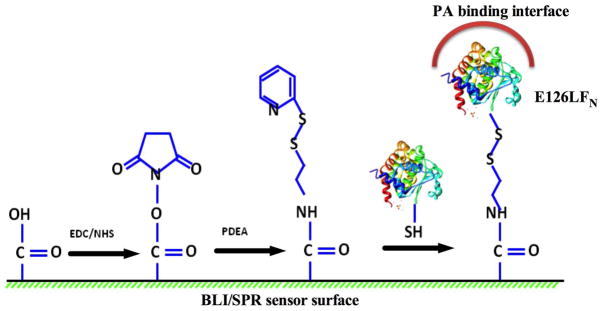
Chemical coupling to orient PA prepore on Biosensor surfaces. EDC/ NHS activated BLI or SPR biosensor surfaces were covalently modified with PDEA (methods) to produce a thiol-reactive coupling surface. E126C LFN (PDB 1J7N) (33) was covalently immobilized onto the sensor via a disulfide linkage in order to position the LFN–PA prepore binding interface to point away from the biosensor surface. This orientation insures that PA prepore will bind to the thiol linked immobilized LFN in a manner where the PA pore beta barrel will form in direction pointing away from the biosensor surface (see PDB 3KWV) (10).
Measuring the formation and the kinetics of the pore translocon using SPR/BLI
SPR
All label free experiments were carried out at 25°C. Once the PA is immobilized, an acidic buffer at a variety of pH conditions (6.75 – 5.0) was allowed to flow over the biosensor surface at a rate of 5 μl/min and the response recorded. The experimental kinetic time course was recorded at pH 6.75 or lower for 5 minutes followed by a chase with a neutral pH buffer (50 mM TRIS, 50 mM KCl, 10 mM MgCl2, 0.5 mM EDTA, pH 7.5). Any bulk effects (signal change due to change in buffer composition and pH) that are observed were subtracted from the initial sensorgram by repeating the experiment utilizing the same biosensor where PA had already undergone irreversible transitioning. In this way, the bulk effects of solvent (e.g. small changes in the refractive index) could be subtracted from the original uncorrected sensorgram signals. Each prepore-to-pore transition experiment was minimally repeated twice at each pH with for the SPR platform.
BLI
All kinetic experiments were carried out at 25°C. The formation of the pore translocon was initiated by acidification of the immobilized PA using most of the protocols noted above. The BLI pore transition measurements were carried out by dipping the PA immobilized biosensor in an acidic buffer (30mM MES, 30mM CHES, 30mM, Phosphate, pH varying from 5.0 – 7.0) where the platform holding the test solution was agitated rapidly (2000 rpm). The minimal number of experiments for each pH value using the BLI platforms was three. In comparing SPR and BLI experimental platforms used for this work, more individual runs per day could be simultaneously performed with the multiple channel BLI instrumentation (Octet Red 96). An entire set of pH series were also be run within a short time period using the single channel BLI unit (BLItz).
The BLI data was analyzed using the Graphpad Prism program to obtain data fits to the kinetics of PA transitioning. The kinetic traces were determined to have a minimum of three different phases (An initial burst fast phase (k1), an intermediate medium phase (k2)and the final slow phase (k3) before saturation). The data was analyzed by non-linear fitting using a three exponential function.
where y∞ is the maximum signal possible and a, b and c represent the fraction of signals for fast, medium and the slow phase of PA transitions respectively. Similarly, k1, k2 and k3 represent the rate constants for the three different phases. These have been compiled in Table 1 and the representative fits to the kinetic data are presented in Supplemental Figure 2. The goodness of fit was analyzed by examining the residual plots.
Table 1.
Kinetic data of PA pH induced transitions
| PA transitioning pH | SPR | BLI | ||
|---|---|---|---|---|
| (t1/2)* sec | k1 (s−1) | k2 (s−1) | k3 (s−1) | |
| 6.75 | 1.5 | 0.190 ± 0.005 | 0.029 ± 0.001 | 0.005 ± 0.0009 |
| 6.5 | 1.5 | 0.813 ± 0.016 | 0.09 ± 0.005 | 0.006 ± 0.0004 |
| 6.0 | <1 | 0.872 ± 0.021 | 0.082 ± 0.004 | 0.010 ± 0.0005 |
| 5.5 | <1 | 1.143 ± 0.024 | 0.076 ± 0.024 | 0.008 ± 0.0004 |
| 5.0 | <1 | 1.095 ± 0.018 | 0.025 ± 0.004 | 0.010 ± 0.0041 |
time to reach half of the complete reaction amplitude due to inadequate data collection at early time points with the SPR vs. BLI. (SPR data points collected every 0.5 sec whereas BLI data collected every 0.2 sec.)
Measuring the PA pore transition in presence of the soluble receptor CMG2
The PA was immobilized by the method described above. For SPR, the soluble receptor CMG2 (500 nM) was then injected at a flow rate of 5 μL/min and allowed to bind to the LFN immobilized PA prepore to obtain a saturated binding response. For BLI, the LFN immobilized PA prepore biosensor was dipped into an agitated solution containing the CMG2 receptor at the same concentration. With SPR, once the LFN-PA prepore-CMG2 complex was formed, the effects of the complex on the PA pore transition was recorded as the acidic buffer flowed over the chip immobilized LFN-PA prepore-CMG2 complex for 8 minutes. In BLI, the initiation of the pore transition was carried out by dipping the immobilized LFN-PA prepore-CMG2 complex biosensor into a vigorously stirred acidic buffer (platform set at 2000 rpm). After the acidic pulse, both SPR and BLI biosensor surfaces were restored to neutral pH conditions with either a TRIS based buffer (50 mM TRIS, 50 mM KCl, 10 mM MgCl2, 0.5mM EDTA pH 7.5) or a MES/CHES/Phosphate based buffer (30 mM MES, 30 mM CHES, 30 mM phosphate buffer, pH 7.5). Buffer flow rates of 5 μl/min for either the acidic or the refolding buffers were employed for the SPR studies. Any observed bulk effects (signal change due to change in buffer composition and pH) were subtracted using reference sensorgrams. These reference sensorgrams were generated by repeating the experiment utilizing the same biosensors that contained completely pH induced transitioned PA pores.
Electron microscopy
BLI tips containing PDEA-immobilized LFN-PA prepore (incubated at pH 8.0 in 30 mM MES, 30 mM CHES, 30 mM phosphate buffer) and LFN-PA pore complexes (incubated at pH 5.0) were used as samples for electron microscopy. The immobilized complexes (prepore or transitioned pore) were removed from the BLI biosensor tips by immersing the tip directly into a 2 μL microvolume of TrisHCl buffer containing 50 mM DTT (pH 8.0) deposited on a clean parafilm surface. After release from the tip, the pore or prepore oligomers within the 2 μL solution were wicked onto carbon coated Cu 300 mesh EM grids (Electron Microscopy Science) that were glow discharged just before use.
The untransitioned PA prepore or pH transitioned pore complexes eluted from the BLI tip into the 2 μL solution were allowed to incubate for 1 minute on the grids followed by briefly dipping the grids in three water droplets. The grids were subsequently negatively stained using 1% methylamine tungstate (pH 7). Samples were imaged with a JEOL -1200 EXII Transmission Electron Microscope at 100 kV and the images recorded on film (Kodak SO163) by using a minimal-dose procedure at a defocus values between 0.6–0.7 μm. The micrographs were digitized using a Microtek ScanMaker i900 scanner at a pixel size of 5.0 Å on the specimen. To record micelle interactions with the transitioned pore, the tip was dipped into a solution containing the prenanodisc micelle mixture (20 μM membrane scaffold protein, MSP1D1, 1.3 mM POPC, 25 mM Sodium cholate). The newly formed LFN-PA pore-micelle complexes were then eluted from the BLI tip as described above and the eluted sample was deposited on glow discharged EM grids and resultant sample was examined directly using negative stain electron microscopy. Control experiments were performed by dipping the BLI tip containing untransitioned prepore into an equivalent micelle mixture at near alkaline pH conditions (pH 8.0).
Three-Dimensional reconstruction of Micelle bound PA pores
Following the successful demonstration that PA pore-micelle complex formation could be accomplished using the small scale BLI release method, a larger scale preparation was initiated to obtain a three dimensional structure of a micelle solubilized pore. The larger scale bead-released complexes were used to generate sufficient amounts of individual pore particles to obtain a low-resolution structure of the PA pore-micelle complex using negative stain single particle analysis. LFN E126C-thiol sepharose beads were prepared as described previously (8). 50 μL of LFN affinity beads were transferred to a mini-spin column (Pierce Centrifuge Columns 0.8 ml, Thermo scientific, USA) and washed with pH 8.0 buffer (50 mM NaCl, 50 mM Tris-HCl, pH 8.0) and then bound to 100 μL of 0.2 μM PA prepore. Prepore to pore conversion was induced by incubating either at pH 5.5 buffer (50 mM Sodium acetate, 50 mM NaCl, pH 5.5) or at 37 °C in the presence of 1M urea. Both methods generated a substantial number of transitioned PA pores. After the pore transition occurs, beads were washed in a pH 8.0 Tris-HCl buffer and transferred into small microcentrifuge tubes containing 1mL of the micelle mixture. Bead suspensions containing the micelle mixture were incubated for 30 min at 4°C with gentle rocking agitation. Then beads were transferred to mini spin columns and washed with pH 8.0 buffer for a minimum of 20 column volumes to remove unbound micelles. E126C disulfide attached LFN-PA pore-micelle complexes were released from the immobilizing bead support with 50 mM DTT, and this treated and released LFN-PA pore-micelle sample was used for EM grid preparation (8). Samples were examined as described above. 40 micrographs were used to select particles and perform reference-free 2D alignment using EMAN1 (14). Two prominent populations were observed and 3D reconstruction was performed on each of these populations using projection matching implemented in the Spider software suite (15). To construct the initial model, the previously calculated 3D structure of PA was filtered to 100 Å resolution (9, 16). The resolution was estimated from the Fourier shell correlation curve using the FSC-0.5 cutoff criterion. Three-dimensional structures were displayed at 100% threshold volume of the protein complex using Chimera (17).
RESULTS
Constructing immobilized PA prepore complexes and detection of pH induced transitions
To develop a system to detect the protective antigen pore transition with label free kinetic methods, it is crucial to bind and position the protective antigen prepore in an orientation that allows the pore transition to occur away from the biosensor surface. This specific orientation was accomplished by using the methods outlined in Akkaladevi et al. (8) that were shown to reliably generate purified PA- pore-nanodisc complexes for single particle reconstruction and avoids aggregation. Briefly, E126C LFN was covalently attached on both SPR and BLI biosensor surfaces via a disulfide linkage to position the lethal factor so it can easily bind to the prepore cap region, orientating the bound prepore above the biosensor surfaces. This affinity specific positioning enables the 100 Å PA pore beta barrel formation to extend above the biosensor surface (Figure 1), generating an observable signal.
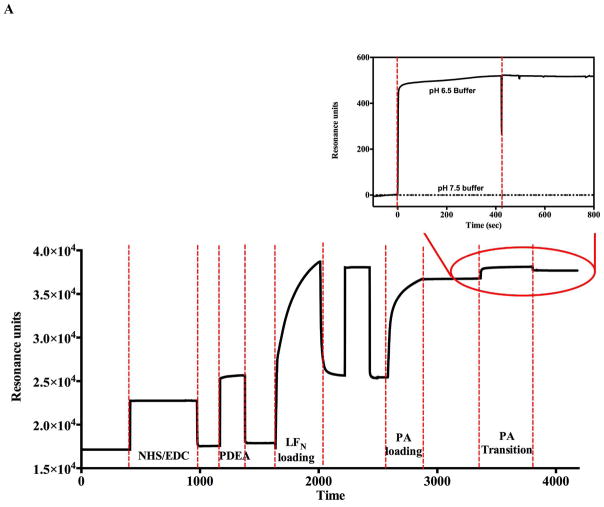
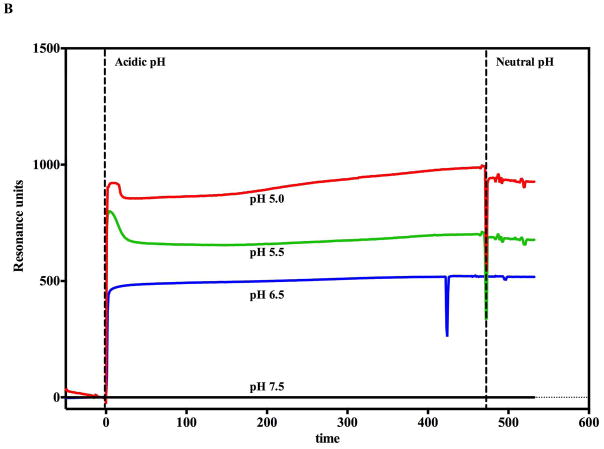
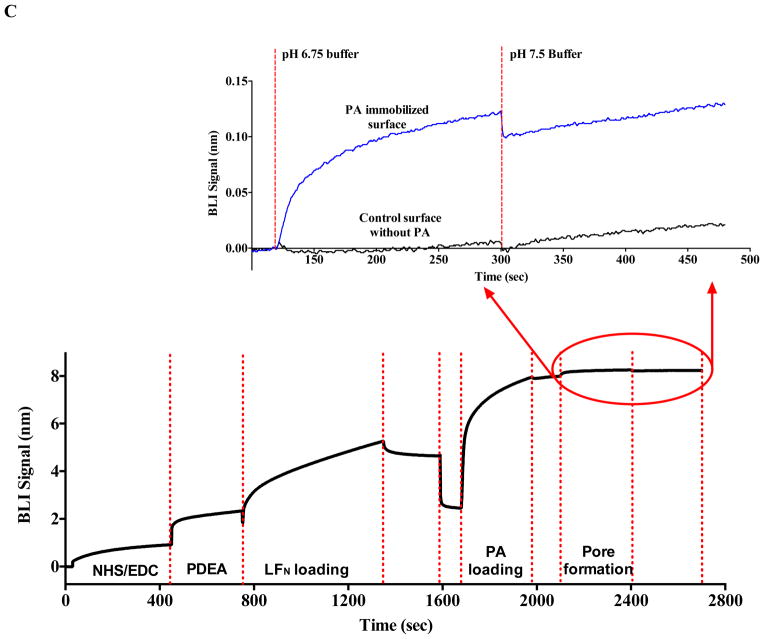
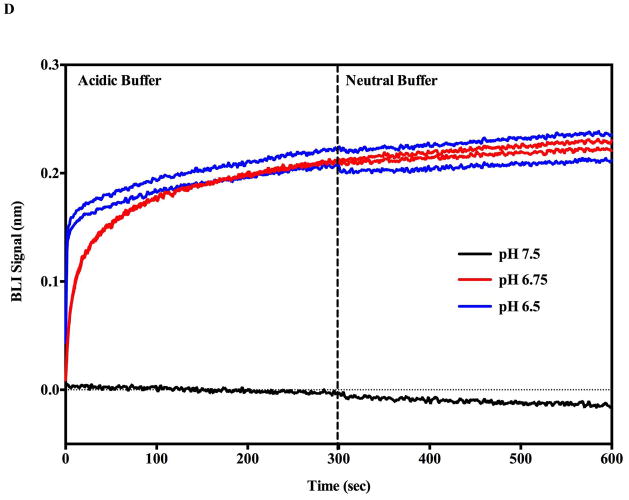
As predicted, the introduction of buffers mimicking gradual decreases in pH (that occur during endosomal acidification) onto the SPR or BLI biosensor surfaces containing orientated prepore arrays results in an observable increase in signal in resonance units (SPR) and phase shifts (BLI) (Figure 2). For both label-free instrument platforms, this elevated and stable signal does not return to the original pre-acidification baseline when a buffer of pH 7.5 was reintroduced to the immobilized and transitioned PA pore arrays. Control experiments using the same buffers with lethal factor alone showed virtually no changes in signal compared to the effects observed with the PA prepore attached.
Figure 2.
Monitoring the PA prepore acid induced transition in realtime by SPR Biacore 3000 (A and B) and BLI Octet system (C and D). Complete sensorgrams for SPR (A) and BLI (C) as observed for pH jumps. Highlighted regions in A and C show the comparative amplitudes of the pH induced changes for each label free platform. The PA was immobilized on the biosensors and initially treated with buffers of varying acidic pH followed by increasing the pH back to neutral. The pH induced signal changes remain once the buffer is returned to neutral pH, indicating that the origin of the signal change was irreversible. As the pH jumps approach late endosomal pH conditions (pH 5.5 to 5.0), the kinetic transitions become more rapid for both SPR (B) and BLI (D) (rates listed in Table 1, kinetic fits to both Octet BLI and single channel BLI (BLItz) data in Supplemental Figure 2). Uncorrected single channel BLI data shown in supplemental Figure 1.
In vivo, the prepore to pore transitions occur while the PA prepore heptamer (or octamer) is bound to cell surface receptors. Furthermore, it appears that these transitions occur when the endosome is acidified to pH values between 5.5 and pH 5.0 (2, 18, 19). In the absence of receptors, previous work indicated that the pore transition also occurs at mildly acidic pH conditions (7, 20). Both label-free systems show kinetic traces that increase in rate (and amplitude up until PA prepore binding saturates) as the final pH buffer is incrementally decreased from pH 7.5 to pH 5.0 (Figure 2 SPR panel B, BLI panel D, Supplemental figure 1 (BLI)). The rate of the observed pH induced transitions for both label free systems are listed in Table 1. Representative kinetic fits to the BLI raw data are presented in supplemental figure 2A and B. The prepore to pore transition kinetic traces for the BLI (Figure 2D) indicate that the pH transition kinetic profiles at 6.75 and 6.5 are easily resolved. At more acidic pH values of pH 5.5 or pH 5.0 (SPR Figure 2B, BLI Supplemental Figure 1), the kinetic transitions are more rapid and the initial kinetic profiles exhibit a rapid burst phase (k1 in Table 1 from BLI, inset supplemental figure 2B) that is too fast for the Biacore 3000 SPR instrumentation to resolve. The SPR sensograms showed a small distinct and reproducible initial overshoot of the transition signal as the pH of the flow buffer was decreased to 5.5 or 5.0 (Figure 2B). Since the PA prepore undergoes partial unfolding of the domain 2 anti-parallel beta loop followed by folding into the beta barrel, it may be possible that these initial unfolding and refolding events are responsible for the overshoot. We chose not to pursue the origin of this overshoot in detail. The BLI signals do not show this overshoot signal as the transition pH approaches “late endosomal” pH conditions of pH 5.5 and pH 5.0 (Supplemental Figure 1, Figure 6B).
Figure 6.
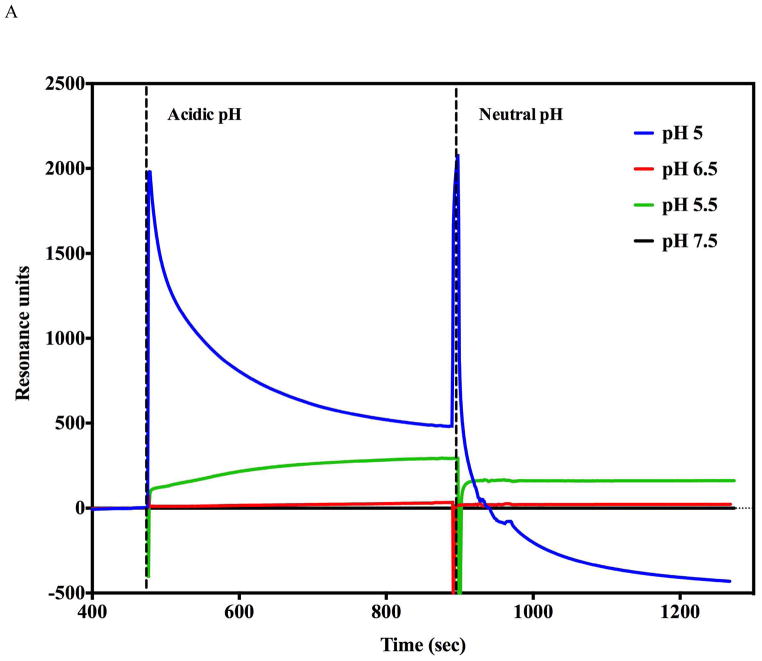
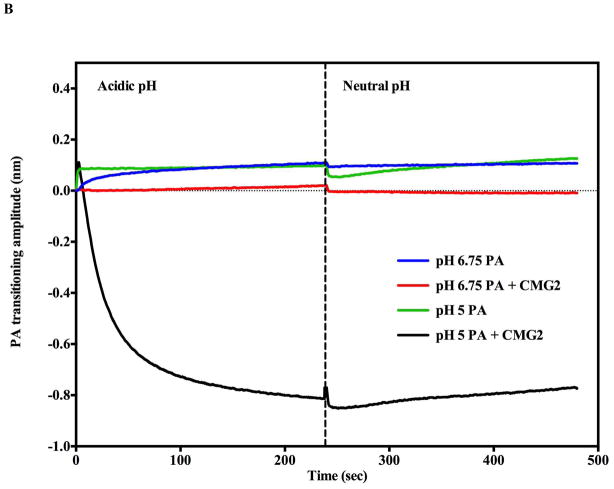
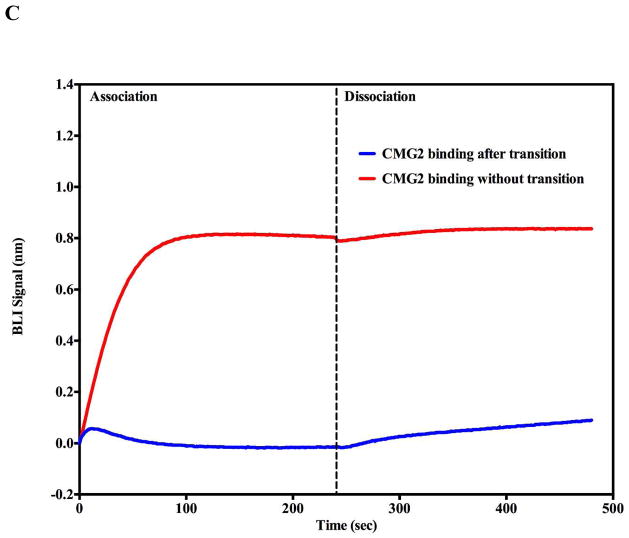
pH induced transition in the presence of soluble CMG2 receptor (0.5 μM). A) Receptor binding inhibits acid induced transitions above pH 5.5 as assessed by SPR. No significant pH induced transitions were observed (Green and black traces) until the flow buffer pH was lowered to pH 5.5 (Green trace). At pH 5.0 (Blue trace), there was an initial rapid rise followed by a decline in amplitude consistent with PA prepore transition to pore followed by receptor dissociation. The spike observed at ~ 900s is due to pH shift from acidic to neutral pH. B) BLI biosensor traces indicate that acid induced transitions at pH 6.75 (Blue trace) are inhibited (Red trace) when the CMG2 receptor is initially bound to the prepore. At pH 5.0 the prepore rapidly shows a rapid acid induced transition (Green trace). In the presence of the CMG2 receptor (0.5 μM) the BLI signal initially rises to the pH 5.0 transition amplitude (without CMG2 present – green trace) and sharply declines to a level that nearly matchs the initial baseline of the prepore prior to receptor loading (just above −0.8 nm value) (Black trace). C). BLI sensorgram shows that the soluble CMG2 (0.5 μM) binding to the immobilized prepore (pH 7.5) results in a large upward deflection in signal (red trace) (+0.8 nm). Very little CMG2 dissociates from the complex when the tip is dipped into a solution without CMG2 (dissociation phase). In contrast, if the prepore is pH transitioned to the pore on the BLI biosensor (pH 5.0) prior to returning (dipping) the tip back into the 0.5 μM CMG2 solution at pH 7.5, very little PA pore-CMG2 receptor binding signal is observed during the association phase (Blue trace).
Real time monitoring of PA-pore-micelle/nanodisc complex and visualization by electron microscopy
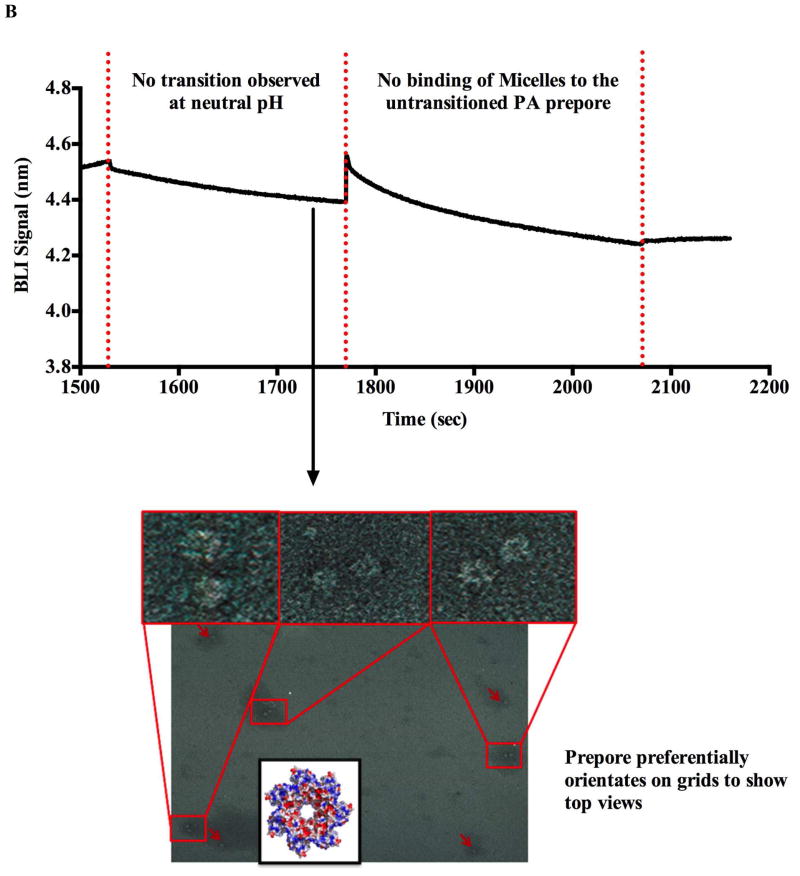
To conclusively demonstrate that these signals correspond to PA conformational changes, one can specifically use the BLI biosensor system in conjuction with electron microscopy to verify that the PA prepore has transitioned to the PA pore. The immobilized transitioned pore complex can be easily removed from the BLI biosensor by reducing sulphdryl linked LFN-PA pore complexes from the BLI fiber optic tip with 1 M DTT at pH 8.0 and examining the released complexes on EM micrographs (8, 9). A mildly alkaline pH of the DTT elution buffer was used to insure that no additional PA prepore could transition to the pore form prior to EM preparation (See Figure 3B). The amount of complex that can be released into solution from a single 600 μm diameter BLI tip can be quite substantial if the release solution volume is small. It is estimated that in a final volume of 2 μl the approximate final concentration of PA pore complexes (oligomers) can be between 1–3 pM). The resulting electron micrograph fields verified that adequate quantities of the free LFN-PA pore complex (144 Å × 210 Å) can be released from the tips to assess the pore transition efficiency using electron microscopy. Previous experiments by Katayama et al. (16) and Akkaladevi (8), demonstrated that released PA pores or PA-nanodisc pores (nearly the same dimensions) can be routinely and easily observed using standard negative stained electron microscopy. In control experiments, the LFN-PA prepore complex was maintained at near neutral solution conditions (pH > 7.5) and this untransitioned prepore complex was also released onto an EM microscopy grid using the same DTT elution buffer (pH 8.0) (Figure 3B).
Figure 3.
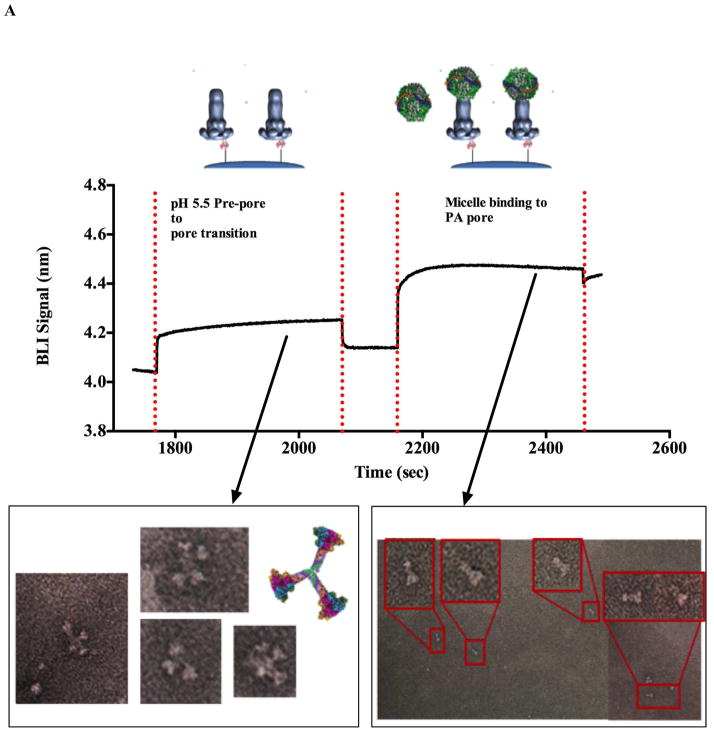
Electron microscopy of complexes released from BLI biosensors tips. Panel A shows that the transition occurs when the BLI tip containing LFN-PA prepore complex is dipped into a pH 5.0 solution. The LFN-PA complex was removed from the the biosensor tip with DTT and the complex was deposited onto a glow-discharged copper grid. Two sets of transitioned pores released from the BLI tips were observed in the absence and presence of (POPC)/MSP/cholate micelles on negatively stained EM micrographs (below BLI kinetic traces Panel A). In the absence of the micelles, the pH 5.0 transitioned pores eluted off of the BLI tips show distinct PA pore aggregates that interact through the exposed hydrophobic tips (left EM micrograph and cartoon). Prenanodisc micelle addition to the immobilized transitioned PA pores (far right kinetic trace) shows a distinct increase in BLI signal suggesting that the micelle can interact with the PA pore. Elution and visualization of this LFN-PA-micelle complex by EM shows a transitioned PA pore inserted into micelles as individual PA pore structures (right EM micrographs Panel A). In the control experiments, (Panel B) the prepore was attached to the BLI biosensor chip via the LFN interaction but the pH conditions were maintained at near alkaline conditions (pH 8.0). Under these conditions, no upward deflections of the BLI signal are observed in the absense or presence of the POPC/MSP/cholate micelles. In this panel, the EM micrographs the DTT eluted LFN–PA complex incubated at constant pH 8.0 shows individual particles that resemble typical face-up prepore heptamer complexes. No PA pore side views (aggregated or micelle inserted) were observed in this EM micrograph (lower EM image Panel B).
As shown in Figures 3A and B, a large number of tip released pure individual PA molecules could be observed on the EM grids. The electron micrograph images of the released LFN-PA pore (generated with pH 5.5 buffer for these experiments) shows the distinct side view orientation of the cap region (Figure 3A) that are only observed when the anthrax toxin pore is present in its transitioned form on the glow discharged EM grids (8, 16, 20). Furthermore, in the absence of detergents or other solubilizing agents (i.e. micelles), the transitioned pores naturally interact through their exposed hydrophobic tip regions (20) to form small rosette aggregates composed of complexes anywhere from two to four separate pores. The preferential side view orientation shows the characteristic Y shape making up the cap region connected to the extended beta barrel of the transitioned pore. In contrast, at pH 7.5 to pH 8.0 (near alkaline conditions), the LFN-PA prepore remains in its prepore form (see EM micrographs Figure 3B). The prepore form of PA preferentially lies face up on the EM grid showing a distinct central cavity and does not form large aggregates within the EM fields. These EM images verified that the transitions observed on the BLI biosensor tips were prepore to pore transitions and provides strong evidence that the kinetic signals generated by SPR or BLI corresponds to the transitioning of PA prepore to pore.
In a separate experiment, the complete kinetic traces of both the PA pore transition and the PA pore tip insertion into (POPC)/MSP/cholate micelles on the BLI biosensor could be easily observed in sequence (Figure 3A). An upward BLI signal deflection suggesting micelle binding was only observed when PA is transitioned to its membrane insertable pore form (Figure 3A). In contrast, similar experiments with the PA prepore showed no such upward deflection (Figure 3B). The micelle-solubilized PA pore complexes released from the BLI tip do not show any pore-pore tip aggregation and the distinct LFN-PA pore micelle complexes were easily resolved on the EM micrographs as individual particles (right hand side, Fig. 3A). These results indicate that one can solubilize the PA pores by adding micelles, which in turn can define solution conditions that can generate enough PA-pore-micelle complexes for single particle analysis.
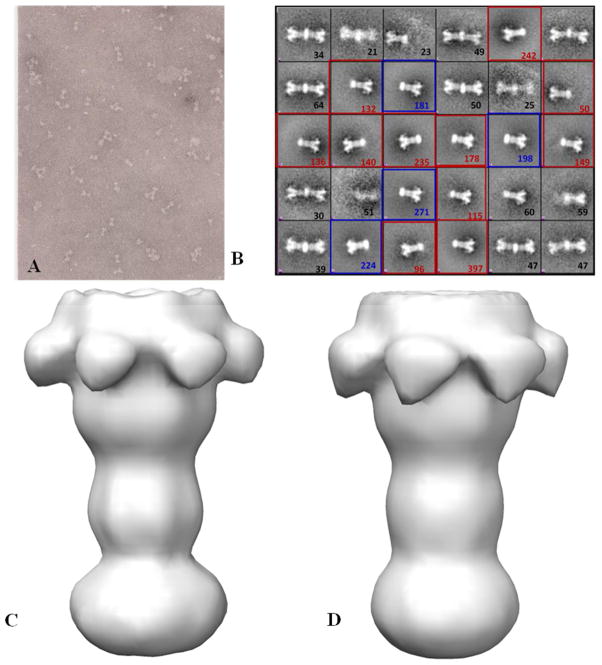
EM Reconstruction of PA pore micelle complexes
The BLI results coupled with EM analysis indicates that the LFN-PA pore-micelle complex can be assembled on and be released from a solid support surface. This should allow one to generate significant quantities of soluble LFN-PA pore-micelle complexes for single particle analysis. To verify that PA pore-micelle complexes can be produced in larger quantities, a scaled-up purification of the LFN-PA-micelle complex based on the BLI release method was implemented by using LFN-thiol sepharose beads as the reversible covalent attachment platform (8). The PA prepore bound non-covalently to the orientated LFN and the transition was induced by acidification or incubation with 1M urea at 37°C in the presence MSP-POPC-cholate micelle mixtures. The disulfide linked complexes were released from the bead surface using DTT and integrity of these soluble complexes assessed using negative stain electron microscopy. A representative EM field is shown in Fig 4A. The imaged fields were digitized (total 40 EM fields) and 3369 particles were manually selected by using EMAN1 (14). Reference-free 2D alignment was applied to the selected image particles and k-means classification was performed using EMAN1, enabling separation of the image populations into roughly 30 classes (Fig 4B). Three prominent populations were observed from 30 classes: one class of PA pore is inserted into ellipsoid prenanodisc micelles, another class of PA pores inserted into circular prenanodisc micelles and a third prominent class of particles contained two PA molecules inserted into what appears to be more of a nanodisc shaped disc. These prominent particle populations were separated into three groups, 874 LFN-PA- ellipsoid prenanodisc micelles, 1870 LFN-PA-circular prenanodisc micelles and 432 particles with two PA molecules inserted in a single nanodisc. First two image data sets were used for a preliminary 3D analysis, yielding structures with a nominal resolution of 26 Å, Fig. 4C and D respectively. 3D structures are similar to previously determined PA pore complexes inserted into lipid nanodiscs (8, 16) and PA pores bound to the chaperonin GroEL (20).
Figure 4.
Scale up of BLI microvolume EM method to generate three dimensional reconstructions of PA pore micelles. Panel A shows a representative negatively stained EM field of the large scale procedure to generate MSP/cholate/POPC micelle (prenanodisc micelle) solublized pore transitioned from thiol bead surfaces. B) 3369 LFN-PA micelle particles were picked to perform reference free 2D class averages and generate 30 separate classes. These classes contain larger ellipsoid prenanodisc micelle solublized pores, highlighted with red square boxes (reconstruction C); single pore inserted smaller rounded prenanodiscs (reconstruction D) highlighted with blue square boxes and a fair number of doubly inserted pore into nanodiscs. C&D) Negative stain 3D structures of first two prominent LFN-PA pore classes at 26 Å. The two prominent classes of prenanodisc micelles that coalse around the PA pore tip appear as expanded ellipsoid (C) or smaller round (D) shaped densities.
PA/LFN Concentration Correlation with transition signals
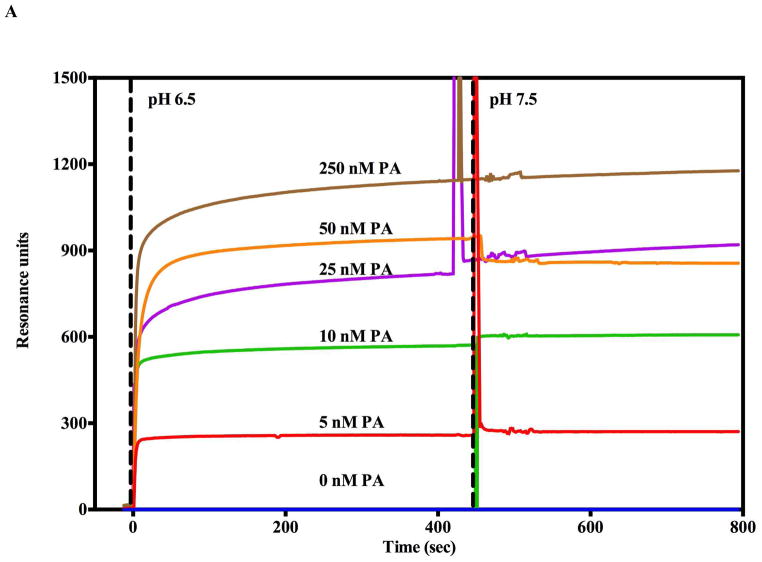
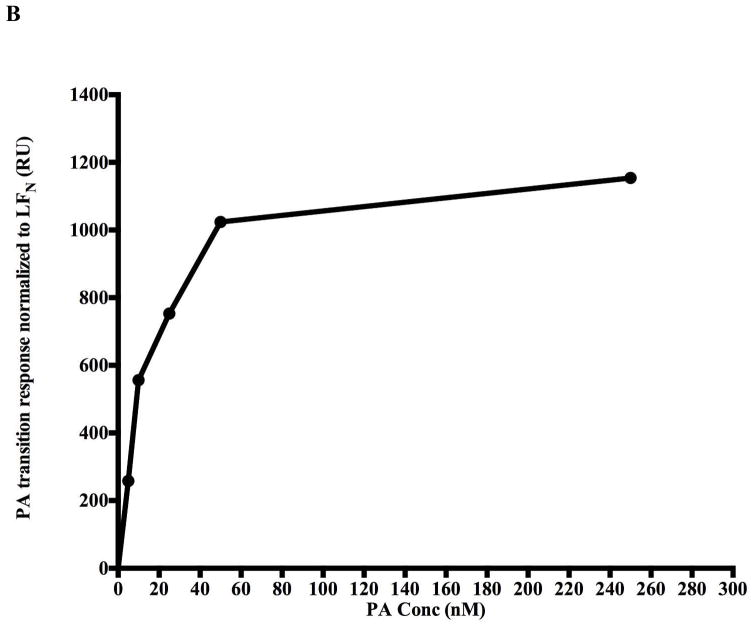
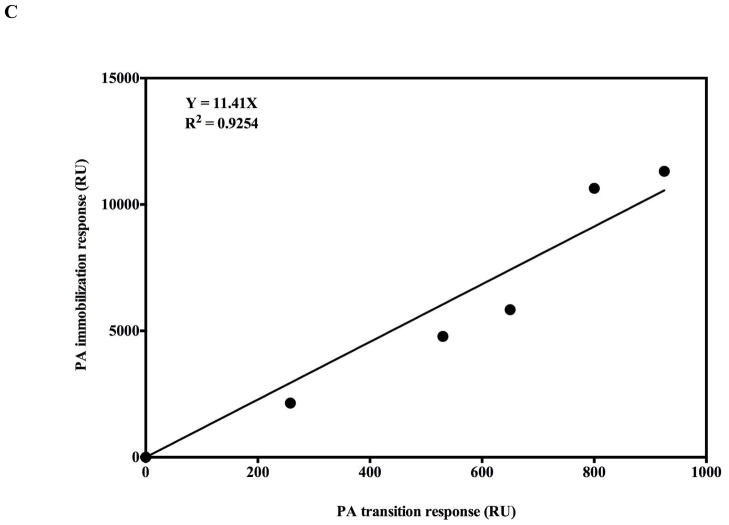
If an authentic prepore to pore transition occurs on the biosensor surfaces, then one would also predict that the starting PA concentration SPR signal amplitude should correlate in a linear fashion with the signal of the corresponding PA transition. To test for the predicted quantitative relationship, increasing concentrations of PA (0–250nM) were allowed to interact with a fixed amount of covalently immobilized LFN (100nM starting concentration). These were then acidified using pH 6.5 buffer and the increase in signal due to PA transition recorded (Figure 5A). The PA binding signal on the SPR sensorgram was then compared with the PA transition signal after acidification at pH 6.5. The PA binding amplitudes were normalized to the LFN binding signal to account for slight differences in PA immobilization. As the PA prepore concentration that flows over the immobilized LFN increases, the amount of PA prepore that can bind to the chip approaches a saturable limit and the PA pore transition signal levels off (Figure 5B). The PA binding amplitude signals to PA transition amplitude signals are linearly correlated (Figure 5C). Raw (Not normalized to initial LFN binding) PA binding amplitudes were also linearly correlated with the PA pH induced transition signals (data not shown).
Figure 5.
The pH jump (pH 7.5 to 6.5) SPR signal correlates with the amount of prepore that is initially bound to the chip surface. The transition amplitudes were normalized with respect to the amount of LFN being immobilized on the surface. A) The kinetics of the transition are approximately equivalent and independent of the amount of prepore loaded onto the SPR chip. B) The transition amplitude levels off at high prepore loading concentrations, presumably due to saturation of PA prepore binding. C) The prepore loading amplitudes are linearly correlated with the pore transition amplitude. The correlation coefficient is 0.92 for the zero forced fit.
The effects of soluble ANTXR2/CMG2 receptor binding on PA prepore to pore transition kinetics
The data presented thus far indicate that PA prepore to pore transitions can even be observed at near neutral pH values 6.5–6.8, albeit with slower transition kinetics (Figure 2, Supplemental Figure 1, Table 1). The data also agree with previous instances where transitions were readily observed under similar conditions within lipid bilayers and in solution (6, 7). The lower amplitudes and slower transitions under less acidic conditions (pH 6.0 and above) may indicate that not all of the bound PA prepore transitions to the pore within the experimental time frame. In vivo, PA pore transitioning and accompanying LF or EF translocation occurs within the endosome once the pH values drop between 5.5 to 5.0 (19) during late stage endosome maturation. The in vivo pH threshold of the PA prepore to pore transition depends on the type of receptor that binds the PA prepore (21, 22). Tighter binding receptors such as ANTRX2 (CMG2) decrease the pH threshold of PA pore transition to ~ pH 5.2 while the PA pore transition with the weaker binding receptor ANTXR1(TEM8) occurs at a higher pH 6.2. This differential pH dependency for the receptor-bound PA pore transitions correlates with the strength of the receptor interaction with PA prepore. Stronger receptor-PA prepore interactions constrain the unfolding/refolding movements of the D2L2 loop at the domain 4:domain 2 interface (23–25). This loop is the structure that undergoes the largest unfolding and refolding as the prepore transitions to the beta barrel stem (7). Therefore, it was predicted that receptor binding should stabilize domain 2 against pH dependent unfolding, leading to an inhibition of the SPR and BLI dependent prepore to pore transition signals near neutral pH values above pH 6.5.
The positioning on the immobilized prepore on the biosensor surface should enable one to effectively observe the soluble CMG2 domains binding to the PA prepore. For both the SPR and BLI experiments, a saturating amount of PA prepore (250 nM) was preloaded onto the orientated LFN on the biosensor surface which in turn orientates the receptor binding interface (encompassing PA external surfaces comprised of domains 4 and 2) for optimal receptor binding. In these experiments, ~ 500 nM of the soluble CMG2 was flowed over the SPR sensor surface(A) or dipped onto the immobilized LFN-PA complex BLI surface to eventually form the LFN-PA-CMG2 complex (complete SPR sensorgram shown in Supplemental Figure 3). With both label-free systems, the receptor-prepore complex forms readily and does not show any substantial dissociation following a buffer chase (SPR - Supplemental Figure 3, BLI - Figure 6C). The lack of any appreciable dissociation kinetic declines in signal agrees with the observation that the binding affinity of the CMG2/ANTXR2 for the PA prepore is tight (Kd ≃ 170 pM) (26).
The LFN-PA-CMG2 complexes that are exposed to pH solutions above 6.5 show no apparent kinetic transitions as assessed by either SPR or BLI label free systems (Figure 6A, B). In the SPR sensorgram, a slight upward signal (green trace) was only observed when the pH was lowered to 5.5 (Figure 6A). When the flow or dip buffers were lowered to pH 5.0, both the sensograms of the SPR and BLI show a sharp rise in signal followed by a large gradual decline in signal. This initial sharp upward signal deflection most likely corresponds to the pore transition and the subsequent signal decline appears to correlate with CMG2 receptor dissociation (22). Consistent with the notion that the initial signal corresponds to a pore transition, the amplitude of this initial rise in both SPR and BLI signals corresponds to the expected increase observed for pore formation in the absence of receptor (Figure 2A, Figure 6A,B). The SPR rise is a little higher than expected and this may be due to the contribution of a degree of CMG2 unfolding during the pH jump. The complete sensorgrams show that following the rapid initial rise in signal (transition), the experimental trace returns to the original baseline signal level recorded prior to the receptor binding. In the absence of bound CMG2 receptor, PA prepore- or pore-LFN complexes alone do not show any substantial decline in signals following acidification and return to pH 7.5 (Figure 2). This data suggests that the declines in signal following acidification of the complete complex (LFN-PA-CMG2) are most likely due to soluble CMG2 receptor dissociation. This suggestion also supported by the observation that the CMG2 binding interaction with the pH transitioned PA pore is significantly weakened (Figure 6C, blue trace).
DISCUSSION
The transitions observed with these immobilized anthrax toxin complexes recapitulates, in part, the pH induced changes that occur in the endosome as the PA prepore unfolds and refolds into its pore conformation. At pH 5.0, the transition shows a substantial rapid burst phase and the magnitude of this kinetic change is essentially 80% complete within the first initial 5 seconds using both the SPR and BLI biosensor platforms. A similar kinetic transition, including a distinct rapid burst phase (k1 in Table 1 and shown in Supplemental Figure 2), was previously observed by Vernier et al., where they measured the kinetic changes in circular dichorism ellipticity at 218 nm as the PA prepore transitions to its pore form in the presence of the detergent N-tetradecylphosphocholine (FOS14) at pH 5.5 (27). The k2 and k3 kinetic constants obtained from the kinetic fits to the BLI data (Table 1) agree quite well with the k1 and k2 constants measured by CD (27). In the latter kinetic analysis (27), the initial kinetic rate constant of the burst phase (k1 in Table 1 and illustrated in supplemental figure 2) was not measured because the initial kinetic data points were not resolved. Indirect kinetic measurements of the PA pore transition into K+ loaded Ni2+ doped liposomes starting from preloaded PA prepore-His tagged CMG2 receptors show implied transition rates that are also consistent with our label-free kinetic measurements (29). The rapid release of K+ due to a combination of PA pore formation/and Pore insertion at pH 5.0 has a half live of several seconds, the kinetic traces appear multiphasic with an initial burst phase, and the kinetics of K+ release are essentially complete within ~ 60 sec in near agreement with the BLI and SPR kinetic measurements. The kinetic measurements from the BLI measured transition at pH values of 6.75 to pH 5.0 all show a minimum of three phases (Supplemental figure 2, listed in Table 1). The fits to the kinetic data show a slight overshoot in the residuals particularly at the lower endosomal like pH values within the first kinetic phase indicating that the transition is probably more complex as the pH approaches endosomal solution conditions (insets Supplemental Figure 2A, B). This is a reasonable assumption considering the large scale unfolding, refolding and reassembly processes that have to occur during the prepore to pore transition.
The presence of bound soluble CMG2 receptor to the PA prepore slows pore transitions at pH 5.5 (Figure 6A, supplemental figure 3) and completely inhibits these transitions at pH values of 6.0 and above. When PA prepore to pore transition is induced at pH 5.0 in a more complete endosomal complex including the soluble receptor (LFN-prepore-CMG2), the prepore transition to the pore shows a rapid rise followed by a large decline that is attributed to the pore transition followed by receptor dissociation (Figure 6A, B). The observation that dissociation of the receptor elicits a large diminishing signal that inversely agrees with the correlative increase in the association signal of receptor binding to the prepore complex. The positive receptor binding deflection signal is always much larger than the positive signal generated by pore transition. Furthermore, the rapid receptor dissociation from the transitioned pore leads one to predict that the binding between the receptor and the pore should be weakened as the pH approaches 5.0. In fact, when one attempts to measure the binding of the soluble CMG2 receptor to a transitioned PA pore attached to the BLI tip using the same CMG2 concentrations used to construct the LFN-PA prepore–CMG2 complex, virtually no binding signal is observed at neutral extracellular pH conditions (pH 7.0–7.5; Figure 6C). This direct observation agrees with NMR-based observations that the PA–receptor interactions weaken as the prepore transitions to the pore (28). Since our complex is anchored to an immobilized surface in the opposite orientation that occurs in vivo (i.e. prepore bound to membrane anchored CMG2), it is premature to firmly conclude that the receptor dissociates completely after pore formation in vivo. Certainly, a weakened receptor interaction (loss of domain 2 interaction and decrease in domain 4 interactions) allows the pore transition to occur and a weakened receptor-PA pore affinity is reflected in an increased dissociation of the receptor from the completely transitioned pore (22). Our results agree with this sequence of interactions and indicate that the receptor binding to the transitioned pore is considerably weaker than receptor binding to the prepore since no receptor-pore interactions could be observed and the receptor rapidly dissociates from PA once the prepore transitions to the pore. After transition to PA pore in the presence of soluble receptor, both the SPR and BLI signal amplitudes return to the original baseline that was recorded before the soluble receptor bound to the PA prepore. This again supports the contention that there is a substantial or near complete dissociation of the receptor from the LFN-PA pore complex at pH 5.0 in either the SPR flow or BLI dipped solutions since each of these dissociation solutions no longer contain the soluble receptor.
Another highlight of the work presented herein is the demonstration that one can easily use the smaller detachable BLI biosensors to capture and release the assembled complexes onto EM grids using reversible disulfide linkages, thus allowing one to determine directly the conformation of the large PA pore molecular complexes using electron microscopy. The ability to observe the kinetic transitions and validate the nature of the macromolecular conformational changes that occur on a label free platform allows one to both identify and fine tune complex formation or transitions. Our ability to couple label-free methods with EM methods helped us 1) validate that the PA pore transition had occurred, 2) demonstrate that a soluble micelle will bind to the exposed pore hydrophobic tip, and 3) demonstrate that, once formed, this immobilized PA pore micelle complex is released as soluble individual particles. These successful microvolume test experiments serve as proof of principle examples that then allow us to scale up the procedure to assemble larger sample preparations for image analysis and three-dimensional reconstructions of PA-pore prenanodisc micelle complexes. The ease of directly releasing and examining macromolecular complexes that assemble or transition on BLI tips should be readily applicable in visualizing the molecular structure of other large molecular mass complex systems. In these instances, one can potentially visualize other large size macromolecular structures that assemble on BLI tips that also would correlate with BLI kinetic results. It is entirely possible that this combination of BLI and electron microscopy can be further exploited to follow the folding and assembly of a wide range of soluble protein complexes and membrane protein micelle complexes.
There has been some progress in the development of high throughput screens to identify potential inhibitors of the anthrax toxin internalization and PA pore transition. Using a cell based system, Leppla and colleagues (30) were able to identify a number of potential inhibitors of anthrax toxin induced cell death. In these indirect screens, numerous lead compounds were found to inhibit the prepore to pore transition and subsequent lethal factor translocation. Interestingly, these anti-anthrax small molecule candidates appear to inhibit of the endosomal acidification process since these same lead compounds also inhibited other toxin systems that also require endosomal acidification. Another target for developing novel anti-anthrax compounds involves inhibiting the initial interactions between the anthrax receptors (TEM8 or CMG2) and PA prepore monomers or oligomers (31).
The label free anthrax toxin platforms described herein can potentially be used as test systems to identify direct molecular inhibitors of endosomal transitions in a high throughput screening platform. Both the direct label free detection platform presented herein and the indirect cellular system mentioned above allows one to identify potential inhibitors of pathogenic pathways while avoiding the cumbersome implementation of stringent biosafety constraints. As one compares the presented method with other potential high-throughput methods, the label free methods can potentially identify direct inhibitors of the molecular transition compared with the indirect other cell based methods. It is important to note that the cell based methods are absolutely essential to validate the in vivo relevance and efficacy of potential anti-anthrax lead compounds that can be identified with the BLI or SPR pore transition screens. The K+ release liposomes assay (29) can also serve as a high throughput platform system, but is still one step removed from a direct measurement. The CD transition measurement in detergents (27) also examines the direct pore transitions and is therefore another direct method, but this method may be difficult to scale up to a high-throughput system because one has to implement rapid mixing procedures at higher concentrations.
The SPR or BLI label-free platforms can be used to rapidly access the dynamics of many aspects of the anthrax complex formation and molecular transitions that occur as the pH approaches endosomal solution conditions. In addition to monitoring the pH dependent pore transitions directly, our ability to easily follow and validate the formation of these complexes on the same biosensor surfaces can be used to identify potential small molecule inhibitors the assembly of pre-transition endosomal complexes. Both the pore transitions and each of the individual binding steps (i.e. PA prepore–LFN binding and receptor-PA prepore interactions) are all valid target platforms that can be used to screen, identify or validate potential new classes of antimicrobial compounds that function at either neutral or endosomal pH conditions.
Since the CMG2-prepore structures are known, one may be able to use these initial complexes to identify small molecule candidates identified by virtual screens that bind to potential druggable sites in hopes that they may strengthen the receptor interactions with the prepore. Using BLI or SPR label free approaches, one could then directly test if synthesized protein stabilizer candidates inhibit the PA pore transitions in endosomal-like solution environments. A similar in silico approach was implemented by Wein et al., where they used initially used virtual screening methodologies to identify potential inhibitors to PA prepore oligomerization (32). They then tested a number of positive candidates directly using cell based systems and found that in addition to oligomer inhibition, some of these compounds also inhibited the furin based proteolytic processing of the PA protective antigen (32).
In a broader sense, it is quite conceivable that our ability to monitor direct endosomal-like transitions of anthrax toxin complexes with label-free methods can also serve as a general methodological approach to construct and directly monitor the endosomal transitions of other complex bacterial toxin or viral protein based assembly systems. As summarized above, the ability to specifically assemble multiple component toxin protein systems on label-free platforms has the advantage of providing multiple screening targets to identify inhibitors of numerous toxin specific protein-protein interactions. More uniquely, the ability to assemble pre-endosomal toxin complexes using label-free approaches should enable one to directly target and hopefully inhibit toxin dependent molecular transitions that occur as the endosome acidifies.
Supplementary Material
Acknowledgments
Funding Sources
This work was supported grant funds from NIH R01AI090085 (MTF), NIH SR37AI022021 (RJC) and from the National Center for Research Resources (5P20RR017708-10) and the National Institute of General Medical Sciences (8P20 GM103420-10) from the National Institutes of Health (NZ, PG).
Abbreviations
- PA
Protective antigen
- LF
Lethal factor
- LFN
N-terminal fragment of lethal factor
- EF
Edema Factor
- SPR
Surface plasmon resonance
- BLI
Bio-layer interferometry
- CMG2
Capillary morphogenesis protein 2
- TEM8
Tumor endothelium marker-8
- ANTXR1
Anthrax toxin receptor 1
- ANTXR2
Anthrax toxin receptor 2
- POPC
1-palmitoyl-2-oleoyl-sn-glycero-3-phosphocholine
- PDEA
2-(2-pyridinyldithio) ethaneamine hydrochloride
- EDC
1-Ethyl-3-[3-dimethylaminopropyl]carbodiimide hydrochloride
- NHS
N-Hydroxysuccinimide Ester
Footnotes
Author Contributions
The manuscript was written through contributions of all authors. All authors have given approval to the final version of the manuscript.
The authors declare no competing financial interest.
BLI sensorgrams of transitions (supplemental figure 1) measured channel BLI unit, kinetic fits to the octet and BLItz BLI data (supplemental figure 2A and B) and uncorrected complete SPR LFN-PA prepore-CMG2 construction/ pore transition sensorgrams (supplemental figure 3). This material is available free of charge via the Internet at http://pubs.acs.org
References
- 1.Kintzer AF, Sterling HJ, Tang, Williams ER, Krantz BA. Anthrax toxin receptor drives protective antigen oligomerization and stabilizes the heptameric and octameric oligomer by a similar mechanism. PLoS One. 2010;5:e13888. doi: 10.1371/journal.pone.0013888. [DOI] [PMC free article] [PubMed] [Google Scholar]
- 2.Wesche J, Elliott JL, Falnes PO, Olsnes S, Collier RJ. Characterization of membrane translocation by anthrax protective antigen. Biochemistry. 1998;37:15737–15746. doi: 10.1021/bi981436i. [DOI] [PubMed] [Google Scholar]
- 3.Zako T, Harada K, Mannen T, Yamaguchi S, Kitayama A, Ueda H, Nagamune T. Monitoring of the refolding process for immobilized firefly luciferase with a biosensor based on surface plasmon resonance. J Biochem. 2001;129:1–4. doi: 10.1093/oxfordjournals.jbchem.a002818. [DOI] [PubMed] [Google Scholar]
- 4.Chen LY. Monitoring conformational changes of immobilized RNase A and lysozyme in reductive unfolding by surface plasmon resonance. Anal Chim Acta. 2009;631:96–101. doi: 10.1016/j.aca.2008.10.022. [DOI] [PubMed] [Google Scholar]
- 5.Paynter S, Russell DA. Surface plasmon resonance measurement of pH-induced responses of immobilized biomolecules: conformational change or electrostatic interaction effects? Anal Biochem. 2002;309:85–95. doi: 10.1016/s0003-2697(02)00255-5. [DOI] [PubMed] [Google Scholar]
- 6.Blaustein RO, Koehler TM, Collier RJ, Finkelstein A. Anthrax toxin: channel-forming activity of protective antigen in planar phospholipid bilayers. Proc Natl Acad Sci U S A. 1989;86:2209–2213. doi: 10.1073/pnas.86.7.2209. [DOI] [PMC free article] [PubMed] [Google Scholar]
- 7.Miller CJ, Elliott JL, Collier RJ. Anthrax protective antigen: prepore-to-pore conversion. Biochemistry. 1999;38:10432–10441. doi: 10.1021/bi990792d. [DOI] [PubMed] [Google Scholar]
- 8.Akkaladevi N, Hinton-Chollet L, Katayama H, Mitchell J, Szerszen L, Mukherjee S, Gogol EP, Pentelute BL, Collier RJ, Fisher MT. Assembly of anthrax toxin pore: lethal-factor complexes into lipid nanodiscs. Protein Sci. 2013;22:492–501. doi: 10.1002/pro.2231. [DOI] [PMC free article] [PubMed] [Google Scholar]
- 9.Gogol EP, Akkaladevi N, Szerszen L, Mukherjee S, Chollet-Hinton L, Katayama H, Pentelute BL, Collier RJ, Fisher MT. Three dimensional structure of the anthrax toxin translocon-lethal factor complex by cryo-electron microscopy. Protein Sci. 2013;22:586–594. doi: 10.1002/pro.2241. [DOI] [PMC free article] [PubMed] [Google Scholar]
- 10.Feld GK, Thoren KL, Kintzer AF, Sterling HJ, Tang, Greenberg SG, Williams ER, Krantz BA. Structural basis for the unfolding of anthrax lethal factor by protective antigen oligomers. Nat Struct Mol Biol. 2010;17:1383–1390. doi: 10.1038/nsmb.1923. [DOI] [PMC free article] [PubMed] [Google Scholar]
- 11.Bayburt TH, Sligar SG. Membrane protein assembly into Nanodiscs. FEBS Lett. 2010;584:1721–1727. doi: 10.1016/j.febslet.2009.10.024. [DOI] [PMC free article] [PubMed] [Google Scholar]
- 12.Pimental RA, Christensen KA, Krantz BA, Collier RJ. Anthrax toxin complexes: heptameric protective antigen can bind lethal factor and edema factor simultaneously. Biochem Biophys Res Commun. 2004;322:258–262. doi: 10.1016/j.bbrc.2004.07.105. [DOI] [PubMed] [Google Scholar]
- 13.Mogridge J, Cunningham K, Collier RJ. Stoichiometry of anthrax toxin complexes. Biochemistry. 2002;41:1079–1082. doi: 10.1021/bi015860m. [DOI] [PubMed] [Google Scholar]
- 14.Ludtke SJ, Baldwin PR, Chiu W. EMAN: semiautomated software for high-resolution single-particle reconstructions. J Struct Biol. 1999;128:82–97. doi: 10.1006/jsbi.1999.4174. [DOI] [PubMed] [Google Scholar]
- 15.Frank J, Radermacher M, Penczek P, Zhu J, Li Y, Ladjadj M, Leith A. SPIDER and WEB: processing and visualization of images in 3D electron microscopy and related fields. J Struct Biol. 1996;116:190–199. doi: 10.1006/jsbi.1996.0030. [DOI] [PubMed] [Google Scholar]
- 16.Katayama H, Wang J, Tama F, Chollet L, Gogol EP, Collier RJ, Fisher MT. Three-dimensional structure of the anthrax toxin pore inserted into lipid nanodiscs and lipid vesicles. Proc Natl Acad Sci U S A. 2010;107:3453–3457. doi: 10.1073/pnas.1000100107. [DOI] [PMC free article] [PubMed] [Google Scholar]
- 17.Pettersen EF, Goddard TD, Huang CC, Couch GS, Greenblatt DM, Meng EC, Ferrin TE. UCSF Chimera--a visualization system for exploratory research and analysis. J Comput Chem. 2004;25:1605–1612. doi: 10.1002/jcc.20084. [DOI] [PubMed] [Google Scholar]
- 18.Milne JC, Collier RJ. pH-dependent permeabilization of the plasma membrane of mammalian cells by anthrax protective antigen. Mol Microbiol. 1993;10:647–653. doi: 10.1111/j.1365-2958.1993.tb00936.x. [DOI] [PubMed] [Google Scholar]
- 19.Milne JC, Furlong D, Hanna PC, Wall JS, Collier RJ. Anthrax protective antigen forms oligomers during intoxication of mammalian cells. J Biol Chem. 1994;269:20607–20612. [PubMed] [Google Scholar]
- 20.Katayama H, Janowiak BE, Brzozowski M, Juryck J, Falke S, Gogol EP, Collier RJ, Fisher MT. GroEL as a molecular scaffold for structural analysis of the anthrax toxin pore. Nat Struct Mol Biol. 2008;15:754–760. doi: 10.1038/nsmb.1442. [DOI] [PMC free article] [PubMed] [Google Scholar]
- 21.Wolfe JT, Krantz BA, Rainey GJ, Young JA, Collier RJ. Whole-cell voltage clamp measurements of anthrax toxin pore current. J Biol Chem. 2005;280:39417–39422. doi: 10.1074/jbc.M509049200. [DOI] [PubMed] [Google Scholar]
- 22.Rainey GJ, Wigelsworth DJ, Ryan PL, Scobie HM, Collier RJ, Young JA. Receptor-specific requirements for anthrax toxin delivery into cells. Proc Natl Acad Sci U S A. 2005;102:13278–13283. doi: 10.1073/pnas.0505865102. [DOI] [PMC free article] [PubMed] [Google Scholar]
- 23.Lacy DB, Wigelsworth DJ, Melnyk RA, Harrison SC, Collier RJ. Structure of heptameric protective antigen bound to an anthrax toxin receptor: a role for receptor in pH-dependent pore formation. Proc Natl Acad Sci U S A. 2004;101:13147–13151. doi: 10.1073/pnas.0405405101. [DOI] [PMC free article] [PubMed] [Google Scholar]
- 24.Santelli E, Bankston LA, Leppla SH, Liddington RC. Crystal structure of a complex between anthrax toxin and its host cell receptor. Nature. 2004;430:905–908. doi: 10.1038/nature02763. [DOI] [PubMed] [Google Scholar]
- 25.Scobie HM, Marlett JM, Rainey GJ, Lacy DB, Collier RJ, Young JA. Anthrax toxin receptor 2 determinants that dictate the pH threshold of toxin pore formation. PLoS One. 2007;2:e329. doi: 10.1371/journal.pone.0000329. [DOI] [PMC free article] [PubMed] [Google Scholar]
- 26.Wigelsworth DJ, Krantz BA, Christensen KA, Lacy DB, Juris SJ, Collier RJ. Binding stoichiometry and kinetics of the interaction of a human anthrax toxin receptor, CMG2, with protective antigen. J Biol Chem. 2004;279:23349–23356. doi: 10.1074/jbc.M401292200. [DOI] [PubMed] [Google Scholar]
- 27.Vernier G, Wang J, Jennings LD, Sun J, Fischer A, Song L, Collier RJ. Solubilization and characterization of the anthrax toxin pore in detergent micelles. Protein Sci. 2009;18:1882–1895. doi: 10.1002/pro.199. [DOI] [PMC free article] [PubMed] [Google Scholar]
- 28.Pilpa RM, Bayrhuber M, Marlett JM, Riek R, Young JA. A receptor-based switch that regulates anthrax toxin pore formation. PLoS Pathog. 2011;7:e1002354. doi: 10.1371/journal.ppat.1002354. [DOI] [PMC free article] [PubMed] [Google Scholar]
- 29.Sun J, Vernier G, Wigelsworth DJ, Collier RJ. Insertion of Anthrax Protective Antigen into Liposomal Membranes: EFFECTS OF A RECEPTOR. J Biol Chem. 2007;282:1059–1065. doi: 10.1074/jbc.M609869200. [DOI] [PubMed] [Google Scholar]
- 30.Zhu PJ, Hobson JP, Southall N, Qiu C, Thomas CJ, Lu J, Inglese J, Zheng W, Leppla SH, Bugge TH, Austin CP, Liu S. Quantitative high-throughput screening identifies inhibitors of anthrax-induced cell death. Bioorg Med Chem. 2009;17:5139–5145. doi: 10.1016/j.bmc.2009.05.054. [DOI] [PMC free article] [PubMed] [Google Scholar]
- 31.Cryan LM, Habeshian KA, Caldwell TP, Morris MT, Ackroyd PC, Christensen KA, Rogers MS. Identification of Small Molecules That Inhibit the Interaction of TEM8 with Anthrax Protective Antigen Using a FRET Assay. J Biomol Screen. 2013;18:714–725. doi: 10.1177/1087057113478655. [DOI] [PMC free article] [PubMed] [Google Scholar]
- 32.Wein AN, Williams BN, Liu S, Ermolinsky B, Provenzano D, Abagyan R, Orry A, Leppla SH, Peredelchuk M. Small molecule inhibitors of Bacillus anthracis protective antigen proteolytic activation and oligomerization. J Med Chem. 2012;55:7998–8006. doi: 10.1021/jm300804e. [DOI] [PMC free article] [PubMed] [Google Scholar]
- 33.Pannifer AD, Wong TY, Schwarzenbacher R, Renatus M, Petosa C, Bienkowska J, Lacy DB, Collier RJ, Park S, Leppla SH, Hanna P, Liddington RC. Crystal structure of the anthrax lethal factor. Nature. 2001;414:229–233. doi: 10.1038/n35101998. [DOI] [PubMed] [Google Scholar]
Associated Data
This section collects any data citations, data availability statements, or supplementary materials included in this article.


