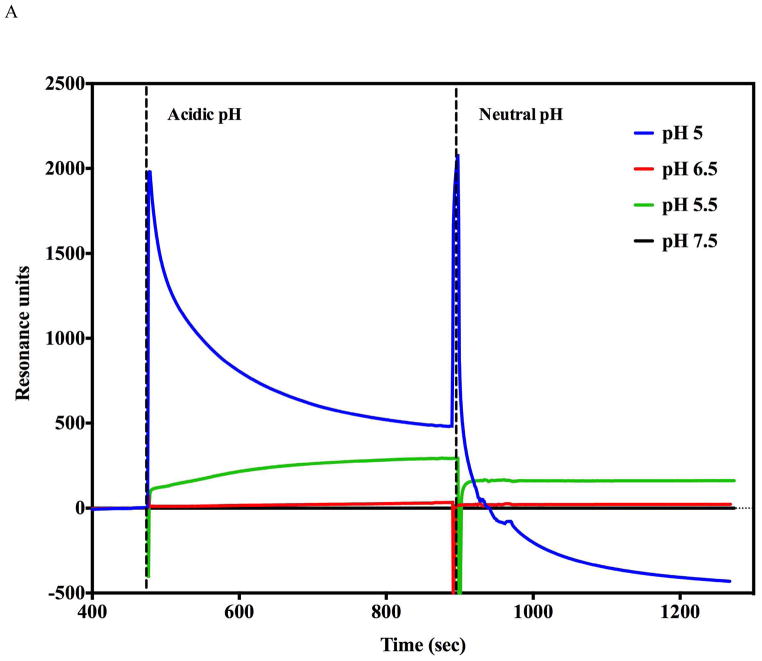
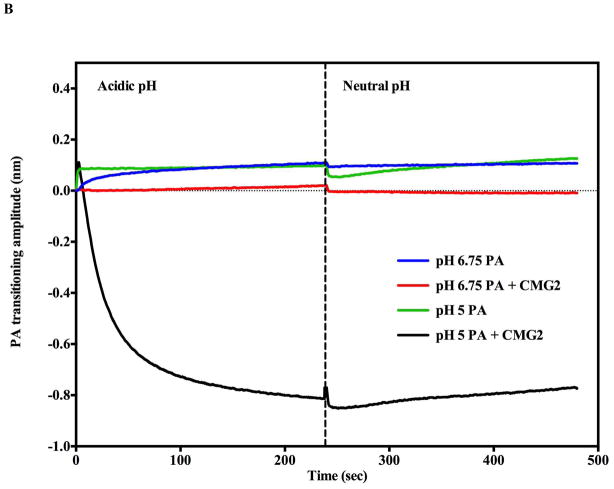
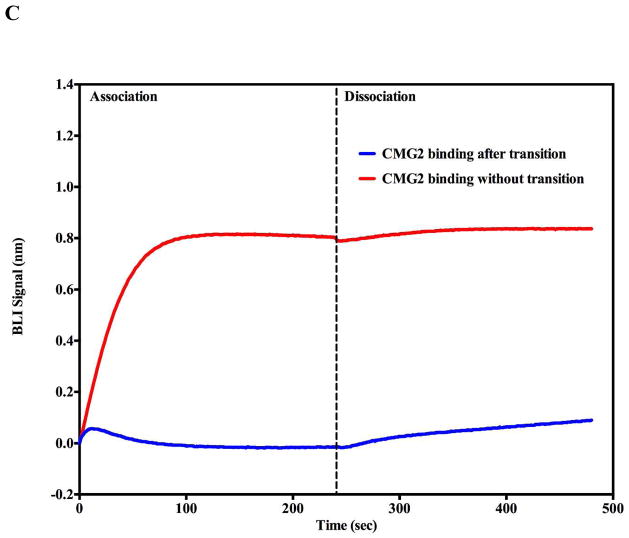
Figure 6.
pH induced transition in the presence of soluble CMG2 receptor (0.5 μM). A) Receptor binding inhibits acid induced transitions above pH 5.5 as assessed by SPR. No significant pH induced transitions were observed (Green and black traces) until the flow buffer pH was lowered to pH 5.5 (Green trace). At pH 5.0 (Blue trace), there was an initial rapid rise followed by a decline in amplitude consistent with PA prepore transition to pore followed by receptor dissociation. The spike observed at ~ 900s is due to pH shift from acidic to neutral pH. B) BLI biosensor traces indicate that acid induced transitions at pH 6.75 (Blue trace) are inhibited (Red trace) when the CMG2 receptor is initially bound to the prepore. At pH 5.0 the prepore rapidly shows a rapid acid induced transition (Green trace). In the presence of the CMG2 receptor (0.5 μM) the BLI signal initially rises to the pH 5.0 transition amplitude (without CMG2 present – green trace) and sharply declines to a level that nearly matchs the initial baseline of the prepore prior to receptor loading (just above −0.8 nm value) (Black trace). C). BLI sensorgram shows that the soluble CMG2 (0.5 μM) binding to the immobilized prepore (pH 7.5) results in a large upward deflection in signal (red trace) (+0.8 nm). Very little CMG2 dissociates from the complex when the tip is dipped into a solution without CMG2 (dissociation phase). In contrast, if the prepore is pH transitioned to the pore on the BLI biosensor (pH 5.0) prior to returning (dipping) the tip back into the 0.5 μM CMG2 solution at pH 7.5, very little PA pore-CMG2 receptor binding signal is observed during the association phase (Blue trace).


