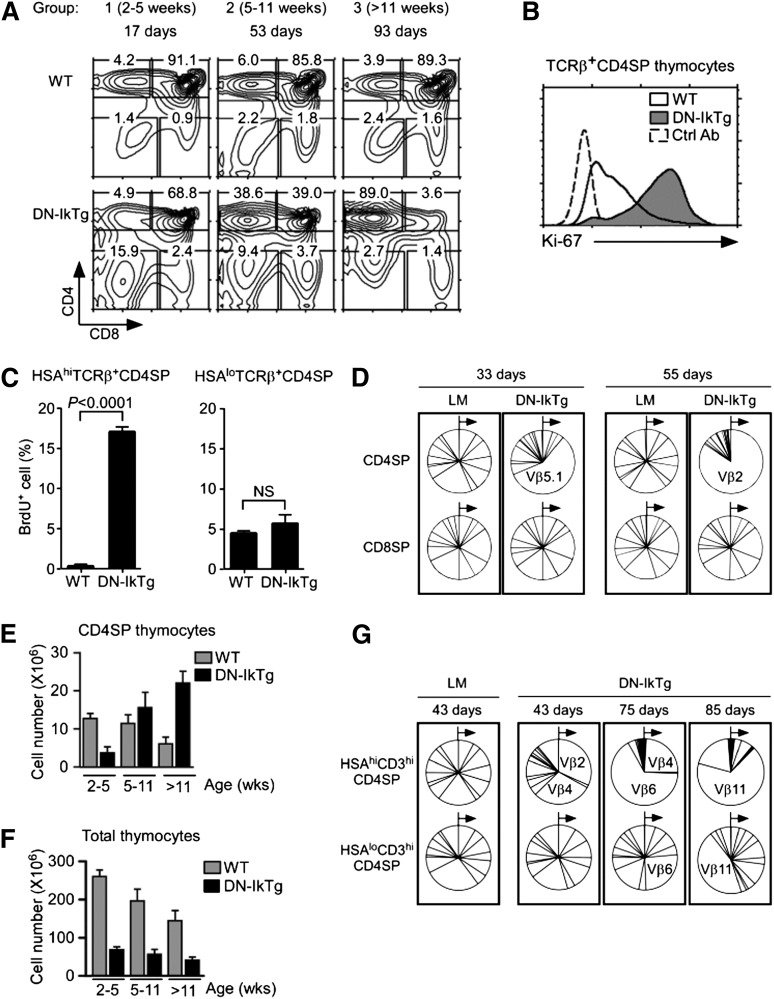
Figure 3.
Clonal expansion of CD4SP cells in DN-IkTg thymocytes. (A) Thymocyte profiles of DN-IkTg mice with progressing age. Contour plots show representative CD4/CD8 thymocyte profiles of WT and DN-IkTg mice at different ages. Data are representative of at least 5 independent experiments with 21 WT and 27 DN-IkTg mice. (B) Intracellular Ki-67 staining in TCRβ+CD4SP thymocytes. Data are representative of 3 independent experiments with 4 WT and 6 DN-IkTg mice. The histogram shows data from 49-day-old WT and 80-day-old DN-IkTg mouse. (C) BrdU labeling assays of WT and DN-IkTg thymocytes. BrdU incorporation was determined in immature (HSAhiTCRβ+) and mature (HSAloTCRβ+) CD4SP thymocytes by intracellular staining. Data are the summary of 2 independent experiments with 3 WT mice (two 55 days old and one 58 days old) and 4 DN-IkTg mice (45, 62, 62, and 82 days old). (D) TCR Vβ distribution in CD4SP and CD8SP thymocytes. LM and DN-IkTg thymocytes were stained for a panel of 15 different TCR Vβ segments starting from Vβ2 through Vβ17a in a clockwise direction (see Methods). Relative expression of individual TCR Vβ on CD4SP and CD8SP cells are shown in pie charts for each individual mouse. Each pie chart represents an independent experiment. Data show the representative results from 2 independent experiments with each 1 age-matched (33 and 55 days old) WT and DN-IkTg mouse, respectively. (E) CD4SP thymocyte numbers in WT and DN-IkTg mice with progressing age. CD4SP cell numbers were determined in 3 different age groups of WT and DN-IkTg mice: group 1 (2-5 weeks), group 2 (5-11 weeks), and group 3 (>11 weeks). Data represent the summary of at least 4 independent experiments with 17 WT and 23 DN-IkTg mice. Bar graphs represent mean ± SEM. (F) Total thymocyte numbers of WT and DN-IkTg mice with progressing age. Thymocyte numbers were determined in the indicated age groups with 21 WT and 27 DN-IkTg mice. Data show the summary of at least 5 independent experiments and represent the mean ± SEM. (G) TCR Vβ distribution in HSAhi and HSAloCD3hiCD4SP thymocytes. Indicated thymocyte populations from LM and DN-IkTg mice were stained for a panel of 15 different TCR Vβ segments whose relative distributions are shown in pie charts. Each box indicates analyses from a single mouse.

