

Abstract
Purpose: Čerenkov radiation emission occurs in all tissue, when charged particles (either primary or secondary) travel at velocity above the threshold for the Čerenkov effect (about 220 KeV in tissue for electrons). This study presents the first examination of optical Čerenkov emission as a surrogate for the absorbed superficial dose for MV x-ray beams.
Methods: In this study, Monte Carlo simulations of flat and curved surfaces were studied to analyze the energy spectra of charged particles produced in different regions near the surfaces when irradiated by MV x-ray beams. Čerenkov emission intensity and radiation dose were directly simulated in voxelized flat and cylindrical phantoms. The sampling region of superficial dosimetry based on Čerenkov radiation was simulated in layered skin models. Angular distributions of optical emission from the surfaces were investigated. Tissue mimicking phantoms with flat and curved surfaces were imaged with a time domain gating system. The beam field sizes (50 × 50–200 × 200 mm2), incident angles (0°–70°) and imaging regions were all varied.
Results: The entrance or exit region of the tissue has nearly homogeneous energy spectra across the beam, such that their Čerenkov emission is proportional to dose. Directly simulated local intensity of Čerenkov and radiation dose in voxelized flat and cylindrical phantoms further validate that this signal is proportional to radiation dose with absolute average discrepancy within 2%, and the largest within 5% typically at the beam edges. The effective sampling depth could be tuned from near 0 up to 6 mm by spectral filtering. The angular profiles near the theoretical Lambertian emission distribution for a perfect diffusive medium, suggesting that angular correction of Čerenkov images may not be required even for curved surface. The acquisition speed and signal to noise ratio of the time domain gating system were investigated for different acquisition procedures, and the results show there is good potential for real-time superficial dose monitoring. Dose imaging under normal ambient room lighting was validated, using gated detection and a breast phantom.
Conclusions: This study indicates that Čerenkov emission imaging might provide a valuable way to superficial dosimetry imaging in real time for external beam radiotherapy with megavoltage x-ray beams.
Keywords: Cerenkov, Cherenkov, Čerenkov, surface dosimetry, superficial dosimetry, imaging, LIANC, external beam radiotherapy
INTRODUCTION
In megavoltage (MV) external beam radiotherapy (EBRT), skin is either included in the intended treatment volume, or may be a dose limiting organ at risk depending on the clinical plan. Skin dose measurements during radiotherapy would be a useful tool for treatment monitoring, skin reaction estimation,1 and treatment plan design and modification.2, 3, 4, 5, 6, 7 However, superficial dose is generally deposited in the build-up region, being sensitive to many factors including beam energy, beam type, beam filter,8, 9 incident angle,10, 11, 12 distance,9, 13 complex patient surface profiles,7, 14 internal heterogeneities,15 patient movement, and deformation. These factors, especially irregular surface profiles, internal heterogeneities, movement and deformation of the treatment region, decrease the accuracy of superficial dose prediction and may result in underdosing or overdosing in specified treatment plans. Several conventional dose measuring methods, such as radiochromic film,16, 17, 18, 19, 20 ionization chamber,21 MOSFETs,22, 23, 24 and TLDs (Refs. 25, 26, 27), exist for superficial dose measurement; however, these techniques require clinical intervention to place detectors on the patient and additional personnel time for postprocessing. All are limited by small fixed region measurements and sensitivity is often a function of angular orientation of the detector with respect to the incident beam. Film and TLDs have longer offline processing procedures which prevent superficial dose monitoring in real time, and so are not done routinely. Thus, a simple method of superficial dose monitoring in real time, suitable for large fields of view, would be desirable. In this study, the feasibility of using Čerenkov emission is investigated for the first time for superficial dose imaging for megavoltage x-ray beam.
Čerenkov radiation emission occurs in a dielectric medium (such as water and biological tissue) when charged particles move with a phase speed greater than the speed of light in that medium.28 The Čerenkov effect induces continuous wavelengths of optical emission from the ultraviolet down to the near-infrared. Frank-Tamm's formula shows that the spectral intensity emitted varies as the inverse square of the wavelength, and thus Čerenkov light is observed as highly weighted to the blue wavelength ranges.29 Recently, Čerenkov radiation was measured from megavoltage external x-ray and electron beams during radiotherapy in both water and tissue,30 showing the potential applications such as oxygenation sensing and oxygen partial pressure tomography.31, 32, 33 It has been shown that, above the threshold energy for Čerenkov radiation (approximately 220 KeV in biological tissue), under the approximation of charged particle equilibrium, the dose deposited by megavoltage radiotherapy radiation, and the number of Čerenkov photons released locally are directly proportional; therefore, beam profiling and superficial dosimetry imaging based on Čerenkov radiation is feasible.34, 35, 36 Radiation dose is calculated by , where D represents radiation dose, S(E) represents the mass stopping power (J m2/kg) of the medium and P(E) represents the fluence spectra of charged particles (m−2). Similarly, the local intensity of Čerenkov radiation can be calculated by , where I represents the local intensity of Čerenkov radiation, Ec represents the threshold energy of Čerenkov radiation in the medium, C(E) represents the number of Čerenkov photon emitted by a charged particle (such as electron) with kinetic energy of E per unit path length of the propagation of the charged particle and P(E) represents the spectra of charged particles. Typically, S(E) and C(E) have very different profiles. However, as long as P(E) is spatially independent, i.e., the spectra of charged particles is a constant distribution in the region of interest, radiation dose is directly proportional to the local intensity of Čerenkov radiation above the threshold energy. Reference data37 show that the continuous slowing down approximation (CSDA) range of electrons, with kinetic energy below the threshold energy in the medium (take water as example, Ec ≅ 0.263 MeV) is around 0.1 mm. Due to scattering of electrons, the absolute distance of travel below the threshold energy of Čerenkov radiation is actually smaller than the CSDA range. This means that, to a resolution of 0.1 mm, with the assumption that P(E) is spatially independent in the region of interest, the dose contributed by those charged particles below the threshold energy will be a constant off-set of the dose contributed by charged particles above the threshold energy. As long as P(E) is spatially invariant (charged particle equilibrium) in the region of interest, to the resolution of the CSDA range of charged particles below the threshold energy, local intensity of Čerenkov radiation will be directly proportional to radiation dose. This observation is the theoretical underpinning of why Čerenkov emission can be considered to be proportional to deposited dose in several situations.
In this study, the spectra of charged particles [P(E)] was simulated at different regions (entrance and exit regions), crossing the whole beam near the surfaces while irradiating flat and curved phantoms with megavoltage x-ray beams to validate the spatial homogeneity of P(E). Radiation beams were simulated in flat and curved phantoms, and radiation dose and local intensity of Čerenkov radiation near the surfaces were compared directly with each other, to demonstrate that local intensity of Čerenkov radiation is proportional to superficial radiation dose. Sampling regions of superficial dosimetry based upon Čerenkov emission for x-ray beams were investigated by Monte Carlo simulations in layered skin models (flat and curved surface) with typical optical properties. Angular distributions of Čerenkov photons escaped the surfaces on flat and curved phantom, which is potentially useful for intensity corrections due to the viewing angle and curvature of the surfaces, were simulated. Experimentally, while irradiating with megavoltage x-ray beams, surface of flat and curved (breast-shaped) tissue-mimic phantoms were imaged by a time domain gating system,38 varying field sizes, incident angles, and imaging regions. The acquisition speed and signal to noise ratio (SNR) were investigated for different acquisition procedures. The ability of imaging with reasonable ambient light levels was validated with a gated intensified CCD camera. Taken together this provides a comprehensive preclinical analysis of the feasibility of surface dose monitoring with optical imaging.
MATERIALS AND METHOD
This study utilized the GEANT4 based toolkit GAMOS for Monte Carlo modeling to stochastically simulate radiation transport, dose deposition, Čerenkov radiation emission, and transport.39 The process of radiation transport, dose deposition, generation of Čerenkov photons, and transport of optical photons have been explained in detail by previous studies.31, 40 Phase space files of 6 MV x-ray beams for the linear accelerator (LINAC) (Varian Clinic 2100CD) were generated in Ref. 41 and used in this study. The experiments were performed with a LINAC (Varian Clinic 2100CD, Varian Medical Systems, Palo Alto) at the Norris Cotton Cancer Center in the Dartmouth-Hitchcock Medical Center.
Simulation: Energy spectra of charged particles
Flat surface
As shown in Fig. 1a, detectors with size of 5 × 5 × 5 mm3 at positions (central and edge regions) were place on the surface of a flat phantom (water equivalent) of 100 mm thickness. Phase space files of 6 MV x-ray beams were used to irradiate the flat phantom at SSD = 1000 mm. Energies of charged particles in the detectors were logged. Entrance and exit planes were investigated for field sizes of 20 × 20, 40 × 40, 100 × 100, and 200 × 200 mm2. For each field size, 100 × 106 primary particles (x-ray photons from the phase space files) were launched for the simulation.
Figure 1.
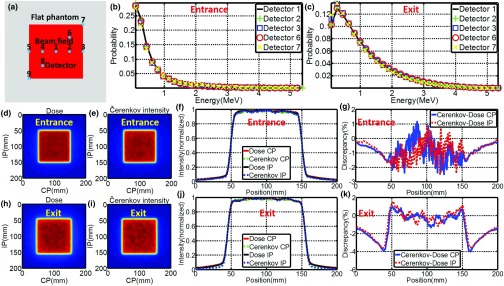
(a) Position of detectors on flat phantom with respect to the beam field. (b) and (c) Energy spectra of charged particles for entrance and exit planes. (d) and (e) Images (self-normalized by the maximum pixel value) of superficial dose and local Čerenkov emission for entrance plane. (h) and (i) Images (self-normalized by the maximum pixel value) of superficial dose and local Čerenkov emission for exit plane. (f) and (j) CP and IP profiles of radiation dose and local Čerenkov emission for entrance and exit planes. (g) and (k) Discrepancy of CP and IP profiles of radiation dose and local Čerenkov emission for entrance and exit planes.
Curved (cylindrical) surface
As shown in Fig. 2a, spherical detectors with diameter of 3 mm were positioned along the central arc of a cylinder phantom (water equivalent, diameter, and height of 83 mm) every 15°. A phase space file of 6 MV x-ray beam with field size of 100 × 100 mm2 was adopted to irradiate the cylindrical phantom centrally from the side at SSD = 1000 mm. One hundred million primary particles were launched and simulated, while energies of charged particles in these detectors were logged.
Figure 2.

(a) Placement of detectors along the arc of the cylindrical phantom. (b) Energy spectra of charged particles along the arc. (c) and (d) Images (self-normalized by the maximum pixel value) of radiation dose and local Čerenkov emission of the central transection of the cylindrical phantom. (e) and (g) Profiles of superficial dose and local Čerenkov emission for entrance (0°–90°) and exit (90°–180°) plane (As indicated by dashed lines in Figs. 2(c) and 2(d), profiles were calculated based on a layer of 3 mm along the arc of the cylindrical phantom.). (f) and (h) Discrepancies between profiles of superficial dose and local Čerenkov emission for entrance (0°–90°) and exit (90°–180°) plane.
Simulation: Radiation dose and local intensity of Čerenkov radiation
Flat surface
Similar to Sec. 2A1, water equivalent flat phantom was defined in GAMOS and irradiated by 6 MV x-ray beams with field sizes of 20 × 20, 40 × 40, 100 × 100, and 200 × 200 mm2. Layers with 10 mm thickness at the entrance and exit of plane of the phantom were voxelized with size of 0.5 × 0.5 × 0.1 mm3 (field sizes of 20 × 20 and 40 × 40 mm2) and 0.25 × 0.25 × 0.1 mm3 (field sizes of 100 × 100 and 200 × 200 mm2). One hundred million primary particles were launched from the phase space files and simulated in the phantom. Radiation dose and number of local Čerenkov photon with wavelength from 400 to 900 nm were logged for each voxel. Images of radiation dose and local intensity of Čerenkov radiation were achieved by summing up the recorded data for 3 mm underneath the surfaces at entrance and exit planes. Images were smoothed by bilateral filter42 and self-normalized by the maximum to the range of [0, 1]. Cross plane (CP) and inter plane (IP) profiles of images of radiation dose and local intensity of Čerenkov radiation were compared directly for corresponding field size.
Curved (cylindrical) surface
The cylindrical phantom defined in Sec. 2A2 was voxelized with size of 0.5 × 0.5 × 0.5 mm3. 6 MV x-ray beam with field size of 100 × 100 mm2 was simulated to irradiate centrally from the side at SSD = 1000 mm. One hundred million primary particles were launched and simulated and the radiation dose and local intensity of Čerenkov radiation were logged for each voxel. At the boundary, the number recorded by each voxel was weighted based on the fraction of the volume inside the cylinder. Six planes of voxels adjacent to the central transection, representing a thickness of 3 mm, were isolated and median filtered along the central axis of the cylinder to generate images of radiation dose and local intensity of Čerenkov radiation of the central transection. Images of the central transection were smoothed by bilateral filtering. From the images of the central transection, for a cylindrical layer along the arc of 3 mm thickness underneath the side surface [indicated by dashed lines in Figs. 2c, 2d], profiles of radiation dose and local intensity of Čerenkov radiation were compared.
Simulation: Sampling region in layered skin models
Thickness and optical properties of layers of the skin have been reported in several papers, and here we used the well characterized model by Meglinski et al.43 This layered skin model (flat phantom with size of 1000 × 1000 × 100 mm3) was built in GAMOS with each layer having the corresponding thickness and optical properties (refractive index, absorption, and scattering coefficient) at entrance and exit plane. Three types of skin [skin 1: lightly pigmented skin (∼1% melanin in epidermis), skin 2: moderately pigmented (∼12% melanin in epidermis), skin 3: darkly pigmented (∼30% melanin in epidermis)] have been investigated. Pencil beams were generated by sampling the energy distribution of the phase space file (6 MV, 100 × 100 mm2). While irradiating (100 × 106 primary particles) the surfaces of the phantom normally with the pencil beam, Čerenkov photons were generated and tracked through processes including Mie scattering, absorption, reflection, and refraction at the boundary. The generation of Čerenkov photons and transport of optical photons have been explained in detail by previous studies.31, 40 For any Čerenkov photon escaping the entrance surface of the phantom, initial positions and final energy were recorded. The depth of all the Čerenkov photons escaping the entrance surface was logged in a histogram and was fitted by a single exponential decay.44 The effective sampling depth (depth where the detection sensitivity drops to 1/e) was calculated. Sampling depth tuning based on spectral filtering can be discerned from the results of this simulation.
Simulation: Angular distributions of Čerenkov emission on the surfaces
Flat homogeneous phantom
A slab (1000 × 1000 mm2, varying thickness from 0.1 to 100 mm) of homogeneous water equivalent phantom was defined in GAMOS [Fig. 5a]. Pencil beams were adopted to irradiate the slab phantom. The final directions of any Čerenkov photon escaping the surfaces (entrance and exit plane) were logged. Angular distributions with respect to the normal of the surfaces were calculated by histogramming the directions and compared with the Lambertian distribution for ideal diffusive medium. Factors affecting the angular distribution, including incident angle (0°–85°), optical properties (1%–5% blood + 1%–3% intralipid),31 refractive index (1.1–1.5), tissue thickness (0.1–100 mm), beam energy (sampled from the 6 MV x-ray phase space file and monoenergetic from 2 to 10 MV) and scattering model ((1 − α) × Rayleigh + α × Mie), were investigated. As indicated in bold in Table 2, the default conditions are incident angle = 0°, optical properties = 1% blood + 1% intralipid, refractive index = 1.33, tissue thickness = 100 mm, beam energy = sampled from the 6 MV X-ray phase space file, and scattering model = 100% Mie scattering. While varying one of the conditions, the other conditions were set to the default.
Figure 5.

(a) Simulation of the angular distribution of Čerenkov photons escaped the surfaces for flat phantom with pencil beams. (b) Simulation of the angular distribution of Čerenkov photons escaped the surfaces for the cylindrical phantom. (c) Angular distribution for different skin types. (d) Angular distributions for skin 1 with different incident angles from 0° to 70°. (e) Angular distributions for skin 1 along the arc of the cylindrical phantom. (f) Angular distributions for different tissue thickness from 0.1 to 100 mm on the entrance surface.
Table 2.
Angular distributions of Čerenkov photons escaped the surfaces compared with Lambertian distribution.
| Flat homogenous phantom | ||||||||||
|---|---|---|---|---|---|---|---|---|---|---|
| Incident angle (deg) | 0 | 10 | 20 | 30 | 40 | 50 | 60 | 70 | 80 | 85 |
| Discrepancy (%) | 4.5, 3.1 | 5.0, 4.0 | 3.6, 3.2 | 3.8, 3.9 | 4.7, 3.6 | 3.9, 3.6 | 3.3, 3.9 | 3.6, 3.3 | 3.2, NA | 3.1, NA |
| Beam energy (MV) | 2 | 4 | 6 | 8 | 10 | Sampled1 | ||||
| Discrepancy (%) | 4.0, 3.5 | 3.5, 3.2 | 3.6, 3.7 | 4.6, 2.9 | 3.5, 2.9 | 4.5, 3.1 | ||||
| Optical properties2 | 1% and 1% | 1% and 2% | 1% and 3% | 2.5% and 1% | 2.5% and 2% | 2.5% and 3% | 5% and 1% | 5% and 2% | 5% and 3% | |
| Discrepancy (%) | 4.5, 3.1 | 4.0, 3.2 | 4.3, 3.3 | 4.3, 3.3 | 3.9, 4.0 | 3.2, 3.6 | 4.6, 3.2 | 5.0, 3.2 | 4.3, 3.3 | |
| Refractive index | 1.1 | 1.2 | 1.3 | 1.33 | 1.4 | 1.5 | ||||
| Discrepancy (%) | 6.8, 7.2 | 4.7, 4.1 | 4.7, 3.1 | 4.5, 3.1 | 3.0, 3.1 | 3.2, 3.0 | ||||
| Tissue thickness (mm) | 0.1 | 0.5 | 1 | 5 | 10 | 50 | 100 | |||
| Discrepancy (%) | 23.2, 15.9 | 5.9, 9.4 | 1.9, 4.6 | 3.4, 2.2 | 3.9, 3.4 | 3.4, 3.2 | 4.5, 3.1 | |||
| Scattering phase function3 | 0.5 | 0.6 | 0.7 | 0.8 | 0.9 | 0.95 | 0.99 | 1 | ||
| Discrepancy (%) | 3.6, 2.6 | 3.3, 2.7 | 3.0, 3.0 | 3.5, 3.0 | 3.7, 3.2 | 4.3, 3.7 | 3.6, 3.3 | 4.5, 3.1 | ||
| Flat surface of layered skin models | ||||||||||
| Incident angle (deg) | 0 | 10 | 20 | 30 | 40 | 50 | 60 | 70 | ||
| Skin 1 | 4.0, 3.1 | 4.0, 3.8 | 4.1, 3.7 | 4.1, 3.6 | 3.7, 4.0 | 4.2, 3.7 | 4.2, 3.4 | 3.3, 3.8 | ||
| Skin 2 | 6.6, 5.8 | 6.4, 5.8 | 6.5, 5.6 | 6.4, 5.6 | 6.1, 5.9 | 6.4, 5.8 | 6.5, 5.8 | 5.7, 6.0 | ||
| Skin 3 | 8.1, 7.3 | 7.5, 7.1 | 7.7, 7.1 | 7.7, 7.0 | 7.5, 6.9 | 7.6, 7.3 | 7.5, 7.0 | 7.2, 6.8 | ||
| Curved (cylindrical) surface of layered skin models | ||||||||||
| Position along the central arc (deg) | 0, 15 | 30, 45 | 60, 75 | 90 | 105, 120 | 135, 150 | 165, 180 | |||
| Skin 1 | 4.7, 4.7 | 7.9, 3.6 | 4.3, 4.5 | 4.4 | 4.2, 4.6 | 4.0, 4.4 | 3.3, 3.1 | |||
| Skin 2 | 6.4, 6.4 | 8.5, 6.5 | 6.2, 6.7 | 6.8 | 6.2, 6.1 | 5.9, 5.8 | 6.0, 5.5 | |||
| Skin 3 | 7.4,7.5 | 9.2, 7.5 | 7.4, 7.3 | 7.4 | 7.2, 7.0 | 7.1, 7.0 | 7.2, 6.9 | |||
Sampled from 6 MV phase space file.
Optical properties decided by 1%–5% blood +1%– 3% intralipid.
Phase function decided by (1 ∼ α) × Rayleigh + α × Mie with values of α listed in the table.
Flat surface of layered skin models
Similar to Sec. 2.C.1, slab phantom of layered skin (1000 × 1000 × 100 mm3) was built in GAMOS [Fig. 5a]. Pencil beams sampled from the 6 MV x-ray phase space file was adopted to irradiate the slab phantom. The final directions of any Čerenkov photon escaping the surfaces (entrance and exit plane) were logged. Angular distributions with respect to the normal of the surfaces were calculated by histogramming the directions and compared with the Lambertian distribution for ideal diffusive medium. The three types of skin mentioned before were investigated, while incident angle varying from 0° to 70°.
Curved (cylindrical) surface of layered skin models
Similar to the setup described in Sec. 2A2, cylindrical phantoms of layered skin (41.5 radius, 41.5 mm height) were built in GAMOS and detectors (3 mm width, 5° along the central arc) were placed on the surfaces [Fig. 5b]. For any Čerenkov photon escaped the surfaces and reach the detectors, direction was logged. The angular distribution with respect to the normal of the detectors was calculated and compared with a Lambertian distribution to investigate how it being affected by the curvature of the surfaces.
Tissue phantom imaging with time domain gating system
Flat phantom
As shown in Fig. 6a, the optical imaging system was created from a time domain gating ICCD camera (PI-MAX3, Princeton Instrument) with a Canon EF (55–250 mm, f/4–5.6) lens. The LINAC works in pulsed mode and the radiation burst lasts for approximately 3 μs at a frequency near 180 Hz. By synchronizing the ICCD gate to the radiation burst, Čerenkov radiation emitted from the surfaces was imaged, while the contribution of the signal from ambient light was significantly reduced.38 A solid water equivalent phantom (Plastic Water, CNMC) of 300 × 300 × 40 mm3 was irradiated by 6 MV x-ray beams (600 MU/min) at SSD = 1000 mm. The ICCD camera was mounted 2.5 m away and 1 m above the surfaces of the phantom and a computer, which was used to remotely control the camera outside the radiotherapy room. Images were processed by background subtraction, median filtering over a stack of repetitive frames of images with each frame of image an accumulation of certain number (50–1000) of radiation bursts to remove stray radiation noise which results in saturated pixel values.45 Affine transformation was implemented based on chosen points on the image to correct the perspective distortion.44 Finally, each image was smoothed by bilateral filtering and self-normalized by the maximum to the range of [0, 1]. Acquisition speed and signal to noise ratio for different acquisition procedure were investigated.
Figure 6.
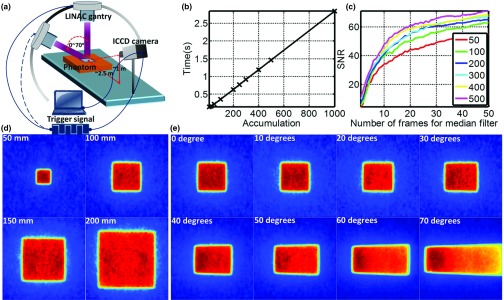
(a) Time domain gating system. (b) Acquisition speed of one frame of image with accumulation of different number of radiation bursts. (c) Signal to noise ratio for different acquisition procedures. (d) Čerenkov images (self-normalized by the maximum pixel value) of flat phantom with field sizes from 20 × 20 to 200 × 200 mm2. (e) Čerenkov images (self-normalized by the maximum pixel value) of flat phantom with incident angles from 0° to 70°.
Breast shaped phantom
To simulate whole breast radiotherapy, an anthropomorphic phantom [Fig. 7a] was made of silicone and placed on a torso phantom at the correct clinical position while irradiating with 120 × 80 mm2, 6MV x-ray beam, at an incident angle of 80° (10° upward with respect to the horizontal plane). The ICCD camera was placed at the foot of the patient couch, at the same height of the breast phantom and about 3.25 m away. Three positions of the side surface (entrance, exit, and tangential) were imaged. Images were taken with ambient light on and off to validate that most of the ambient light can be rejected by the time domain gating technique.
Figure 7.

(a) A picture of the breast phantom placed on an anthropomorphic torso phantom (entrance, tangential, and exit imaging region indicated in the picture). (b) A picture shows the ambient light tested for time domain gating. (c)–(e) Čerenkov images (ambient light off) of the entrance, tangential, and exit region of the breast phantom under whole breast radiotherapy. (f) Čerenkov image of the exit region with ambient light on.
RESULTS
Validation of local Čerenkov emission as surrogate of radiation dose
Flat phantom
Figure 1 shows the results of the energy spectra of charged particles and validation of local Čerenkov emission as a surrogate of radiation dose for 100 × 100 mm2, 6 MV gamma beam. Figures 1b, 1c show the simulated energy spectra of charged particles at different regions [indicated in Fig. 1a] on the entrance and exit planes. The spatial homogeneity of these spectra suggests local Čerenkov emission can be used as a surrogate of radiation dose within small discrepancy. Comparing Fig. 1b with Fig. 1c, the energy spectra of charged particles is more spatially homogeneous on the entrance plane than that on the exit plane, suggesting that the discrepancy between local Čerenkov emission and radiation dose should be smaller on the entrance plane. To quantify the spatial homogeneity of energy spectra of charged particles, the absolute average discrepancy (mean value of the absolute difference between two self-normalized energy spectra by the maximum to the range of [0, 1]) of the energy spectra of charged particles simulated at position 1–9 [Fig. 1a] were calculated with respect to the spectra simulated at position 1 (center of the beam field) and listed in Table 1 for field sizes of 20 × 20, 40 × 40, 100 × 100, and 200 × 200 mm2, showing a trend of increasing with field size. Figures 1d, 1e show the simulated images of superficial dose and local Čerenkov emission for entrance plane. CP and IP profiles were shown in Fig. 1f. Figure 1g shows the discrepancies between these profiles. Figures 1h, 1i, 1j, 1k show the same results for the exit plane. The maximum and absolute average discrepancies between local Čerenkov emission and radiation dose were calculated and listed in Table 1 for CP and IP profiles on entrance and exit plane for field sizes of 20 × 20, 40 × 40, 100 × 100, and 200 × 200 mm2. With largest discrepancy within 5% at the edges of the beam field and absolute average discrepancy within 2%, the discrepancy shows a trend of increasing with field size. Agreeing with the results of the energy spectra of charged particles, the average discrepancy for entrance plane is generally smaller than that of the exit plane.
Table 1.
Validation of Čerenkov radiation as surrogate of radiation dose.
| Energy spectrum of charged particles: Flat phantom | ||||
|---|---|---|---|---|
| 20 × 20 | 40 × 40 | 100 × 100 | 200 × 200 | |
| Field size (mm2) |
(positions 1–9) |
(positions 1–9) |
(positions 1–9) |
(positions 1–9) |
| Discrepancy at entrance plane (%) with respect to data of position 1 | 0, 0.3, 0.2, 0.2, 0.1, 0.6, 0.2, 0.3, 0.3 | 0, 0.8, 0.5, 0.5, 0.5, 0.4, 1.0, 0.6, 0.5 | 0, 0.5, 0.9, 0.5, 0.3, 0.6, 1.6, 0.4, 0.6 | 0, 1.8, 2.0, 1.4, 1.3, 1.8, 2.4, 1.4, 1.1 |
| Discrepancy at exit plane (%) with respect to data of position 1 | 0, 0.2, 0.3, 0.2, 0.4, 0.4, 0.8, 0.3, 0.9 | 0, 0.1, 0.7, 0.1, 0.6, 0.3, 1.9, 0.1, 1.5 | 0, 0.5, 1.5, 0.3, 1.4, 0.3, 2.3, 0.4, 3.1 | 0, 0.6, 1.4, 0.7, 2.3, 1.2, 4.3, 1.0, 3.6 |
| Energy spectrum of charged particles: Flat phantom | ||||
| Discrepancy (%) at entrance plane (0°–90° with | Discrepancy (%) at exit plane (90°–180° with increment of 15°) | |||
| increment of 15°) with respect to data simulated at 0° |
with increment of 15°) with respect to data simulated at 180° |
|||
| 0, 0.7, 0.9, 3.7, 2.4, 1.0, 14.7 | 12.8, 5.7, 4.7, 2.6, 1.0, 0.3, 0 | |||
| Local Čerenkov emission intensity and radiation dose: Flat phantom | ||||
| CP1: Entrance plane | CP: Exit plane | IP2: Entrance plane | IP: Exit plane | |
| Field size (mm2) |
(%) |
(%) |
(%) |
(%) |
| 20 × 20 | 0.6 (−1.1, +0.7) | 1.1 (−1.9, +1.0) | 0.6 (−1.8, +1.0) | 0.9 (−1.7, +1.1) |
| 40 × 40 | 0.6 (−2.2, +1.1) | 1.1 (−2.5, +0.5) | 0.6 (−1.4, +0.6) | 1.3 (−2.6, +0.4) |
| 100 × 100 | 0.9 (−2.5, +1.2) | 1.4 (−4.0, +1.0) | 0.8 (−2.5, +0.9) | 1.3 (−3.6, +1.5) |
| 200 × 200 | 1.3 (−4.6, +1.8) | 1.8 (−4.9, +1.0) | 1.3 (−4.5, +2.6) | 1.4 (−4.7, +3.7) |
| Local Čerenkov emission intensity and radiation dose: Cylindrical phantom (Diameter and Height = 83 mm) | ||||
| Discrepancy (%) at entrance plane (0°–90°) | Discrepancy (%) at entrance plane (90°–180°) | |||
| 1.5 (−3.4, +1.1) | 1.9 (−4.5, +2.0) | |||
CP is short for cross plane.
IP is short for inter plane.
Cylindrical phantom
As shown in Fig. 2b, based on the similarity shared with each other, the energy spectra along the central arc on the surfaces of the cylindrical phantom can be divided into two groups [entrance plane (0°–90°) and exit plane (90°–180°)], suggesting that local Čerenkov emission could be taken as surrogate of radiation dose for both entrance and exit plane independently. The absolute average discrepancies of the self-normalized energy spectra of charged particles (with respect to data measured at 0° for entrance plane and 180° for exit plane) were listed in Table 1. Figures 2c, 2d show the simulated images of radiation dose and local Čerenkov emission of the central transection. In Figs. 2e, 2g, profiles of radiation dose and local Čerenkov radiation are self-normalized by the maximum to the range of [0, 1] for entrance and exit planes. The corresponding discrepancies were shown in Figs. 2f, 2h with the largest and absolute average discrepancies listed in Table 1.
Sampling region in layered skin models
The sampling depth distribution of Čerenkov photons and corresponding exponential fitting for average emission depth of origin on the entrance plane is shown in Fig. 3a, for the three types of increasing skin pigment. Figure 3b shows the spectra of Čerenkov emission on the entrance plane, with the predominant emissions in the red and infrared wavelengths, and increasing overall emission for decreasing skin pigment, as might be expected. Effective sampling depths for different wavelength ranges [400–900 nm (overall), 400–500, 500–600, 600–700, 700–800, and 800–900 nm] are listed in Fig. 3c, illustrating that the sampling depth changes substantially with wavelength range. In fact, wavelength range changes affect the emission sensitivity depth by more than an order of magnitude, whereas skin pigment changes alter this value by less than a factor of 2. Similar results were shown in Fig. 4 for the exit plane. The build-up effect [Fig. 3a] is obvious for the entrance plane, which leads to larger sampling depth than that of the exit plane.
Figure 3.

(a) The sampling depth distribution of Čerenkov photons and corresponding exponential fitting for the three types of skin [skin 1: lightly pigmented skin (∼1% melanin in epidermis), skin 2: moderately pigmented (∼12% melanin in epidermis), skin 3: darkly pigmented (∼30% melanin in epidermis)] for entrance plane. (b) The spectra of Čerenkov emission from the entrance surface. (c) Effective sampling depth for different wavelength ranges on the entrance surface.
Figure 4.

(a) The sampling depth distribution of Čerenkov photons and corresponding exponential fitting for the three types of skin for exit plane. (b) The spectra of Čerenkov emission from the exit surface. (c) Effective sampling depth for different wavelength ranges on the exit surface.
Angular distributions of Čerenkov emission on the surfaces
Figure 5c shows the angular distribution of Čerenkov emission on the entrance surface for the three types of skin. All of the profiles look similar to the Lambertian distribution, while the discrepancy increases for increasing skin pigment. Figure 5d shows that the angular distribution is insensitive to incident angle, because of high scattering of Čerenkov photons in the tissue. As shown in Fig. 5f, if the layer of the tissue is too thin (<1 mm), which means Čerenkov photons will not be scattered enough, the angular distribution has a large discrepancy (Table 2) with respect to a Lambertian distribution. For a curved surface, Fig. 5e shows the angular distribution is close to a Lambertian distribution and not sensitive to the curvature. All the other conditions mentioned in Sec. 2D were investigated for the entrance and exit planes, and the absolute average discrepancy with respect to a Lambertian distribution is listed in Table 2. In most of the cases, the absolute average discrepancy varies around 5%, suggesting that a Lambertian distribution is usually a reasonable approximation for angular correction of Čerenkov images.
Tissue mimic phantom imaging with time domain gating system
Flat phantom imaging
To image enough Čerenkov photons, each frame of the image was measured by accumulating the Čerenkov emission from many radiation bursts delivered by the LINAC. Figure 6b shows the acquisition speed of the time domain gating system for a frame of image, with accumulations from 1 to 1000 radiation bursts. To increase the SNR of the Čerenkov image, several frames of images with the same accumulation were taken together as a stack and median filtered over it. After background subtraction, image transformation and image smoothing with bilateral filtering, each image was 1024 × 1024 pixels. Irradiating with 100 × 100 mm2, 6 MVX-ray beam, different acquisition procedures were investigated. A square region (100 × 100 pixels) in the center of images was chosen to calculate the SNR (mean pixel value over the standard variance). As shown in Fig. 6c, the SNR increases with the number of accumulations and the number of frames of images included in median filtering. For example, from Fig. 6b, an image of 50 accumulations takes about 0.21 s and from Fig. 6c, median filtering over 10 frames of images gives a SNR over 35, suggesting the possibility of real time or semireal time (depending on SNR) superficial dose monitoring. By setting the acquisition procedure to be 50 accumulation each frame of image and median filtering over a stack of 10 frames of images (about 2.1 s acquisition time), Čerenkov images of different field sizes (from 50 × 50 to 200 × 200 mm2) and incident angles (from 0° to 70° with field size to be 100 × 100 mm2) were shown in Figs. 6d, 6e.
Breast shaped phantom imaging
Figure 7 shows the Čerenkov images of the breast shaped phantom (described in Sec. 2E2) from different angles [entrance, tangential, and exit as indicated in Fig. 7a] during EBRT. The acquisition procedure was set to be 50 accumulations each frame of image and 10 frames of images for median filtering over the stack. Figures 7c, 7d, 7e validated Čerenkov emission could be imaged and thus superficial dose could be estimated for complex surface profiles within the process of EBRT. As shown in Figs. 7e, 7f, images of the exit plane measured with and without ambient light [Fig. 7b] were similar to each other, suggesting imaging with reasonable level of ambient light during EBRT is possible. There was a slight offset shown between them, which is suitably smaller than the dynamic range, and so can be subtracted off as needed in postprocessing.
DISCUSSION
Čerenkov radiation is intrinsically generated in tissue during irradiation. Different from conventional superficial dose measurement techniques, superficial dosimetry imaging based on Čerenkov radiation does not require any detector to be placed on patient or any clinical intervention within the process of EBRT. Instead of small region measurement, this technique is able to image a large field of view or focus on the region of interest, which provides global as well as detailed information about superficial dose distribution. As shown in Figs. 6b, 6c, the acquisition time of images with reasonably good quality and SNR (about 35) is approximately 2 s. Comparing this to the time scale of typical radiotherapy (about 10–20 s at dose rate of 600 MU/min), real time monitoring of patient movement, deformation and the corresponding effects to superficial dose delivery is possible. Instead of correlating Čerenkov images to superficial dose distribution, this technique could also be used for quality assurance of the radiotherapy beam for hot or cold spot detection.
Although Čerenkov imaging has shown certain advantages for superficial dose assessment, several important issues exist which needs to be clarified. First, local intensity of Čerenkov radiation is proportional to radiation dose under the approximation that energy spectra of charged particles is spatially independent. This approximation was validated with maximum discrepancy within 5% and average discrepancy within 2% (Fig. 1 and Table 1) for flat phantom with different field sizes from 20 × 20 to 200 × 200 mm2. For curved phantoms, as shown in Fig. 2 and Table 1, this approximation holds for most of entrance and exit plane and has the largest discrepancy (within 15%) near the tangential region, which means that Čerenkov images of entrance and exit regions should be interpreted independently. It is worth noting that the images could under- or overestimate radiation dose several percent, especially near the edge of the beam field or in tangential regions. Calibration of this issue requires detailed information about energy spectra of charged particles at different regions, which is potentially possible but computationally intense. In practice, the easiest solution is that regions such as beam edges and tangential surfaces with respect to the direction of the incident radiation beam could be eliminated from the image, or interpreted with caution for superficial dose estimation.
Unlike conventional superficial dose measurement techniques, Čerenkov emission samples the superficial dose several millimeters (0–5 mm) underneath the surfaces with the sampling region being sensitive to the optical properties [Figs. 3a, 4a]. The detected Čerenkov intensity is also correlated to optical properties [Figs. 3b, 4b]. One potential way to solve this issue is including noninvasive optical properties techniques such as reflectance spectroscopy46 to measure optical properties of the skin accurately and adopted for sampling region simulating, sampling depth tuning by spectral filtering [Figs. 3c, 4c] and Čerenkov intensity to absolute dose calibration. This will be investigated in following clinical studies focusing on whole breast treatment and correlate the Čerenkov images to superficial dose and skin reactions for different types of skin.
For complex surface profiles (breast or head and neck tumor treatment), the angular correction of Čerenkov images is important. For highly scattering media such as human tissue, optical photons could be scattered sufficiently and lose their initial angular distributions. As summarized in Table 2 for flat and curved tissue mimic phantom, the angular distribution of emission is close to the theoretical Lambertian distribution for perfect scattering medium. Lambertian distributions essentially simplify the angular correction to a trivial monotonic function with a known analytic expression, which is especially important for complex curved surfaces, because the intensity changes due to the curvature of the surfaces will be exactly compensated by the corresponding changes of the solid angle. The results in this study suggest that Lambertian correction would be a reasonably good normalization factor to correct the emission intensity. While complete angular correction is a challenge because angular distributions is affected slightly by the surfaces profiles combined with all the potential factors, many of these issues can be potentially addressed by 3D surface capture techniques47 and systems (e.g., AlignRT®, Vision RT; Catalyst™, C-Rad). In the following clinical trial of whole breast radiotherapy, combining 3D surface profiles with the treatment plan of radiation delivery and measured optical properties of patient skin will be investigated. By coupling 3D surface profiles and measurements of optical properties with Čerenkov images, factors such as curvatures of the surfaces, incident angles, and optical properties could be decided for the treatment region and adopted to simulate the angular distribution, which will be later used for intensity corrections due to viewing angles and curvatures.
In practice, a reasonable level of ambient lighting is essential for the patient's comfort and for the radiation therapy technicians to do their job. This ambient light could easily affect Čerenkov images if imaging with standard cameras. To solve this problem, time-gating of image acquisition was demonstrated in this study. By synchronizing the camera to short radiation bursts (3 μs at a repetitive frequency about 180 Hz), ambient light which is generally continuous in time will be reduced to less than 5% of the signal. As shown in Figs. 7e, 7f, with the ambient light level to be what shows in Fig. 7b, the Čerenkov images are not significantly affected. Further improvement will be implemented by coding the camera to take background images during the gating, while radiation burst is just off and subtract the background image from Čerenkov image automatically.
CONCLUSION
We have shown that local Čerenkov emission can be used to estimate radiation dose for flat and curved surfaces. Simulation of the sampling region of Čerenkov emission in layered skin models suggested the possibility of sampling depth tuning based on spectral filtering. Angular distributions of Čerenkov photons escaping the surfaces are close to the well-known Lambertian distribution, because of the tissue's high optical scattering, simplifying the angular correction of Čerenkov image for flat and curved surfaces. The concept of superficial dose imaging based on Čerenkov emission for MV EBRT x-ray beams was demonstrated in breast phantoms by time domain gating, suggesting real time superficial dose monitoring with reasonable ambient light level. While this work focuses on Monte Carlo simulations and phantom studies, it is clear that this signal is emitted from all tissue, and in vivo superficial dosimetry via quantitative imaging will be investigated with further development in a whole breast radiotherapy clinical trial.
ACKNOWLEDGMENTS
This work has been funded in part by the Norris Cotton Cancer Center Developmental Pilot Project Funds, and by the NIH Grant No. R01CA109544.
References
- Habibollahi F., Mayles H. M., Mayles W. P., Winter P. J., Tong D., Fentiman I. S., Chaudary M. A., and Hayward J. L., “Assessment of skin dose and its relation to cosmesis in the conservative treatment of early breast cancer,” Int. J. Radiat. Oncol., Biol., Phys. 14, 291–296 (1988). 10.1016/0360-3016(88)90435-X [DOI] [PubMed] [Google Scholar]
- Thomas S. J. and Hoole A. C., “The effect of optimization on surface dose in intensity modulated radiotherapy (IMRT),” Phys. Med. Biol. 49, 4919–4928 (2004). 10.1088/0031-9155/49/21/005 [DOI] [PubMed] [Google Scholar]
- Shiau A. C., Lai P. L., Liang J. A., Shueng P. W., Chen W. L., and Kuan W. P., “Dosimetric verification of surface and superficial doses for head and neck IMRT with different PTV shrinkage margins,” Med. Phys. 38, 1435–1443 (2011). 10.1118/1.3553406 [DOI] [PubMed] [Google Scholar]
- Shiau A. C., Chiu M. C., Chen T. H., Chiou J. F., Shueng P. W., Chen S. W., Chen W. L., and Kuan W. P., “Surface and superficial dose dosimetric verification for postmastectomy radiotherapy,” Med. Dosim. 37, 417–424 (2012). 10.1016/j.meddos.2012.03.005 [DOI] [PubMed] [Google Scholar]
- Court L. E., Tishler R., Xiang H., Allen A. M., Makrigiorgos M., and Chin L., “Experimental evaluation of the accuracy of skin dose calculation for a commercial treatment planning system,” J. Appl. Clin. Med. Phys. 9(1), 29–35 (2008). 10.1120/jacmp.v9i1.2792 [DOI] [PMC free article] [PubMed] [Google Scholar]
- Mutic S. and Low D. A., “Superficial doses from serial tomotherapy delivery,” Med. Phys. 27, 163–165 (2000). 10.1118/1.598880 [DOI] [PubMed] [Google Scholar]
- Qi Z. Y., Deng X. W., Huang S. M., Zhang L., He Z. C., Li X. A., Kwan I., Lerch M., Cutajar D., Metcalfe P., and Rosenfeld A., “In vivo verification of superficial dose for head and neck treatments using intensity-modulated techniques,” Med. Phys. 36, 59–70 (2009). 10.1118/1.3030951 [DOI] [PubMed] [Google Scholar]
- Bilge H., Ozbek N., Okutan M., Cakir A., and Acar H., “Surface dose and build-up region measurements with wedge filters for 6 and 18 MV photon beams,” Jpn. J. Radiol. 28, 110–116 (2010). 10.1007/s11604-009-0393-5 [DOI] [PubMed] [Google Scholar]
- Yadav G., Yadav R. S., and Kumar A., “Skin dose estimation for various beam modifiers and source-to-surface distances for 6MV photons,” J. Med. Phys. 34, 87–92 (2009). 10.4103/0971-6203.51935 [DOI] [PMC free article] [PubMed] [Google Scholar]
- Dogan N. and Glasgow G. P., “Surface and build-up region dosimetry for obliquely incident intensity modulated radiotherapy 6 MV x rays,” Med. Phys. 30, 3091–3096 (2003). 10.1118/1.1625116 [DOI] [PubMed] [Google Scholar]
- Gerbi B. J., Meigooni A. S., and Khan F. M., “Dose buildup for obliquely incident photon beams,” Med. Phys. 14, 393–399 (1987). 10.1118/1.596055 [DOI] [PubMed] [Google Scholar]
- Butson M. J., Perez M. D., Mathur J. N., and Metcalfe P. E., “6MV x-ray dose in the build up region: Empirical model and the incident angle effect,” Australas. Phys. Eng. Sci. Med. 19(2), 74–82 (1996). [PubMed] [Google Scholar]
- Butson M. J., Cheung T., and Yu P. K., “Variations in 6MV x-ray radiotherapy build-up dose with treatment distance,” Australas. Phys. Eng. Sci. Med. 26(2), 88–90 (2003). [PubMed] [Google Scholar]
- Chung H., Jin H., Dempsey J. F., Liu C., Palta J., Suh T. S., and Kim S., “Evaluation of surface and build-up region dose for intensity-modulated radiation therapy in head and neck cancer,” Med. Phys. 32, 2682–2689 (2005). 10.1118/1.1992067 [DOI] [PubMed] [Google Scholar]
- Quach K. Y., Morales J., Butson M. J., Rosenfeld A. B., and Metcalfe P. E., “Measurement of radiotherapy x-ray skin dose on a chest wall phantom,” Med. Phys. 27, 1676–1680 (2000). 10.1118/1.599035 [DOI] [PubMed] [Google Scholar]
- Devic S., Seuntjens J., Abdel-Rahman W., Evans M., Olivares M., Podgorsak E. B., Vuong T., and Soares C. G., “Accurate skin dose measurements using radiochromic film in clinical applications,” Med. Phys. 33, 1116–1124 (2006). 10.1118/1.2179169 [DOI] [PubMed] [Google Scholar]
- Nakano M., Hill R. F., Whitaker M., Kim J. H., Kuncic Z., “A study of surface dosimetry for breast cancer radiotherapy treatments using Gafchromic EBT2 film,” J. Appl. Clin. Med. Phys. 13(3), 83–97 (2012). [DOI] [PMC free article] [PubMed] [Google Scholar]
- Roberson P. L., Moran J. M., and Kulasekere R., “Radiographic film dosimetry for IMRT fields in the nearsurface buildup region,” J. Appl. Clin. Med. Phys. 9(4), 87–97 (2008). 10.1120/jacmp.v9i4.2782 [DOI] [PMC free article] [PubMed] [Google Scholar]
- Butson M. J., Cheung T., Yu P. K., and Currie M., “Surface dose extrapolation measurements with radiographic film,” Phys. Med. Biol. 49, N197–N201 (2004). 10.1088/0031-9155/49/13/N03 [DOI] [PubMed] [Google Scholar]
- Chiu-Tsao S. T. and Chan M. F., “Photon beam dosimetry in the superficial buildup region using radiochromic EBT film stack,” Med. Phys. 36, 2074–2083 (2009). 10.1118/1.3125134 [DOI] [PMC free article] [PubMed] [Google Scholar]
- Kron T. and Ostwald P., “Skin exit dose in megavoltage x-ray beams determined by means of a plane parallel ionization chamber (Attix chamber),” Med. Phys. 22, 577–578 (1995). 10.1118/1.597544 [DOI] [PubMed] [Google Scholar]
- Xiang H. F., Song J. S., Chin D. W. H., Cormack R. A., Tishler R. B., Makrigiorgos G. M., Court L. E., and Chin L. M., “Build-up and surface dose measurements on phantoms using micro-MOSFET in 6 and 10 MV x-ray beams and comparisons with Monte Carlo calculations,” Med. Phys. 34, 1266–1273 (2007). 10.1118/1.2710951 [DOI] [PubMed] [Google Scholar]
- Gladstone D. J. and Chin L. M., “Real-time, in vivo measurement of radiation dose during radioimmunotherapy in mice using a miniature MOSFET dosimeter probe,” Radiat. Res. 141, 330–335 (1995). 10.2307/3579012 [DOI] [PubMed] [Google Scholar]
- Gladstone D. J., Lu X. Q., Humm J. L., Bowman H. F., and Chin L. M., “A miniature MOSFET radiation dosimeter probe,” Med. Phys. 21, 1721–1728 (1994). 10.1118/1.597214 [DOI] [PubMed] [Google Scholar]
- Kron T., Butson M., Hunt F., and Denham J., “TLD extrapolation for skin dose determination in vivo,” Radiother. Oncol. 41, 119–123 (1996). 10.1016/S0167-8140(96)01795-1 [DOI] [PubMed] [Google Scholar]
- Kron T., Elliot A., Wong T., Showell G., Clubb B., and Metcalfe P., “X-ray surface dose measurements using TLD extrapolation,” Med. Phys. 20, 703–711 (1993). 10.1118/1.597019 [DOI] [PubMed] [Google Scholar]
- Lin J. P., Chu T. C., Lin S. Y., and Liu M. T., “Skin dose measurement by using ultra-thin TLDs,” Appl. Radiat. Isot. 55, 383–391 (2001). 10.1016/S0969-8043(01)00082-3 [DOI] [PubMed] [Google Scholar]
- Cherenkov P. A., “The spectrum of visible radiation produced by fast electrons,” Comptes Rendus De L Academie Des Sciences De L Urss 20, 651–655 (1938). [Google Scholar]
- Jelley J. V., “Cerenkov radiation and its applications,” Br. J. Appl. Phys. 6, 227–232 (1955). 10.1088/0508-3443/6/7/301 [DOI] [Google Scholar]
- Axelsson J., Davis S. C., Gladstone D. J., and Pogue B. W., “Cerenkov emission induced by external beam radiation stimulates molecular fluorescence,” Med. Phys. 38, 4127–4132 (2011). 10.1118/1.3592646 [DOI] [PMC free article] [PubMed] [Google Scholar]
- Zhang R., Glaser A., Esipova T. V., Kanick S. C., Davis S. C., Vinogradov S., Gladstone D., and Pogue B. W., “Cerenkov radiation emission and excited luminescence (CREL) sensitivity during external beam radiation therapy: Monte Carlo and tissue oxygenation phantom studies,” Biomed. Opt. Express 3, 2381–2394 (2012). 10.1364/BOE.3.002381 [DOI] [PMC free article] [PubMed] [Google Scholar]
- Zhang R., Davis S. C., Demers J., Glaser A., Gladstone D., Vinogradov S., and Pogue B. W., “Oxygen tomography by Cerenkov-excited phosphorescence during external beam irradiation,” J. Biomed. Opt. 18(5), 50503 (2013). 10.1117/1.JBO.18.5.050503 [DOI] [PMC free article] [PubMed] [Google Scholar]
- Axelsson J., Glaser A. K., Gladstone D. J., and Pogue B. W., “Quantitative Cherenkov emission spectroscopy for tissue oxygenation assessment,” Opt. Express 20, 5133–5142 (2012). 10.1364/OE.20.005133 [DOI] [PMC free article] [PubMed] [Google Scholar]
- Glaser A. K., Davis S. C., McClatchy D. M., Zhang R. X., Pogue B. W., and Gladstone D. J., “Projection imaging of photon beams by the Cerenkov effect,” Med. Phys. 40, 012101 (14pp.) (2013). 10.1118/1.4770286 [DOI] [PMC free article] [PubMed] [Google Scholar]
- Glaser A., Voigt W., Davis S. C., Zhang R., Gladstone D., and Pogue B. W., “Three-dimensional Čerenkov tomography of energy deposition from ionizing radiation beams,” Opt. Lett. 38, 634–636 (2013). 10.1364/OL.38.000634 [DOI] [PMC free article] [PubMed] [Google Scholar]
- Glaser A., Davis S. C., Voigt W., Zhang R., Pogue B. W., and Gladstone D., “Projection imaging of photon beams using Čerenkov-excited fluorescence,” Physics in Medicine and Biology 58(3), 601–619 (2013). 10.1088/0031-9155/58/3/601 [DOI] [PMC free article] [PubMed] [Google Scholar]
- See http://physics.nist.gov/PhysRefData/Star/Text/ESTAR.html for ESTAR.
- Glaser A. K., Zhang R., Davis S. C., Gladstone D. J., and Pogue B. W., “Time-gated Cherenkov emission spectroscopy from linear accelerator irradiation of tissue phantoms,” Opt. Lett. 37, 1193–1195 (2012). 10.1364/OL.37.001193 [DOI] [PMC free article] [PubMed] [Google Scholar]
- Arce P., Mendes P. R., and Lagares J. I., “GAMOS: A Geant4-based easy and flexible framework for nuclear medicine applications,” Nuclear Science Symposium Conference Record (IEEE; 2008), pp. 3162–3168.
- Glaser A. K., Kanick S. C., Zhang R., Arce P., and Pogue B. W., “A GAMOS plug-in for GEANT4 based Monte Carlo simulation of radiation-induced light transport in biological media,” Biomed. Opt. Express 4, 741–759 (2013). 10.1364/BOE.4.000741 [DOI] [PMC free article] [PubMed] [Google Scholar]
- See http://www-nds.iaea.org/phsp/phsp.htmlx for phase-space database for external beam radiotherapy.
- Gunturk B. K., “Fast bilateral filter with arbitrary range and domain kernels,” IEEE Trans. Image Process. 20, 2690–2696 (2011). 10.1109/TIP.2011.2126585 [DOI] [PubMed] [Google Scholar]
- Meglinski I. V. and Matcher S. J., “Quantitative assessment of skin layers absorption and skin reflectance spectra simulation in the visible and near-infrared spectral regions,” Physiol. Meas. 23, 741–753 (2002). 10.1088/0967-3334/23/4/312 [DOI] [PubMed] [Google Scholar]
- Zhang R., Fox C. J., Glaser A. K., Gladstone D. J., and Pogue B. W., “Superficial dosimetry imaging of Cerenkov emission in electron beam radiotherapy of phantoms,” Phys. Med. Biol. 58, 5477–5493 (2013). 10.1088/0031-9155/58/16/5477 [DOI] [PMC free article] [PubMed] [Google Scholar]
- Archambault L., Briere T. M., and Beddar S., “Transient noise characterization and filtration in CCD cameras exposed to stray radiation from a medical linear accelerator,” Med. Phys. 35, 4342–4351 (2008). 10.1118/1.2975147 [DOI] [PMC free article] [PubMed] [Google Scholar]
- Vishwanath K., Chang K., Klein D., Deng Y. F., Chang V., Phelps J. E., and Ramanujam N., “Portable, fiber-based, diffuse reflection spectroscopy (DRS) systems for estimating tissue optical properties,” Appl. Spectrosc. 65, 206–215 (2011). 10.1366/10-06052 [DOI] [PMC free article] [PubMed] [Google Scholar]
- Geng J., “Structured-light 3D surface imaging: A tutorial,” Adv. Opt. Photon. 3, 128–160 (2011). 10.1364/AOP.3.000128 [DOI] [Google Scholar]