

Abstract
We present a technique for quantifying global cerebral metabolic rate of oxygen consumption (CMRO2) in absolute physiologic units at 3-second temporal resolution and apply the technique to quantify the dynamic CMRO2 response to volitional apnea. Temporal resolution of 3 seconds was achieved via a combination of view sharing and superior sagittal sinus-based estimation of total cerebral blood flow (tCBF) rather than tCBF measurement in the neck arteries. These modifications were first validated in three healthy adults and demonstrated to produce minimal errors in image-derived blood flow and venous oxygen saturation (SvO2) values. The technique was then applied in 10 healthy adults during an apnea paradigm of three repeated 30-second breath-holds. Subject-averaged baseline tCBF, arteriovenous oxygen difference (AVO2D), and CMRO2 were 48.6±7.0 mL/100 g per minute, 29.4±3.4 %HbO2, and 125.1±11.4 μmol/100 g per minute, respectively. Subject-averaged maximum changes in tCBF and AVO2D were 43.5±9.4% and −32.1±5.7%, respectively, resulting in a small (6.0±3.5%) but statistically significant (P=0.00044, two-tailed t-test) increase in average end-apneic CMRO2. This method could be used to investigate neurometabolic–hemodynamic relationships in normal physiology, to better define the biophysical origins of the BOLD signal, and to quantify neurometabolic responsiveness in diseases of altered neurovascular reactivity.
Keywords: cerebral blood flow, energy metabolism, magnetic resonance, MRI, neurovascular coupling
Introduction
Because cerebral metabolism is almost entirely oxidative, continuous O2 delivery to the brain is critical and tightly regulated. The cerebral metabolic rate of oxygen consumption (CMRO2), defined as the brain oxygen consumption rate per unit tissue mass, is a direct measure of oxidative metabolism, in contrast to indirect measures such as perfusion or blood-oxygen-level-dependent (BOLD) magnetic resonance (MR) imaging signal. Therefore, CMRO2 is an ideal parameter for investigating relationships between neuronal activity, blood flow, and cerebral metabolism in normal physiology and diseases of cerebrometabolic dysfunction. In fact, alterations in cerebral oxygen metabolism are associated with many of the most common neurologic disorders, including Alzheimer's, Parkinson's, Huntington's, and multiple sclerosis.1, 2, 3, 4
In recent years, significant progress has been made toward non-invasive MR-based methods for absolute CMRO2 quantification. Much attention has focused on developing methods to quantify CMRO2 absolutely (in physiologic units) and on a voxel-wise basis. Such voxel-wise methods model the effect of deoxygenated hemoglobin on either brain tissue T2′ (ref. 5), T2 (ref. 6), or BOLD signal7 to quantify the voxel-wise venous oxygen saturation (SvO2), which can be combined with arterial spin labeling cerebral blood flow (CBF) measurement to yield CMRO2. In contrast, methods that quantify oxygen extraction globally model the effect of deoxygenated hemoglobin on the intravascular T2 (refs 8, 9) or MR signal phase10, 11 of large veins to quantify intravascular SvO2, which combined with phase-contrast MR-based quantification of CBF yields CMRO2. Although these intravascular methods lack the ability to measure local changes in oxygen metabolism, many physiologic states and neurologic disorders are global in nature, and therefore assessable via measurement of global CMRO2. Furthermore, voxel-wise CMRO2 techniques require many minutes for each CMRO2 measurement and therefore cannot quantify changes in response to dynamic physiologic challenges or neurologic stimuli. By sacrificing spatial specificity, intravascular methods enable CMRO2 quantification in clinically feasible scan times and at much higher temporal resolutions, seconds rather than minutes, in comparison to voxel-wise approaches.
Based on the long paramagnetic cylinder model,12, 13 MR susceptometry-based oximetry is a simple and robust method for intravascular CMRO2 quantification. Unlike T2 relaxation-based methods for quantifying intravascular SvO2, the paramagnetic cylinder model approach does not require prior calibration to specific scanners, sequences, or blood hemoglobin (Hb) or hematocrit (Hct) values (Hb and Hct are input parameters theoretically included in the model). It also has equal accuracy and precision across all SvO2 values and is scalable with field strength. These features make the model suitable for application to a variety of clinical populations and experimental conditions, including longitudinal and multi-center studies. The simplicity of this approach also enables rapid CMRO2 quantification in response to stimuli. For example, in a recent work by some of the authors,14 CMRO2 was measured at 25-second temporal resolution in response to hypercapnia by application of a susceptometry-based oximetry method and found to be constant during hypercapnic steady state. Though 25-second temporal resolution represents a drastic improvement over previous approaches, changes in cerebral oxygen supply and demand take place on the order of seconds, and thus require yet improved temporal resolution to be fully resolved. Calibrated BOLD-based methods can assess relative CMRO2 changes in seconds,15 however, such methods cannot quantify CMRO2 in absolute physiologic units. Furthermore, these BOLD-based methods require calibration via gas mixture breathing, complicating application to human subjects, and are based on the assumption that the response to such gases is isometabolic, itself a topic of debate.16
Higher temporal resolution CMRO2 quantification would provide valuable insights into global neuronal activity during various dynamic stimuli. For instance, it could be applied to validate whether aforementioned gas mixture breathing stimuli used in calibrating the BOLD functional magnetic resonance imaging (fMRI) signal, including hypercapnic17 and hyperoxic18 gas mixture breathing as well as breath-hold,19 are in fact isometabolic and over what time frame (i.e., whether a delay exists in reaching an isometabolic steady state). Validating these assumptions is critical given the extensive use of fMRI in biomedical research and the growing interest in making BOLD fMRI more quantitative. Further, applying the dynamic CMRO2 method to neural activation tasks could help elucidate the biophysical mechanisms underlying the BOLD response, including the relative CMRO2 contribution to the BOLD poststimulus undershoot, a topic of significant contention.20
Breath-hold apnea is another important area of investigation where high temporal resolution CMRO2 measurement is essential. Apnea is involved in a number of important diseases, such as asthma, chronic obstructive pulmonary diseases, and obstructive sleep apnea (OSA). The normal physiologic response to apnea maintains cerebral oxygen delivery via reduced cardiac output, peripheral vasoconstriction, and cerebral vasodilation.21 However, it has been suggested that in OSA, the repeated nocturnal apneic events caused by upper airway mechanical failure may result in blunting of this normal response,22, 23, 24 potentially explaining the extensive neurologic pathology associated with the disease. Exploration of this hypothesis requires better methods for quantifying the cerebrometabolic apneic response. While non-MR methods such as Doppler ultrasound23 or near infrared spectroscopy24 have been applied to study the neurometabolic response to apnea in subjects with OSA, these techniques measure changes in either CBF or tissue O2 saturation, but not the CMRO2, which requires simultaneous quantification of CBF and tissue oxygen extraction. CMRO2 is maintained across healthy subjects both at baseline10 and in response to certain physiologic stimuli such as hypercapnia,14 suggesting that it is a more significant index for assessing neurovascular dysfunction than either blood flow or oxygenation alone. Developing methods to better assess the normal CMRO2 response to apnea and its potential alteration in OSA could improve understanding of OSA-associated neuropathology and provide insight into OSA treatment.
In this paper, we present and validate a method for dynamic CMRO2 quantification with 3-second temporal resolution, which extends the susceptometry-based oximetry approach previously described.10 This temporal resolution is achieved by using view sharing to reduce the number of phase-encode lines by four-fold and by combining the SvO2 and flow quantification portions of the pulse sequence. After validating the assumptions inherent in these temporal resolution improving measures, the technique was applied to a cohort of ten healthy individuals during a volitional apnea paradigm, both to demonstrate the method's sensitivity and characterize the normal apneic CMRO2 response.
Materials and Methods
Principles of Susceptometry-Based Global Cerebral Metabolic Rate of Oxygen Consumption Quantification
The cerebral metabolic rate of oxygen is estimated by combining venous and arterial oxygen saturation and total cerebral blood flow (tCBF) measurements using Fick's principle,25
 |
where CMRO2 is the cerebral metabolic rate of oxygen consumption in μmol per minute per 100 g brain tissue, tCBF the total cerebral blood flow in mL per 100 g brain tissue per minute, SaO2 and SvO2 the percent hemoglobin saturation of the intravascular arterial and venous blood, respectively, and CaO2 the arterial oxygen content in μmol of O2 per 100 mL blood, a product of the measured Hb concentration and the theoretical O2 carrying capacity of Hb. The CaO2 is calculated from the ideal gas law using a venipuncture-derived Hb value and assuming an O2 carrying capacity of 1.39 mL of O2 per gram of Hb.26 SaO2 is measured continuously with a digital pulse oximeter. This leaves SvO2 and tCBF to be quantified from the MR imaging experiment.
Magnetic resonance-based blood oximetry is used to quantify SvO2. By modeling a large vessel of interest as a long paramagnetic cylinder and accounting for field cancelation due to the Lorentz sphere phenomenon,12, 13 the average field difference between blood and a surrounding reference tissue can be computed as
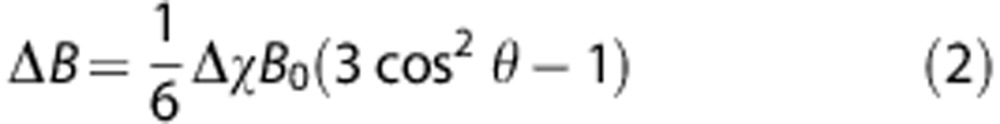 |
where Δχ is the volume magnetic susceptibility difference between blood and surrounding reference tissue and θ the tilt angle of the vessel relative to the main magnetic field (B0). For whole blood,
 |
where Hct is venipuncture-derived hematocrit Δχdo the volume susceptibility difference between fully deoxygenated and oxygenated erythrocytes, and Δχoxy the volume susceptibility difference between fully oxygenated erythrocytes and water. Values of 4π(0.273) and 4π(−0.008) p.p.m. (SI units) are used for Δχdo and Δχoxy, respectively, based on ex vivo calibration experiments.27, 28 Equations (2) and (3) suggest that deoxygenated blood will have an increased local magnetic field, causing an average phase difference of the MR signal relative to the surrounding tissue over a time ΔTE given by
 |
In the magnetic resonance imaging experiment, a multi-echo gradient-recalled echo is used to obtain a phase-difference map of the vessel and surrounding reference tissue with echo difference time ΔTE. Quadratic fitting is used to remove static field inhomogeneities that contribute to the phase accrual, Δφ, between intravascular blood and surrounding reference tissue.29 Combining equations (2), (3), (4) enables determination of SvO2 as a function of Δφ,
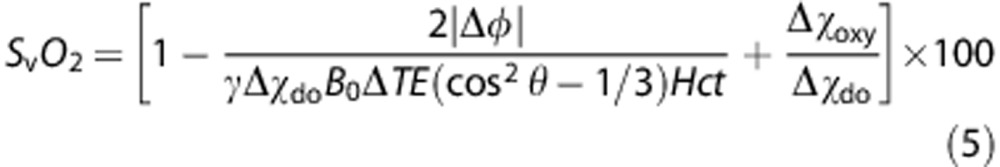 |
Because the superior sagittal sinus (SSS) is long, relatively straight, and virtually parallel to the B0 field with the subject lying supine, it is an excellent candidate for application of the long paramagnetic cylinder model. Application of the model to the SSS has been validated both theoretically30 and with anatomic phantom models.10 Furthermore, the SSS is the largest cerebral vein, and it has been shown that oxygen saturation levels in the SSS are comparable to global cerebral SvO2 levels measured in the internal jugular vein,8 making the SSS an appropriate surrogate for global cerebral SvO2. Direct susceptometry-based measurement of SvO2 in the internal jugular vein is difficult because of the often severe susceptibility artifacts caused by the proximity of air spaces such as the oral cavity and trachea.
Non-gated phase-contrast magnetic resonance imaging is used to quantify tCBF. The method utilizes motion-sensitizing gradient waveforms to encode information about velocity into the phase of the MR signal. Specifically, the pulse sequence involves two interleaves; both having null zeroth-gradient moment along the direction of blood flow but non-zero first-gradient moment. The latter determines the sensitivity of the accrued phase difference between the two interleaves, Δϕ, to the velocity of the flowing spins as
 |
where ΔM1 is the difference in the first moment between the two interleaves and is dictated by a user-defined parameter VENC, defined as
 |
VENC represents the velocity that causes a net phase accrual of π radians and therefore the maximum velocity that can be resolved without phase aliasing, and is typically chosen to be approximately 30% higher than the maximum velocity expected. Flow is quantified from velocity maps via multiplication of average vessel blood flow velocity by vessel cross-sectional area. To quantify CMRO2 per unit brain mass, flow must be normalized to total brain volume, which is quantified with a T1-weighted 3D magnetization-prepared rapid gradient-recalled-echo pulse sequence.31
In the previous work, these phase-based techniques for quantifying SvO2 and tCBF have been combined to quantify global CMRO2 at rest10 and during hypercapnic gas breathing.14 In this approach, SvO2 is measured in the SSS and tCBF measured simultaneously in the internal carotid and vertebral arteries of the neck using a two-slice-interleaved multi-echo gradient-recalled-echo sequence. Four interleaves are required for each phase encoding, two to generate susceptometry weighted phase-difference maps and two to generate velocity-encoded phase maps, resulting in a temporal resolution of 25 seconds.
Pulse Sequence Modifications for Improved Temporal Resolution
Modification of the susceptometry-based CMRO2 technique to achieve 3-second temporal resolution (Figure 1) was accomplished via two changes to the original approach:
Combining of sequence interleaves: rather than using two interleaves with different echo times to generate the SvO2 weighted phase-difference map, a multi-echo readout enables generation of a phase-difference map from data acquired in a single interleave. Any phase accrued owing to velocity encoding will equally affect both echoes of the multi-echo readout, as both echoes have the same polarity. Thus, the velocity and susceptometry interleaves can be combined. As a consequence of this modification, SSS blood flow (SSSBF) is quantified rather than tCBF from the neck arteries. However, tCBF can be accurately estimated by calibrating SSSBF based on the SSSBF:tCBF ratio measured at baseline with a two-slice-interleaved version of the sequence. This reference sequence (Figure 1A) is run immediately before starting the main (SSS-only) high temporal resolution CMRO2 sequence (Figure 1B), which is continued for the remainder of the scan. This modification yields a two-fold temporal resolution increase.
Keyhole reconstruction with reduced phase-encoding lines:32 The number of phase-encode lines in the main (SSS-only) CMRO2 sequence is reduced by a factor of 4 from 208 to 52, and the outer k-space is filled with data acquired from the same fully phase-encoded reference sequence used for calibrating SSSBF to tCBF (in Figures 1A and 1B, outer k-space data from echoes 1 and 2 is added to continuously update central k-space data from echoes 4 and 5). Unlike the main sequence, the reference sequence retains full-phase encoding to facilitate keyhole image reconstruction and allow higher fidelity quantification of the SSSBF:tCBF ratio. This modification yields a four-fold temporal resolution increase.
Figure 1.

High temporal resolution cerebral metabolic rate of oxygen consumption (CMRO2) quantification pulse sequence: (A) a two-slice-interleaved fully phase-encoded reference sequence is run immediately before (B) the single-slice main sequence with 4x phase-encode reduction; (C) experimental schematic illustrating relative timing of the reference and main sequence; (D) sagittal maximum intensity projection indicating slice locations corresponding to the pulse sequence diagram with magnitude images highlighting (E) the superior sagittal sinus (SSS) in the head slice and (F) the internal carotid arteries (ICAs) and vertebral arteries (VAs) in the neck slice.
The resultant pulse sequence (Figures 1A and 1B) has the following parameters: FOV=208 × 208 mm2 (head slice), 176 × 176 mm2 (neck slice); voxel size=1 × 1 × 5 mm3 (head slice), 0.85 × 0.85 × 5 mm3 (neck slice); TR/TE1/ΔTE=28.85/5.5/7.04 milliseconds; bandwidth=521 Hz/pixel; flip angle=15 degrees; VENC=60 cm/second (head), 80 cm/second (neck); temporal resolution=12 seconds (reference sequence), 3 seconds (main sequence). The modifications described combine to provide an eightfold improvement in temporal resolution without reducing theoretical signal-to-noise ratio. In fact, because two phase-difference maps are simultaneously generated at every time point (one for each flow encoding) and subsequently averaged, signal-to-noise ratio should theoretically improve by approximately  . The modifications described depend on several crucial assumptions that must be validated:
To determine tCBF from the SSSBF:tCBF ratio at baseline, the SSSBF:tCBF ratio must remain constant throughout the experiment. Because the SSS receives venous blood from most of the cortex, this assumption should be valid, especially during global physiologic challenges such as apnea or gas mixture breathing.
Keyhole reconstruction assumes that dynamic information is band-limited in k-space (i.e., image changes are low spatial-frequency processes). To satisfy this assumption, the diameter of any features of interest must be approximately greater than the keyhole reduction factor times the static resolution, or 4 mm for the 1-mm resolution and 4 × keyhole reduction factor used in the sequence described. The SSS is approximately 10 mm in diameter, and thus should fulfill this requirement.
Keyhole reconstruction assumes anatomic correspondence between the reference images and the main sequence images, and therefore requires that there be no movement over the course of the experiment. This is achievable at the level of the SSS, because it is easy to keep the head stationary in the MR scanner, even during a challenging paradigm such as volitional apnea.
In addition to improving temporal resolution, another motivation for velocity measurement in the SSS-only is that the neck vessels are more prone to movement, especially during physiologic paradigms such as apnea, violating assumption 3, and are also relatively smaller, violating assumption 2.
In Vivo Magnetic Resonance Imaging Studies
Human subject studies were approved by the Institutional Review Board of the University of Pennsylvania. Ten healthy volunteers (6 males, 4 females, ages 29±4 years) were recruited and participated after giving written informed consent. The subjects were judged to be healthy on the basis of their medical history. The particular population demographic was chosen to ensure maximal subject compliance to the physiologic paradigms. In all studies, images were acquired on a 3T Siemens Tim Trio system (Siemens Medical Solutions, Erlangen, Germany) using a 12-channel head coil and 2-channel neck coil. A vendor-provided gradient-recalled-echo axial localizer scan was used to select the location of the vessels of interest (SSS, internal carotid arteries, and vertebral arteries) and estimate θ, the tilt angle of the SSS with respect to B0, from the coordinates of the centroid of the vessel for quantification of SvO2 as in equation (5).
Validation of Critical Methodological Assumptions
Three of the volunteers (2 males, 1 female, ages 25±1 years) completed a tube-breathing paradigm involving three minutes of normal breathing baseline, three minutes of breathing through 10 feet of plastic tubing with an attached mouthpiece to induce changes in flow and SvO2, and three minutes of normal breathing recovery. Tube breathing was chosen in this validation study because it induces a mixed hypercapnic/hypoxic state, similar in nature to breath-hold but sustainable over a long enough duration to acquire multiple data points at both slice locations with full-phase encoding.33 The fully phase-encoded, two-slice-interleaved reference sequence was run during the entire paradigm, allowing quantification of the SSSBF:tCBF ratio over the course of the paradigm to test whether it remains constant during an apnea-like physiologic paradigm (assumption 1). Using full-phase encoding also allows comparison of SSSBF and SvO2 values obtained from retrospectively keyhole reconstructed data, where various amounts of outer k-space are replaced at each time point with the corresponding data from the first time point, as if only the central k-space had originally been acquired, as is the case when running the main sequence. This tests whether changes in parameter values are sufficiently band-limited in k-space to be accurately determined when using keyhole sampling and image reconstruction (assumption 2). Finally, because the paradigm requires both manipulation of the tube mouthpiece and significantly increased respiration, it challenges the subject's ability to remain static (assumption 3).
Quantification of Cerebral Metabolic Rate of Oxygen Consumption in Response to Apneic Challenge
Volunteers completed an apnea paradigm involving three repeated blocks of a 30-second normal breathing baseline period, a 30-second breath-hold apnea period, and a 90-second normal breathing recovery period. Before being scanned, subjects were instructed that all breath-holds should be completed at functional residual capacity, in other words, at normal end expiration. After running the reference sequence, the main sequence was run for the length of the 7.5-minute paradigm as in Figure 1C, allowing quantitation of SvO2 and tCBF at 3-second temporal resolution. SaO2 was measured continuously during the paradigm with a digital pulse oximeter placed on the right middle finger. Except in cases of abnormal cardiac anatomy, blood pumped to the brain and periphery originates from the same mixed pool in the left ventricle and therefore has the same SaO2. Thus, digital pulse oximetry will reflect cerebral SaO2. To correct for the known temporal delay in the measured SaO2 when using digital pulse oximetry, the SaO2 curve was shifted forward in time for each subject so that arterial resaturation occurs 7.5 seconds after cessation of breath-hold, matching the known circulatory transport delay between the lungs and brain34 to within the temporal resolution of the MR pulse sequence (3 seconds). Breath-hold at normal end expiration was chosen to keep breath-holds as consistent as possible across repeats and subjects, ensuring that inspiration would occur immediately at the end of the breath-hold period. Subjects were verbally coached during the imaging experiment to ‘breath in', ‘breath out', and ‘stop breathing' 6, 3, and 0 seconds before the start of each apnea period, respectively, to ensure exact timing of the breath-holds. All subjects were able to successfully complete each of the breath-holds as confirmed by direct observation and pulse oximetry data. After the breath-hold paradigm, a T1-weighted MP-RAGE image data set (voxel size=1 × 1 × 1 mm3) was acquired for normalization of tCBF to brain volume. Total brain volume was obtained using a semi-automated region-growing algorithm in ITK-SNAP.35 After completion of the MR imaging experiment, each subject gave a venous blood sample, which was sent for complete blood count laboratory analysis to obtain a blood Hb and Hct value.
Data Processing
In all experiments, binary masks were generated for the carotid and vertebral arteries and SSS by thresholding of complex difference images, which robustly isolates the signal from flowing blood. SvO2 was quantified in the SSS from equation (5) with Δφ equal to the average phase difference between the reference tissue and the SSS regions of interest. Flow was quantified in the neck arteries and SSS by multiplying average velocity by cross-sectional area for each corresponding vessel regions of interest, summing over the four neck arteries to get tCBF.
In the tube-breathing experiments, images were retrospectively keyhole reconstructed at keyhole reduction factors of 2, 4, 8, and 16 by discarding all but the central 104, 52, 26, or 13 lines of k-space, respectively, and replacing outer k-space with corresponding data from the first image of the data set. In the apnea paradigm experiments, corresponding data acquired from the reference sequence was used to fill missing outer k-space data from the main sequence run for the duration of the paradigm.
All time-course data from the apnea experiments was averaged over the three repeated blocks of the paradigm to remove physiologic noise not related to the paradigm and improve signal-to-noise ratio. Average baseline parameter values were quantified from the first 24 seconds (eight data points) of the baseline period to exclude breathing effects from the coached inspiration and expiration during the final 6 seconds (two data points) of the baseline period. Data from only the final 15 seconds (five data points) of the apnea period were used to generate end-apnea parameter values to eliminate residual breathing effects and because physiologic changes due to apnea are not expected to occur instantaneously.
Results
Tube breathing produced a similar response across the three subjects. Time-course plots of SvO2, tCBF, and SSSBF in a representative subject (Figure 2A) demonstrate the expected increase in flow and SvO2 caused by hypercapnia that develops during the tube-breathing portion of the paradigm. Coefficients of variation of the SSSBF:tCBF ratio (assumed to remain constant for a given subject to allow tCBF estimation from SSSBF) across all time points (N=45) were 0.094, 0.075, and 0.084 for the three subjects. The SSSBF:tCBF ratio for each subject averaged across the normal breathing baseline and recovery (30 data points) and tube-breathing (15 data points) portions of the paradigm is shown in Figure 2B. Welch's t-tests for equal means between these two groups of SSSBF:tCBF values yields non-significant P-values (>0.40) for all subjects.
Figure 2.

Superior sagittal sinus blood flow (SSSBF):total cerebral blood flow (tCBF) ratio: (A) time-course plot of venous oxygen saturation (SvO2), tCBF, and SSSBF in response to 3 minutes of tube breathing (gray bar); (B) histograms grouped by subject showing the SSSBF:tCBF ratio averaged over the baseline/recovery (N=30) and tube-breathing (N=15) portions of the paradigm with error bars indicating±1 s.d.
Figure 3 demonstrates the effects of keyhole reconstruction on the accuracy of derived parameters as observed from the tube-breathing experiment. In Figure 3A, time-course plots of SvO2 and SSSBF derived from images with full-phase encoding are compared with the same plots generated from images retrospectively keyhole reconstructed with a range of keyhole reduction factors. Note the greater errors when larger keyhole reduction factors are used. In Figure 3B, these errors are plotted versus number of phase-encode lines used in the keyhole reconstruction. Values are averaged over the tube-breathing portion of the paradigm only, where errors should be greatest as observed in Figure 3A. For the keyhole reduction factor of 4 used in the CMRO2 quantification sequence, mean error and root-mean-square error had magnitudes less than 0.04 for both SvO2 and SSSBF for all subjects.
Figure 3.

Error due to keyhole reconstruction: (A) Time-course plot of venous oxygen saturation (SvO2) and superior sagittal sinus blood flow (SSSBF) in response to tube breathing (gray bar) derived from images reconstructed with full-phase encoding (208 phase-encode lines) and with retrospective keyhole reconstruction using 104, 52, 26, or 13 phase-encode lines. (B) Mean error and root-mean-square (RMS) error in SvO2 and SSSBF during tube breathing using different numbers of phase-encode lines for retrospective keyhole reconstruction.
Figure 4 displays data from the apnea paradigm experiment in a typical subject. Changes in flow and SvO2 in response to apnea are visualized in the corresponding velocity and phase-difference maps (Figure 4A). Time-course plots of the measured parameters (Figures 4B and C) demonstrate an increase in SvO2 and tCBF and a decrease in SaO2 in response to apnea (gray bar). From these data, the arteriovenous oxygen saturation difference (AVO2D, equal to SaO2–SvO2) is quantified and plotted alongside the tCBF, the product of which yields CMRO2 (Figures 4D and E).
Figure 4.

Apnea paradigm representative subject data: (A) magnitude image with the superior sagittal sinus (SSS) outlined and corresponding velocity and phase-difference (Δφ) maps from specific time points (denoted by black symbols in B); (B) time-course plot of pulse oximetry measured arterial oxygen saturation (SaO2) and image-derived venous oxygen saturation (SvO2) and total cerebral blood flow (tCBF) absolute parameter values with black symbols corresponding to images in A; (C) percent changes in SaO2, SvO2, and tCBF parameter values normalized to average baseline value; (D) tCBF, arteriovenous oxygen saturation difference (AVO2D), and cerebral metabolic rate of oxygen consumption (CMRO2) absolute parameter values and (E) percent changes in parameter values normalized to baseline. Gray bars indicate the apnea period. All values in time-course plots are averaged across the three repeats of the paradigm. The bracketed sections ‘Base' and ‘EA' indicate the data used for computing average baseline values and end-apnea values for each subject.
Table 1 lists the parameters extracted from the time-course data for each subject, both at baseline and in response to apnea. The average baseline SvO2, tCBF, and CMRO2 values were 68.6±3.0%HbO2, 48.6±7.0 mL/100 g/minute, and 125.1±11.4 μmol/100 g per minute, respectively, consistent with previous findings.14 As previously observed,14 oxygen delivery (the product of CaO2 and tCBF) was negatively correlated with oxygen extraction (AVO2D) at baseline (r=−0.76, P=0.011, two-tailed t-test). Maximum percent changes in tCBF and AVO2D were 43.5±9.4% and −32.1±5.7%, respectively, resulting in a small (6.0±3.5%) but significant (P=0.00044, two-tailed t-test) increase in CMRO2 between baseline and end apnea (final 15 seconds of apnea period).
Table 1. Summary of extracted physiologic parameters at rest and in response to volitional apnea.
|
Subject |
||||||||||||
|---|---|---|---|---|---|---|---|---|---|---|---|---|
| 1 | 2 | 3 | 4 | 5 | 6 | 7 | 8 | 9 | 10 | Mean | s.d. | |
| SvO2 (%HbO2) | ||||||||||||
| Average baseline | 66.0 | 69.0 | 68.2 | 72.3 | 62.7 | 67.3 | 72.5 | 71.0 | 67.2 | 69.5 | 68.6 | 3.0 |
| Maximum | 73.6 | 72.4 | 77.0 | 76.1 | 67.3 | 73.0 | 76.0 | 79.8 | 72.3 | 74.0 | 74.2 | 3.4 |
| Change (%) | 11.6 | 5.0 | 12.9 | 5.2 | 7.3 | 8.5 | 4.9 | 12.4 | 7.6 | 6.4 | 8.2 | 3.1 |
| tCBF (mL/100 g per minute) | ||||||||||||
| Average baseline | 52.3 | 51.7 | 43.8 | 54.8 | 45.4 | 37.5 | 55.8 | 58.0 | 39.9 | 46.4 | 48.6 | 7.0 |
| Maximum | 83.6 | 70.1 | 62.0 | 82.9 | 62.8 | 52.1 | 73.9 | 91.4 | 55.8 | 64.8 | 69.9 | 12.9 |
| Change (%) | 60.0 | 35.6 | 41.3 | 51.1 | 38.2 | 38.9 | 32.5 | 57.6 | 40.0 | 39.7 | 43.5 | 9.4 |
| SaO2 (%HbO2) | ||||||||||||
| Average baseline | 99.4 | 99.3 | 98.0 | 97.0 | 98.9 | 97.2 | 98.2 | 98.2 | 96.1 | 97.3 | 98.0 | 1.1 |
| Minimum | 92.7 | 94.7 | 96.3 | 90.7 | 92.3 | 94.0 | 93.3 | 96.3 | 91.7 | 93.2 | 93.5 | 1.9 |
| Change (%) | −6.8 | −4.6 | −1.7 | −6.5 | −6.7 | −3.3 | −5.0 | −1.9 | −4.6 | −4.2 | −4.5 | 1.8 |
| AVO2D (%HbO2) | ||||||||||||
| Average baseline | 33.4 | 30.2 | 29.8 | 24.7 | 36.2 | 29.9 | 25.7 | 27.1 | 28.9 | 27.8 | 29.4 | 3.4 |
| Minimum | 20.0 | 22.3 | 19.4 | 15.7 | 25.7 | 21.5 | 17.3 | 16.5 | 22.3 | 19.2 | 20.0 | 3.1 |
| Change (%) | −40.0 | −26.2 | −35.0 | −36.4 | −29.1 | −28.2 | −32.8 | −39.2 | −22.8 | −30.9 | −32.1 | 5.7 |
| CMRO2 (μmol/100 g/minute) | ||||||||||||
| Average baseline | 142.2 | 135.8 | 118.8 | 122.0 | 125.5 | 104.9 | 140.0 | 123.5 | 117.4 | 120.6 | 125.1 | 11.4 |
| End apnea | 147.1 | 155.8 | 122.6 | 130.3 | 132.5 | 107.2 | 147.4 | 130.1 | 126.9 | 126.9 | 132.7 | 14.1 |
| Change (%) | 3.5 | 14.7 | 3.3 | 6.9 | 5.6 | 2.2 | 5.3 | 5.3 | 8.1 | 5.2 | 6.0 | 3.5 |
Abbreviations: AVO2D, arteriovenous oxygen saturation difference; CMRO2, cerebral metabolic rate of oxygen consumption; %HbO2, percent hemoglobin saturation; SaO2, arterial oxygen saturation; SvO2, venous oxygen saturation, tCBF, total cerebral blood flow.
Individual subject and group (mean and s.d.) values of various extracted parameters: average baseline (average value over the first 24 seconds of the baseline period), maximum/minimum (highest/lowest value reached over the entire paradigm), end apnea (CMRO2 only: average value over the final 15 seconds of the apnea period); change (percent change between average baseline and corresponding maximum (SvO2, tCBF), minimum (SaO2, AVO2D), or end-apnea (CMRO2) parameter value.
The apneic response averaged across the 10 subjects is displayed in the time-course plots of Figure 5. It is evident that flow increases during apnea and then undershoots before returning to baseline while oxygen extraction decreases during apnea and then overshoots before returning to baseline. The slightly larger magnitude of the flow increase compared with the AVO2D decrease causes a small increase in CMRO2 during apnea followed by a transient undershoot before return to baseline.
Figure 5.

Apnea paradigm cohort data: (A) time-course plot of cohort-averaged arterial oxygen saturation (SaO2), venous oxygen saturation (SvO2), and total cerebral blood flow (tCBF) absolute parameter values and (B) percent changes in parameter values normalized to average baseline; (C) tCBF, arteriovenous oxygen saturation difference (AVO2D), and cerebral metabolic rate of oxygen consumption (CMRO2) absolute parameter values and (D) percent changes in parameter values normalized to average baseline. Error bars indicate±1 s.d. Gray bars indicate the apnea period. All values in time-course plots are averaged across the three repeated blocks of the paradigm. The bracketed sections ‘Base' and ‘EA' indicate the data used for computing average baseline values and end-apnea values.
Discussion
We have introduced a magnetic resonance imaging-based method for absolute quantification of CMRO2 in humans with 3-second temporal resolution. Key methodological assumptions were validated in a tube-breathing paradigm. The sensitivity of the technique to detect dynamic changes in CBF, oxygen extraction, and CMRO2 was assessed in response to a dynamic volitional apnea paradigm in a cohort of young healthy adults.
Results from the tube-breathing experiment (Figures 2 and 3) suggest application of the technique in the SSS produces only small systematic errors. Coefficients of variation of the SSSBF:tCBF ratio across all time points of the paradigm were small (<0.10) for each subject. Furthermore, Welch's t-tests for equal means comparing the SSSBF:tCBF ratio for tube-breathing and non-tube-breathing portions of the experiment were non-significant for all subjects (P>0.40). Therefore, it appears that SSSBF closely parallels tCBF in response to tube breathing. This result is expected considering that the SSS accounts for nearly half of tCBF and because a global physiologic paradigm such as tube breathing would not be expected to have a regional bias. Because of the similarity between tube breathing and apnea, the results support estimation of tCBF based on SSSBF for quantifying CMRO2 in response to apnea or other global physiologic challenges.
Systematic errors due to keyhole reconstruction were observed to decrease expectedly as the keyhole reduction factor was decreased, with mean errors and root-mean-square errors in flow and SvO2 having magnitude less than 0.04 for all subjects and less than 0.02 averaged across subjects when using a reduction factor of 4. Importantly, because flow and SvO2 are not independent but both increase in response to apnea, absolute errors in SvO2 and flow are both negative, which should cause the resultant error in CMRO2 to be lower than would be predicted if the two errors were not correlated.
In response to apnea, we observed a small (6.0±3.5%) but significant (P=0.00044, two-tailed t-test) increase in CMRO2. Apnea has been used in the past as an assumed isometabolic stimulus in BOLD fMRI studies, both for calibrating the BOLD signal to quantify relative CMRO2 changes19 and as an isometabolic standard in studies investigating the BOLD poststimulus undershoot.36 Our results suggest that apnea may be slightly pro-metabolic. Increased CMRO2 in response to apnea could represent a physiologic mechanism for buffering the brain energy supply in anticipation of prolonged apnea, which eventually would lead to exhaustion of energy stores and neuronal cell death. This would be consistent with other observations of the normal apneic response, such as reduced cardiac output, peripheral vasoconstriction, and cerebral vasodilation, which serve to maintain oxygen stores in the brain at the expense of the periphery.
To the authors' knowledge, no previous studies have directly quantified CMRO2 during apnea, though studies of the CMRO2 response to various gas mixtures provides insight into the present work. In recent work from the authors' laboratory, a similar CMRO2 technique employing susceptometry-based oximetry has shown that CMRO2 does not change during hypercapnic steady state.14 However, apnea represents a mix of both hypercapnia and hypoxia, and never reaches a steady state. Data from the periods between steady states were not recorded in the prior study, and the temporal resolution used (25 seconds) would be unable to distinguish the transient changes in CMRO2 detected in the present study. Studies of the CMRO2 response to hypercapnia using T2-based methods for SvO2 quantification have yielded mixed results, with T2-based intravascular approaches reporting both no change37 and a 13.4±2.3% decrease38 in CMRO2 in response to moderate hypercapnia. The latter T2-based approach was recently applied to detect a 5.0±2.0% average increase in CMRO2 in response to mild (14% inspired FiO2) steady-state hypoxia,39 a difference of 18.4% compared with the CMRO2 response to hypercapnia using the same methodology. Given that apnea is a mixed hypercapnic/hypoxic stimulus, that similar susceptometry-based oximetry techniques as the one used in the present study have found hypercapnia to be isometabolic,14 and that T2-based approaches support a large CMRO2 difference between hypoxia and hypercapnia, the small apneic CMRO2 increase observed in this study is not unexpected. Nevertheless, extrapolations based on steady-state gas mixture breathing are of limited relevance to apnea, which is inherently non-steady state, involving continuously increasing levels of both hypercapnia and hypoxia.
Application of the proposed technique during administration of breathing gases (CO2 and O2) would better establish the relative contributions of hypercapnia and hypoxia to the observed apneic CMRO2 response. Such studies would also suggest the extent to which hypercapnia and hypoxia are isometabolic, not only at steady state, but in the transition to steady state. Such information is critical given the use of CO2 and O2 in calibrating BOLD fMRI, as there is growing interest in making BOLD fMRI more quantitative through respiratory calibration.
The ability of the method to capture details of the temporal dynamics of the apneic response is especially well illustrated by the group-averaged time-course plots (Figure 5), which illustrate not only the neurovascular effects of apnea, but also the more subtle effects of respiration. Coached inspiration from 6 to 3 seconds before apnea causes reduced intrathoracic pressure and increased right atrial venous return, changes reflected by the small observed increase in CBF just before apnea initiation. In contrast, coached expiration during the final 3 seconds before apnea has the opposite effect, and the end-expiratory breath-hold state reached upon apnea initiation is also known to result in decreased cerebral venous blood flow.40 Indeed, CBF was observed to transiently decrease during the beginning of the apnea period, taking nearly half the apnea period for the flow increase due to apnea-induced hypoxia and hypercapnia to overcome the small flow decrease caused by the end expiration-induced reduction in cerebral venous blood flow. Finally, immediately after apnea cessation, another transient, sharp increase in flow is observed, likely arising from the large initial inspiration at the end of the apnea period. While opposite magnitude changes in the AVO2D difference were observed during the same aforementioned inspiratory and expiratory periods, they are of lesser magnitude, and, therefore, flow driven CMRO2 changes are recorded. It is difficult to ascertain whether these transient CMRO2 changes are real or arise from a temporary mismatch between the true (arterial) tCBF, and the SSSBF used to quantify tCBF in the described technique. Inspiration and expiration during other free-breathing portions of the paradigm is not temporally matched across subjects and paradigm repeats, and is therefore averaged out of the time-course data.
One possible limitation of the proposed method is the necessity of measuring SaO2 with pulse oximetry. No arterial vessels of suitable geometry for application of the long paramagnetic cylinder model exist in the head or neck region. Furthermore, the signal-to-noise ratio of susceptometry-based oximetry phase-difference maps is proportional to the accrued phase, which is small in highly oxygenated arterial blood. Accurate SaO2 quantification is critical as even a small underestimation in the SaO2 drop would cause an overestimation of the observed increase in CMRO2 in response to apnea. However, if underestimation of the change in SaO2 was the cause of the observed apneic CMRO2 increase, one would expect the percent changes in SaO2 and CMRO2 in response to apnea to be positively correlated across subjects, however, this correlation was small, negative, and insignificant (r=−0.18, P=0.62, two-tailed t-test).
An alternative approach to fast CMRO2 quantification is the use of projection-based T2 measurement, which achieves SvO2 quantification in 15 seconds, is independent of vessel orientation, and is not sensitive to field inhomogeneities.8 However, the method assumes that flow remains constant over the course of each 15-second measurement. It is therefore not suitable for a paradigm, such as apnea, in which significant flow changes occur over seconds. Furthermore, the model used for determining percent hemoglobin saturation values from T2 measurements must be empirically calibrated to specific Hct values, with errors due to deviations in Hct becoming especially large for higher blood oxygen saturation levels.
In conclusion, we have introduced and validated an approach for rapid quantification of CMRO2 with 3-second temporal resolution, and applied it to characterize the CMRO2 response to apnea. Potential clinical applications include investigation of diseases of altered neurometabolic response, for instance, OSA. More broadly, by providing a simple, robust, and quantitative method for assessing CMRO2 in response to physiologic stimuli, the technique can be used to investigate neurometabolic–hemodynamic relationships in a variety of normal physiologic and pathologic conditions.
The authors declare no conflict of interest.
Footnotes
References
- Tanaka M, Kondo S, Okamoto K, Hirai S. Cerebral perfusion and oxygen metabolism in Parkinson's disease: positron emission tomographic study using oxygen-15-labeled CO2 and O2. Nihon Rinsho. 1997;55:218–221. [PubMed] [Google Scholar]
- Leenders KL, Frackowiak RS, Quinn N, Marsden CD. Brain energy metabolism and dopaminergic function in Huntington's disease measured in vivo using positron emission tomography. Mov Disord. 1986;1:69–77. doi: 10.1002/mds.870010110. [DOI] [PubMed] [Google Scholar]
- Ishii K, Kitagaki H, Kono M, Mori E. Decreased medial temporal oxygen metabolism in Alzheimer's disease shown by PET. J Nucl Med. 1996;37:1159–1165. [PubMed] [Google Scholar]
- Ge Y, Zhang Z, Lu H, Tang L, Jaggi H, Herbert J, et al. Characterizing brain oxygen metabolism in patients with multiple sclerosis with T2-relaxation-under-spin-tagging MRI. J Cereb Blood Flow Metab. 2012;32:403–412. doi: 10.1038/jcbfm.2011.191. [DOI] [PMC free article] [PubMed] [Google Scholar]
- He X, Yablonskiy DA. Quantitative BOLD: mapping of human cerebral deoxygenated blood volume and oxygen extraction fraction: default state. Magn Reson Med. 2007;57:115–126. doi: 10.1002/mrm.21108. [DOI] [PMC free article] [PubMed] [Google Scholar]
- Bolar DS, Rosen BR, Sorensen AG, Adalsteinsson E. QUantitative Imaging of eXtraction of oxygen and TIssue consumption (QUIXOTIC) using venular-targeted velocity-selective spin labeling. Magn Reson Med. 2011;66:1550–1562. doi: 10.1002/mrm.22946. [DOI] [PMC free article] [PubMed] [Google Scholar]
- Bulte DP, Kelly M, Germuska M, Xie J, Chappell MA, Okell TW, et al. Quantitative measurement of cerebral physiology using respiratory-calibrated MRI. Neuroimage. 2012;60:582–591. doi: 10.1016/j.neuroimage.2011.12.017. [DOI] [PMC free article] [PubMed] [Google Scholar]
- Jain V, Magland J, Langham M, Wehrli FW.High temporal resolution in vivo blood oximetry via projection-based T(2) measurement Magn Reson Medadvance online publication, 18 October 2012doi: 10.1002/mrm.24519(e-pub ahead of print). [DOI] [PMC free article] [PubMed]
- Xu F, Ge Y, Lu H. Noninvasive quantification of whole-brain cerebral metabolic rate of oxygen (CMRO2) by MRI. Magn Reson Med. 2009;62:141–148. doi: 10.1002/mrm.21994. [DOI] [PMC free article] [PubMed] [Google Scholar]
- Jain V, Langham MC, Wehrli FW. MRI estimation of global brain oxygen consumption rate. J Cereb Blood Flow Metab. 2010;30:1598–1607. doi: 10.1038/jcbfm.2010.49. [DOI] [PMC free article] [PubMed] [Google Scholar]
- Fan AP, Benner T, Bolar DS, Rosen BR, Adalsteinsson E. Phase-based regional oxygen metabolism (PROM) using MRI. Magn Reson Med. 2011;67:669–678. doi: 10.1002/mrm.23050. [DOI] [PMC free article] [PubMed] [Google Scholar]
- Haacke EM, Lai S, Reichenbach JR, Kuppusamy K, Hoogenraad FG, Takeichi H, et al. In vivo measurement of blood oxygen saturation using magnetic resonance imaging: a direct validation of the blood oxygen level-dependent concept in functional brain imaging. Hum Brain Mapp. 1997;5:341–346. doi: 10.1002/(SICI)1097-0193(1997)5:5<341::AID-HBM2>3.0.CO;2-3. [DOI] [PubMed] [Google Scholar]
- Fernández-Seara MA, Techawiboonwong A, Detre JA, Wehrli FW. MR susceptometry for measuring global brain oxygen extraction. Magn Reson Med. 2006;55:967–973. doi: 10.1002/mrm.20892. [DOI] [PubMed] [Google Scholar]
- Jain V, Langham MC, Floyd TF, Jain G, Magland JF, Wehrli FW. Rapid magnetic resonance measurement of global cerebral metabolic rate of oxygen consumption in humans during rest and hypercapnia. J Cereb Blood Flow Metab. 2011;31:1504–1512. doi: 10.1038/jcbfm.2011.34. [DOI] [PMC free article] [PubMed] [Google Scholar]
- Leontiev O, Buxton RB. Reproducibility of BOLD, perfusion, and CMRO2 measurements with calibrated-BOLD fMRI. Neuroimage. 2007;35:175–184. doi: 10.1016/j.neuroimage.2006.10.044. [DOI] [PMC free article] [PubMed] [Google Scholar]
- Yablonskiy DA. Cerebral metabolic rate in hypercapnia: controversy continues. J Cereb Blood Flow Metab. 2011;31:1502–1503. doi: 10.1038/jcbfm.2011.32. [DOI] [PMC free article] [PubMed] [Google Scholar]
- Davis TL, Kwong KK, Weisskoff RM, Rosen BR. Calibrated functional MRI: mapping the dynamics of oxidative metabolism. Proc Natl Acad Sci USA. 1998;95:1834–1839. doi: 10.1073/pnas.95.4.1834. [DOI] [PMC free article] [PubMed] [Google Scholar]
- Chiarelli PA, Bulte DP, Wise R, Gallichan D, Jezzard P. A calibration method for quantitative BOLD fMRI based on hyperoxia. Neuroimage. 2007;37:808–820. doi: 10.1016/j.neuroimage.2007.05.033. [DOI] [PubMed] [Google Scholar]
- Thomason ME, Foland LC, Glover GH. Calibration of BOLD fMRI using breath holding reduces group variance during a cognitive task. Hum Brain Mapp. 2007;28:59–68. doi: 10.1002/hbm.20241. [DOI] [PMC free article] [PubMed] [Google Scholar]
- Van Zijl PC, Hua J, Lu H. The BOLD post-stimulus undershoot, one of the most debated issues in fMRI. Neuroimage. 2012;62:1092–1102. doi: 10.1016/j.neuroimage.2012.01.029. [DOI] [PMC free article] [PubMed] [Google Scholar]
- Ainslie PN, Ogoh S. Regulation of cerebral blood flow in mammals during chronic hypoxia: a matter of balance. Exp Physiol. 2010;95:251–262. doi: 10.1113/expphysiol.2008.045575. [DOI] [PubMed] [Google Scholar]
- Duchna HW, Guilleminault C, Stoohs RA, Faul JL, Moreno H, Hoffman BB, et al. Vascular reactivity in obstructive sleep apnea syndrome. Am J Respir Crit Care Med. 2000;161:187–191. doi: 10.1164/ajrccm.161.1.9810062. [DOI] [PubMed] [Google Scholar]
- Placidi F, Diomedi M, Cupini LM, Bernardi G, Silvestrini M. Impairment of daytime cerebrovascular reactivity in patients with obstructive sleep apnoea syndrome. J Sleep Res. 1998;7:288–292. doi: 10.1046/j.1365-2869.1998.00120.x. [DOI] [PubMed] [Google Scholar]
- Virtanen J, Noponen T, Salmi T, Toppila J, Meriläinen P. Impaired cerebral vasoreactivity may cause cerebral blood volume dip following obstructive sleep apnea termination. Sleep Breath. 2011;16:309–312. doi: 10.1007/s11325-011-0526-9. [DOI] [PubMed] [Google Scholar]
- Kety SS, Schmidt CF. The effects of altered arterial tenions of carbon dioxide and oxygen on cerebral blood flow and cerebral oxygen consumption of normal young men. J Clin Invest. 1948;27:484–492. doi: 10.1172/JCI101995. [DOI] [PMC free article] [PubMed] [Google Scholar]
- JB W.Pulmonary Physiology And Pathophysiology: An Integrated, Case-Based Approach2nd edn.Lippincott Williams & Wilkins: Philadelphia, PA; 2010. pp 10. [Google Scholar]
- Spees WM, Yablonskiy DA, Oswood MC, Ackerman JJ. Water proton MR properties of human blood at 1.5 Tesla: magnetic susceptibility, T(1), T(2), T*(2), and non-Lorentzian signal behavior. Magn Reson Med. 2001;45:533–542. doi: 10.1002/mrm.1072. [DOI] [PubMed] [Google Scholar]
- Jain V, Abdulmalik O, Propert KJ, Wehrli FW. Investigating the magnetic susceptibility properties of fresh human blood for noninvasive oxygen saturation quantification. Magn Reson Med. 2012;68:863–867. doi: 10.1002/mrm.23282. [DOI] [PMC free article] [PubMed] [Google Scholar]
- Langham MC, Magland JF, Floyd TF, Wehrli FW. Retrospective correction for induced magnetic field inhomogeneity in measurements of large-vessel hemoglobin oxygen saturation by MR susceptometry. Magn Reson Med. 2009;61:626–633. doi: 10.1002/mrm.21499. [DOI] [PMC free article] [PubMed] [Google Scholar]
- Li C, Langham MC, Epstein CL, Magland JF, Wu J, Gee J, et al. Accuracy of the cylinder approximation for susceptometric measurement of intravascular oxygen saturation. Magn Reson Med. 2012;67:808–813. doi: 10.1002/mrm.23034. [DOI] [PMC free article] [PubMed] [Google Scholar]
- Mugler JP, Brookeman JR. Three-dimensional magnetization-prepared rapid gradient-echo imaging (3D MP RAGE) Magn Reson Med. 1990;15:152–157. doi: 10.1002/mrm.1910150117. [DOI] [PubMed] [Google Scholar]
- Van Vaals JJ, Brummer ME, Dixon WT, Tuithof HH, Engels H, Nelson RC, et al. "Keyhole" method for accelerating imaging of contrast agent uptake. JMRI. 1993;3:671–675. doi: 10.1002/jmri.1880030419. [DOI] [PubMed] [Google Scholar]
- Goode RC, Brown EB, Howson MG, Cunningham DJ. Respiratory effects of breathing down a tube. Respir Physiol. 1969;6:343–359. doi: 10.1016/0034-5687(69)90033-4. [DOI] [PubMed] [Google Scholar]
- Batzel JJ. Cardiovascular And Respiratory Systems: Modeling, Analysis, And Control. Society for Industrial and Applied Mathematics: Philadelphia, PA; 2007. [Google Scholar]
- Yushkevich PA, Piven J, Hazlett HC, Smith RG, Ho S, Gee JC, et al. User-guided 3D active contour segmentation of anatomical structures: significantly improved efficiency and reliability. Neuroimage. 2006;31:1116–1128. doi: 10.1016/j.neuroimage.2006.01.015. [DOI] [PubMed] [Google Scholar]
- Hua J, Stevens RD, Huang AJ, Pekar JJ, van Zijl PCM. Physiological origin for the BOLD poststimulus undershoot in human brain: vascular compliance versus oxygen metabolism. J Cereb Blood Flow Metab. 2011;31:1599–1611. doi: 10.1038/jcbfm.2011.35. [DOI] [PMC free article] [PubMed] [Google Scholar]
- Chen JJ, Pike GB. Global cerebral oxidative metabolism during hypercapnia and hypocapnia in humans: implications for BOLD fMRI. J Cereb Blood Flow Metab. 2010;30:1094–1099. doi: 10.1038/jcbfm.2010.42. [DOI] [PMC free article] [PubMed] [Google Scholar]
- Xu F, Uh J, Brier MR, Hart J, Yezhuvath US, Gu H, et al. The influence of carbon dioxide on brain activity and metabolism in conscious humans. J Cereb Blood Flow Metab. 2011;31:58–67. doi: 10.1038/jcbfm.2010.153. [DOI] [PMC free article] [PubMed] [Google Scholar]
- Xu F, Liu P, Pascual JM, Xiao G, Lu H. Effect of hypoxia and hyperoxia on cerebral blood flow, blood oxygenation, and oxidative metabolism. J Cereb Blood Flow Metab. 2012;32:1909–1918. doi: 10.1038/jcbfm.2012.93. [DOI] [PMC free article] [PubMed] [Google Scholar]
- Mehta NR, Jones L, Kraut MA, Melhem ER. Physiologic variations in dural venous sinus flow on phase-contrast MR imaging. AJR Am J Roentgenol. 2000;175:221–225. doi: 10.2214/ajr.175.1.1750221. [DOI] [PubMed] [Google Scholar]