

Abstract
The oxygen exchange and correlation between the cerebral blood flow (CBF) and cerebral metabolic rate of oxygen consumption (CMRO2) in the cortical capillary levels for normal and pathologic brain functions remain the subject of debate. A 3D realistic mesoscale model of the cortical capillary network (non-tree like) is constructed using a random Voronoi tessellation in which each edge represents a capillary segment. The hemodynamics and oxygen transport are numerically simulated in the model, which involves rheological laws in the capillaries, oxygen diffusion, and non-linear binding of oxygen to hemoglobin, respectively. The findings show that the cerebral hypoxia due to a significant decreased perfusion (as can occur in stroke) can be avoided by a moderate reduction in oxygen demand. Oxygen extraction fraction (OEF) can be an important indicator for the brain oxygen metabolism under normal perfusion and misery-perfusion syndrome (leading to ischemia). The results demonstrated that a disproportionately large increase in blood supply is required for a small increase in the oxygen demand, which, in turn, is strongly dependent on the resting OEF. The predicted flow-metabolism coupling in the model supports the experimental studies of spatiotemporal stimulations in humans by positron emission tomography and functional magnetic resonance imaging.
Keywords: computational model, flow-metabolism coupling, hypoxia, ischemia, OEF, oxygen transport
Introduction
The oxygen exchange in the microvasculature, particularly the complex capillary networks in the brain, is crucial for the survival of vulnerable neural tissue. The measurement methods for hemodynamics and partial oxygen pressure (PO2) in the cerebral tissue still have technical limitations and may not be possible for microscale size in capillary levels.1, 2, 3, 4, 5, 6
To assess tissue PO2 gradients on a microscopic scale, the earliest study is the classic theoretical model of Krogh,7 which has been used in many subsequent studies using an array of parallel, evenly spaced capillaries.8, 9 To simulate oxygen transport for a complex capillary network, Hsu and Secomb10 implemented the Green's function approach for a simple array of capillaries in which the oxygen supply was represented as a series of oxygen sources along the vessels. This method was developed for a small part of a cortical capillary network derived from scanning electron micrographs of corrosion casts.11 The hematocrit was assumed uniform in the network and the blood flow of each capillary segment was obtained from the experimental observations. Another study was conducted to simulate the hemodynamics (assuming constant viscosity) and oxygen transport in part of a cortical image reconstruction.12 A hybrid numerical algorithm was implemented on the basis of a time-varying oxygen advection–diffusion process using the finite element method.
To better assess the relationship between cerebral blood flow (CBF) and cerebral metabolic rate of oxygen consumption (CMRO2) during physiologic and pathophysiological conditions, theoretical studies were conducted in which CBF and CMRO2 in a compartmental model of capillary exchange were coupled in the non-linear manner over a wide range of blood flow and metabolic states.13, 14, 15
To date, microvascular networks have been based on relatively small sections of tissue generated from animal models using, in some cases, scanning electron microscope techniques.11 Although physiologically relevant, it does not allow investigation into the consequences of variations in network capillary density, length, and diameter distributions of the vessels or partial/total occlusion of particular sections of the network. This has particular importance when considering the reduction in the cerebral tissue due to dementia or diabetes.16 The presented work provides a method of numerically generating a variety of capillary networks, thereby allowing investigations on the above variabilities.
In the present study, the hemodynamics based on the rheological laws in the capillaries and pertinent oxygen transport are numerically predicted in a realistic mesoscale model of a cortical capillary network. Unlike previous compartmental models, an investigation on oxygen extraction fraction (OEF), the correlation between CBF and CMRO2 in the normal and pathologic brain functions, i.e., ischemia and hypoxia are evaluated by a 3D realistic model of cerebral capillary network that is constructed using a random Voronoi tessellation. The complex flow pathways with the heterogeneous transit times in the present model lead to a modified correlation between CBF and CMRO2 during different metabolic activations.
Materials and Methods
In this study, the cortical capillary network is constructed using a Voronoi tessellation as previously described17 but extended to three dimensions (Figure 1). Each Voronoi segment and each Voronoi node correspond to a capillary segment and a connecting node between capillary segments, respectively. The structure of the Voronoi network consists of polygonal areas where each polygon vertex (node) attaches to three vertices via segments that are consistent with the structure patterns and bifurcating and reconnecting connections in the cerebral capillary network.1, 18, 19, 20, 21 The extension of the planar structure of the model to 3D dimensions can be made by defining an additional dimension for the network's vertices in z axis (vertical axis to the pertinent planar surface) with different values. The z values for the vertices are obtained as a result of imposing the angles with respect to the x–y plane with random values for the relevant segments (edges) such that the capillary segments are oriented with a dispersion angle (standard deviation) close to 50°. This 3D architecture indicates a relatively high scatter of the distribution of capillary orientation, which is consistent with histologic data in the cortical capillaries20, 21 (See Table 1). Figure 1 indicates both inlets from the arterioles (red points) and venular outlets (blue points).
Figure 1.

(A) 3D network model of cerebral capillary networks. Red rectangular points and blue circle points represent the flow inlets and outlets to and from the model, respectively. (B) A part of the network model in which the circular points represent the beginning and ending capillary segments. (C) Scheme of each node (i) and its three neighboring nodes for the model. Qij represents blood flow in capillary segment ij. (D) Schematic representation of oxygen transport from a part of a capillary segment to the relevant tissue. RBC, red blood cell.
Table 1. Comparison of numerically derived morphometric data with experiment (per unit volume).
The simple capillary network (Figure 1B) was attached to other small capillary networks with a different random pattern in order to construct a mesoscale model (with 492 capillary segments) corresponding to a complex cortical capillary network (Figure 1A). The density of capillary segments in the 3D model can be changed by changing the number of random Voronoi points. Hence, this approach is capable of creating a generic 3D geometric network consistent with different parts of cortical capillary networks (with different densities). To convert the straight capillary segments to tortuous capillaries in the network, sinusoidal variations (40 μm wavelength, 5.5 to 6 μm amplitude) are superimposed on each segment of the network models. This tortuosity leads to an increase of ∼13% to 16% in the length of the capillary segments, consistent with the observations in the cortical capillary network.22 The distribution of inlet flows (penetrating arterioles) in the models is considered to be consistent with the distribution of terminal penetrating arterioles in the cortex.23 Further details have been described in our previous study.17
The morphometric parameters (vascular volume, surface, length density with respect to the estimated total tissue volume, and the mean extravascular distance) of the capillary network in the model are given in Table 1 and are within the range of the observed data in the brain cortices by using a proper density of random Voronoi points.20, 21, 24 The mean extravascular distances of the whole network represent oxygen diffusion in the tissue, which is linked to the vascular density by an inverse relationship.
Analysis of Hemodynamic Components
The numerical solution method of the blood flowing throughout the model consists of two methods in series so as to (i) determine a proper diameter distribution in the model (linear procedure) and (ii) analyze the hemodynamics, i.e., hematocrit, blood flow, and blood velocity in the model (linear and non-linear procedures). The blood flowing in each capillary segment is assumed to obey Poiseuille's law as follows
 |
Where Δp, D, and L represent pressure drop along a vessel, vessel diameter, and vessel length, respectively. In this study, the distribution of capillary diameters in the network (diameter distribution) is numerically determined on the basis of the modified Murray's law, which is a more physiologically relevant development of Murray's law.25
A ‘node' is defined as the vertex of any Voronoi polygon in the network. In the linear procedure, the computation of the pressure at each connecting node, i, and subsequently the flow in each relevant capillary segment, ij, are based on Poiseuille's law (equation (1)) and with respect to conservation of the flows (Qij) at each connecting node (Figure 1C). In order to determine a proper diameter distribution for the 3D model, in the first iteration of the linear procedure, the diameter values (Dij) are initially randomly imposed onto the capillary segments using the observed values (mean±s.t.d.) of capillaries in the cortex.20, 21 The blood viscosity (η) is assumed to be constant. The pressures and flows for the network are solved in the system of linear equations derived from equation (1) for each segment, bifurcation, and reconnection node. This allows for the determination of the flow pattern (flow directions) in the network model. Then, the redistribution of diameter values in the model can be implemented on the basis of the modified Murray's law, given by
 |
here, Df, Dα, and Dβ represent the diameter of parent vessel and diameters of daughter branches, respectively. The power exponent 3.6 leads to a maximum efficiency for blood flow in the network with respect to the complex blood rheology in the capillaries (commonly called Murray's principle). This procedure is repeated until no changes in the diameters of vessel segments occur. The output of the procedure is a diameter distribution in the network, which remains constant for the analysis of the hemodynamics.
In microvessels, the viscosity (η) is not constant and dependent on diameter (D) and discharge hematocrit (HD) (Fahraeus–Lindqvist effect). To describe this effect, we used the apparent viscosity, ηvivo=f1(D,HD), which is derived using the Fahraeus–Lindqvist effect with respect to the effective thickness of endothelial surface layer.26 Another phenomenon, plasma skimming, was considered for the analysis of hemodynamics where the erythrocyte flow at vessel bifurcations is asymmetrically distributed compared with overall blood flow. This phenomenon was expressed with respect to erythrocyte volume flow conservation:27
 , where H0, Q0, and D0 represent the hematocrit, flow, and diameter in the parent vessel; Hα, Qα, and Dα are the hematocrit, flow, and the diameter in one of the two daughter vessels. The second procedure (non-linear solution method) involves the computation of the hematocrit and the apparent viscosity (ηvivo) for each capillary segment alternatively. Once the hematocrit has been computed for each segment, the apparent effective viscosity is deduced. The two procedures are repeated alternately until the hematocrit in each segment reaches a satisfactory convergence. Further details have been given in the previous studies.17, 28 The required boundary conditions for the flow analysis are the pressure at inlet flows (precapillaries) and outlet flows (venules) with a pressure drop of ∼10 mm Hg.29, 30
Analysis of Oxygen Transport
The fundamental equations used for the simulation of oxygen transport are the convection of oxygen concentration into the capillary segments, diffusion of oxygen into the tissue volume, and the oxygen consumption rate in the tissue. All relevant equations are defined for steady state. The oxygen diffusion equation is obtained from the diffusion flux of oxygen on the basis of Fick's law and conservation mass in the system, which is given by
DO2 and α represent the diffusion coefficient of oxygen and the oxygen solubility (Henry's constant), respectively. ∇2 denotes the Laplacian operator and M(P) represents the oxygen consumption rate (cerebral metabolic rate), which is a function of the oxygen tension (P or PO2) of the local tissue according to the Michaelis–Menten kinetics:15, 28, 31
 , where M0 and Pcr denote maximum cerebral metabolic rate and the oxygen pressure at half-maximal consumption, respectively. The Hill equation was used for the oxyhemoglobin saturation curve,
  , where P50 and n represent the oxygen tension at 50% oxygen saturation of blood and an empirical exponent (Hill constant), respectively. The empirical values for Pcr, P50, and n are assumed to be 1 mm Hg, 30 mm Hg, and 3, respectively.10 Hence, the rate of convective oxygen transport, f(Pb), along a capillary segment is given by
 |
The effective solubility of blood (αeff) is defined to be a function of hematocrit, representing the oxygen solubility of red blood cell and plasma (αrbc and αpl). Q is the blood flow, which is estimated in the hemodynamic analysis. C and Pb represent oxygen concentration of blood and average blood oxygen tension, respectively. Each capillary segment is assumed axisymmetric, i.e., a uniform circular cross-section of radius rv. Hence, the radial oxygen flux is considered uniform at any cross-section of the capillary. The oxygen delivery from a capillary is thus only dependent on the longitudinal axis (z axis) of a capillary defined as an efflux per unit length (qv). Conservation mass for the transport of oxygen from an intravascular segment to the adjacent tissue gives
 |
Considering the intra-capillary resistance for diffusive oxygen, the tissue oxygen tension averaged around the circumference of the vessel as a function of axial distance z, Pv(z), is given by
where K denotes the intravascular resistance to radial oxygen transport (the inverse of the capillary mass transfer coefficient). K (dependent on capillary diameter) can be obtained from the dimensionless mass transfer coefficient, Nusselt number (Nu):  . Nu was compiled from the literature as a function of vessel diameter.32
Kpl (Krogh diffusion coefficients in plasma) is assumed to be 8.3 × 10⁻¹⁰ cm3O2/(cm.s.mm Hg) in plasma.33, 34 The estimated K depends on the capillary diameters in the range of 3.7 μm to 10 μm (the capillary diameter range in the models presented in this paper).
. Nu was compiled from the literature as a function of vessel diameter.32
Kpl (Krogh diffusion coefficients in plasma) is assumed to be 8.3 × 10⁻¹⁰ cm3O2/(cm.s.mm Hg) in plasma.33, 34 The estimated K depends on the capillary diameters in the range of 3.7 μm to 10 μm (the capillary diameter range in the models presented in this paper).
The numerical solution of equation (3) is conducted by representing the blood vessels as a set of discrete oxygen sources (vessel points) and the tissue region as a set of discrete oxygen sinks (tissue points) in the 3D model. The PO2 at each tissue and vessel point is presented as a superposition of the oxygen tension resulting from the all vascular sources using a Green's function in a similar manner to Secomb et al.11 The problem constraint is such that the net oxygen delivery from the capillary network is equal to the oxygen consumption in the model. The iterative loops in the numerical procedure are executed until the problem constraint is satisfied.
Results
Twelve inlet flows (precapillaries) and 24 outlet flows (venules) were considered in the middle and both sides of the model, respectively. The capillary diameters were heterogeneously distributed throughout the network model with the statistical values of 6.39±1.49 μm, which were comparable to the morphometric data in the cortex (6.47±1.7 μm).20, 21 A comparison with the experimental data of capillary diameters is given in Table 1. The hemodynamic results show a significant heterogeneity for the hematocrit and velocity because of the complex architecture and topology in the model (Figure 2). The Fahraeus effect led to an increase in the red blood cell (RBC) velocity and a decrease in the tube hematocrit compared with the blood velocity and the discharge hematocrit, respectively. Sixty-six percent of RBC velocity values are in the range of 0.5 to 1.8, which is fully consistent with the observations on the brain cortex (65% of the RBC velocity in the range of 0.5 to 1.8 mm/second).1, 3 The pattern of velocity distribution in the model (Figure 2C) shows that the capillary segments with larger diameters are responsible for delivering a larger blood flow with higher velocity in the network, which compares well with the pattern of blood delivery in the arterial and small arteriole trees.35 Figure 2A also demonstrates the range values of 0.12 to 0.51 for the tube hematocrit with the statistical value of 0.25±0.06 comparing well with that given by Hudetz of 0.24±0.09.1
Figure 2.

(A) Distribution of discharge hematocrit (black bar) and tube hematocrit (green bar). (B) Distribution of blood velocity (black bar) and red blood cell velocity (green bar). (C) Blood velocity versus capillary diameter. Each scatter point represents a capillary segment in the model. The curve shows that the blood velocity is proportional to D1.6.
The oxygen transport is simulated in the model for different oxygen consumption rates and perfusion rates to investigate both normal and pathological brain functions. The oxygen demands by the cerebral tissue in the range of 4 to 11 cm3O2/100 cm3 per minute are consistent with the physiological range in the cortex with respect to different cases of neuronal activities.11, 15 The relatively dense vasculature in the model presented here can correspond to a higher-than-average metabolic demand with M0=10 cm3O2/100 cm3 per minute in the control state with a corresponding perfusion of 160 cm3/100 g per minute. Figure 3 shows the heterogeneous distribution of tissue PO2 in the 3D complex capillary network for two perfusion rates, (i) control state (160 cm3/100 g per minute) and (ii) reduced perfusion of 80 cm3/100 g per minute. In order to have a better comparison, the color bars in all cases are the same. Reduced perfusion leads to a decrease in the tissue PO2 levels such that the hypoxia state (PO2⩽1 mm Hg) occurs in some regions (Figure 3B). The highest values of PO2 correspond to the tissue points in the area closest to the cross-section of capillaries (dark red points). As the distances of tissue points from the capillaries increase, the levels of oxygen concentration gradually reduce.
Figure 3.

Tissue PO2 levels presented in three planes perpendicular to x axis for the maximum oxygen consumption rate (M0) of 10 cm3O2/100 cm3/minute in two perfusion rates, (A) control state (160 cm3/100 g per minute) and (B) in 50% reduction (80 cm3/100 g per minute). The circular points represent the tissue points in the hypoxic state (PO2⩽1 mm Hg). CBF, cerebral blood flow.
Variations in oxygen diffusion cause changes to the oxygen tension in the tissue. For doubling of the diffusion coefficient of oxygen, the average oxygen tension values throughout the tissue increased by 14%. In addition, the ‘heterogeneity' in the distribution of tissue oxygen tension significantly decreased in comparison with the normal case throughout the model. The mean value for the ‘normal' case was 33.4 mm Hg with a standard deviation of 17.4, whereas for double the diffusion coefficient of the ‘normal' case, the mean was 37.97 mm Hg with a standard deviation of 6.4. Using standard t and F tests with an alpha value of 0.05, null hypotheses were rejected for no difference either between the means or between the variances, respectively. It is interesting to note that the variance was considerably reduced with the doubling of the oxygen diffusion coefficient.
Substantial changes in either the metabolic demand or the perfusion in the model show an approximately linear and non-linear effect, respectively, on the mean value of PO2 for the total tissue elements as shown in Figure 4A. The percentage change is relative to the control state (M0=10 cm3O2/100 cm3 per minute and CBF=160 cm3/100 g per minute) in the horizontal axis. The non-linear relationship between the resultant oxygen transport and varying perfusion is caused by the non-linear functional changes of OEF in varying perfusion rates, which is described in detail in a later section (see equation (7)). The relative changes in the consumption rate can influence the oxygen transport to the tissue more compared with the relative change to perfusion in the model. This behavior in the model supports the theoretical model13, 15 and observations36, 37 on the flow-metabolism coupling in the cerebral microvascular networks.
Figure 4.

(A) Changes in the mean tissue PO2 caused by changes in consumption rate (black square points and corresponding fitting line) and by changes in perfusion rate (red circular points and corresponding quadratic polynomial fitting line). Changes are relative to the corresponding values in control state. (B) Frequency distribution of transit time of red blood cells (RBCs) in the flow pathways of the 3D model. The black circle points, green star points, and red square points represent the model with the normal inflow rate, 75% and 50% of the normal inflow, respectively. CBF, cerebral blood flow.
The transit time of all pathways would be increased as a reduction of the inflow rate (perfusion) into the model. In the model, a reduction of 25% and 50% in the inflows into the model causes a variation in the frequency distribution of transit times in the pathways becoming wider with a reduced frequency maximum as indicated in Figure 4B.
Hypoxia
Inadequate blood supply to the microvascular network inevitably leads to oxygen deprivation (hypoxic state) in the cerebral tissue. Figure 5A shows the border of the hypoxic and non-hypoxic states as a function of CBF (perfusion) and maximum rate of oxygen consumption (M0) in the model. For different maximum rates of oxygen consumption (M0), the minimum perfusion rates (threshold perfusion) are predicted to supply the oxygen-consuming tissue without the occurrence of hypoxia state in the model. In these simulations, the PO2 in some regions of the tissue is predicted to be very close to the hypoxia state (PO2⩽1 mm Hg). Figure 5A represents estimated threshold states in the model and the curved line is an exponential function fit for the pertinent points. Increasing oxygen demand requires increased blood perfusion to compensate for oxygen deficits and the hypoxia state in the tissue. This is consistent with the physiological observations.4, 36, 37, 38, 39 In a stable oxygen demand, the perfusion rate in control state (squared mark) can be approximately reduced by up to 40% without incurring a hypoxic region in the tissue. Conversely, by maintaining the perfusion rate in the control state, a 16% increase in the oxygen demand (M0) leads to an occurrence of hypoxia in the tissue of the model. Enhancing the oxygen consumption rate beyond the threshold state (hypoxic region) leads to a rapid increase in the volume fraction of hypoxic tissue (hypoxic fraction) (Figure 5B). These results are very similar to that found by Secomb et al11; however, in the cases presented here, the model uses the solution of both hematocrit and flow rates on the basis of the morphometric data of the vasculature, in contrast to Secomb's assumed flow rates. Estimates of the consumption rates at which hypoxia occurs are slightly lower in the presented model compared with that of Secomb et al. Although the volume of tissue simulated is greater than that used by Secomb et al, the data evaluated by both models for Figure 5 are volume-averaged values, and any detail emanating from the hematocrit or flow-rate variation is effectively ‘smoothed out'. This indicates that, for volume-based values of tissue perfusion, a randomized vascular network is sufficient to provide values comparable to physiologically derived networks. Indeed, it provides a flexible model capable of investigating a whole variety of conditions that are impossible to achieve with actual physiological data.
Figure 5.

(A) Effect of consumption rate and perfusion rate on occurrence of hypoxia (tissue with PO2⩽1 mm Hg). Curve separates hypoxic region (blue background) from non-hypoxic region. The square symbol indicates consumption and perfusion in the control state (M0=10 and cerebral blood flow (CBF)=160). (B) Changes in the hypoxic fraction in the tissue caused by changes in the maximum oxygen consumption rate for different perfusion rates (CBF) of 120, 160, and 240 cm3/100 g per minute correspond to blue, black, and red lines, respectively. The hypoxic fraction represents the volume fraction of tissue in the hypoxic state.
Blood Inflow Blockage in the Pre-Capillary Levels
In contrast to the model of Secomb et al,11 the presented simulation can evaluate the effects of a blocked inflow (cross-mark) in the tissue PO2 in the pre-capillary levels, and these are demonstrated in Figure 6. In the blocked inflow simulation, an inlet flow (out of 12 inlet flows in the pre-capillary levels) is blocked, which leads to a percentage reduction of 7% in the total blood inflow in the model. The subfigures of A, B, and C correspond to the levels of oxygen tensions in three horizontal planes (x–y plane) of the tissue with distances of 10 μm, 60 μm, and 110 μm from the blocked inflow. As the distance of the tissue plane from the blocked inflow increases, the pertinent effects and ΔPO2 values (PO2 (blocked)—PO2(normal)) are reduced. To accurately illustrate these effects, the cumulative frequency distribution of ΔPO2 is shown for the pertinent x–y planes (A–C) in Figure 6. The blocked inflow leads to a decrease in the tissue PO2 values of 71%, 56%, and 53% of the areas of the horizontal plane of A, B, and C, respectively. The dashed black line shows the cumulative frequency distribution of ΔPO2 in the total tissue volume. For a spherical tissue volume with approximate 60 μm radius (6.5% of the total tissue volume), blocking an inlet flow leads approximately to a significant reduction of tissue PO2 (10 to 30 mm Hg).
Figure 6.

The discrepancies of the tissue PO2 between two simulations of the blocked (cross-mark) and normal inflow in three x–y planes of tissue in 10 μm (A), 60 μm (B), and 110 μm (C) from the blocked inflow. Color bar shows the values of ΔPO2 in the tissue slides (PO2 (blocked)—PO2(normal)). Cumulative frequency of ΔPO2 in sub-figure of A and B and C are shown by A, B, and C line, respectively. The dashed black line represents ΔPO2 in total tissue in the model.
Oxygen Extraction Fraction and Flow-metabolism coupling
The cerebral tissue takes only a proportion of the total oxygen in the blood for the required consumption called the OEF. How much oxygen is extracted can be estimated using the Fick principle based on measurements of the arterial and venous oxygen content: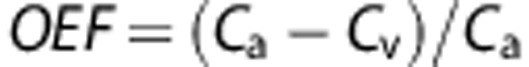 , where Ca and Cv represent oxygen content in the inlet arteriole and the outlet venule, respectively. The inlet oxygen content in the model is assumed to be 50 mm Hg oxygen partial pressure (PO2), which is equal to approximately 70% oxyhemoglobin saturation (SO2). The predicted oxygen content in the outlet venules of the model is dependent on the perfusion rate and oxygen demand.
The effects of varying perfusion rates on the oxygen transport can be evaluated using OEF. To achieve that, the OEF in the control state (160 cm3/100 g per minute) is compared with the OEF in the reduced and increased perfusion rates of 25% and 50%, respectively, in the model. The OEF of the model in the control state is predicted to be 25.61%. There are non-linear increases/decreases in the OEF caused by the reductions/increases in the perfusion rates relative to the control state as shown in Figure 7A. A 50% reduction in the perfusion leads to an increase in OEF of 75%, whereas a 50% rise in the perfusion leads to an OEF reduction by ∼30%. This trend of changes in OEF can support the mathematical models, which provide a basis for the quantitative interpretation of functional magnetic resonance imaging studies in terms of changes in local perfusion. The black curve (circular points) in Figure 7A shows the mathematical model provided by Buxton13 in which OEF was defined as a function of perfusion (CBF) as follows:
Figure 7.

(A) Changes in the oxygen extraction fraction (OEF) along the network model as a function of cerebral blood flow (CBF) (perfusion) (circle points) compared with the corresponding changes based on the Buxton and Frank model (star points). (B) The solid curves represent the flow-metabolism couplings in two different states of the 3D model, perfusion of 80 cm3/100 g per minute with the oxygen consumption rate of 3 and 5 cm3/100 g per minute (in the range of human brain), corresponding the resting OEF of 27.8 and 39.4, respectively. The corresponding dashed curves represent the flow-metabolism coupling based on the Buxton and Frank model. The star, square, downward-pointing, right-pointing triangle, and diamond marks represent the observation data.
 |
E and F represent the OEF and perfusion (CBF) in different states relative to the resting state (E0 and F0), respectively. E0 in equation (7) is considered to be the estimated OEF in the control state (OEF=25.61%), which corresponds to the OEF value of 38.5% in the complete flow pathways of the cerebral microcirculation. The red curve (star points) in the Figure 7A represents a quadratic polynomial fitted curve for the simulated data in the model. The comparison between Buxton's model and the present model is excellent.
There is a relatively simple link between the three parameters of oxygen consumption rate (cerebral metabolic rate of oxygen), perfusion, and OEF given by
 |
A tight coupling can be mathematically provided between varying metabolisms and perfusion rates with respect to E0 (resting OEF) as given in equation (8) and leads to a non-linear coupling between changes in oxygen consumption rate and flow in the cerebral microcirculation. Changes in the OEF along the network model as a function of CBF are compared with the corresponding changes on the basis of the Buxton and Frank model (star points) in Figure 7A.
For spatiotemporal coupling of metabolic activity with perfusion rate, the PO2 in the local brain tissue is physiologically maintained with brain tissue being especially sensitive to a transient fall in tissue PO2. In order to investigate the flow-metabolism coupling in the model, two simulations for a perfusion rate of 80 cm3/100 g per minute with oxygen consumption rates of 3 and 5 cm3O2/100 cm3 per minute in the range of the human brain15 were considered with different resting OEF states (Figure 7B). In three steps of increase in the oxygen demand (spatiotemporal stimulation of neural tissue), the increased perfusion rates (F in equation (8)) are predicted so as to maintain the tissue PO2 levels in the model. The two solid curves in Figure 7B derived by the present model are represented as isobaric contours for oxygen by which changes in the perfusion rates and oxygen consumption rates are coupled for two states of resting OEF of 27.8% and 39.4% for the complete flow pathways.5, 6
In Figure 7B, the solid curves represent the flow-metabolism coupling for two different states of the 3D model, perfusion of 80 cm3/100 g per minute with the oxygen consumption rate of 3 and 5 cm3/100 g per minute (in the range of human brain), corresponding to the resting OEF rates of 27.8 and 39.4, respectively. The corresponding dashed curves represent the flow-metabolism coupling based on the Buxton and Frank model. The star, square, downward-pointing, right-pointing triangle, and diamond marks represent observation data, which are described in the figure legend.
Discussion
The generic model presented in this paper is constructed with respect to physiologically realistic architectures and topology of cortical capillary networks with consistent morphometrics. The proper link between the hemodynamics and morphometrics based on the modified Murray's law where Q the flow rate and vessel radius r are related such that Q∝r3.6 led to consistent flow patterns with the mammalian circulatory and consequently the efficiency in RBC delivery through all flow pathways in the capillary network (Figure 2). The proper matching between the hemodynamics and morphometrics, in turn, led to a distribution pattern of wall shear stress for all the capillary segments in the network model, where 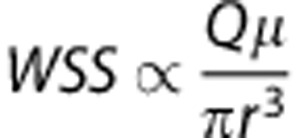 (data not shown).
The predicted border of the hypoxic and non-hypoxic states as shown in Figure 5A explains that the tissue hypoxia resulting from a significant decrease in brain perfusion (as can occur in stroke) can be avoided by a moderate reduction in oxygen consumption rate. The case of the control state (square mark in Figure 5A) shows the potential for the required oxygen transport to the cerebral tissue, even for relatively modest increases in the oxygen demand or some relatively modest decreases in the perfusion rate. This is consistent with the studies on the rat cerebral cortex.4, 11 This reserve oxygen supply in the cortical capillary network can help to regulate the oxygen transport and maintain the tissue PO2 in normal levels for different situations in either oxygen demand or perfusion rate.
The oxygen extraction fraction is an important indicator of brain tissue viability and is crucial to assess the brain oxygen metabolism under both normal and disease states, particularly, the treatment outcome in cerebral ischemia. The delivery of oxygen to the tissue was characterized by its OEF at the control state in the model. The state of OEF enhancement in the face of diminished CBF is termed ‘misery perfusion.'40 Pathological brain function might occur in cases such as carotid stenosis or occlusion of the feeding arterioles. The misery-perfusion syndrome is simulated in the model by reducing the feeding arteriole pressures of the inflows and, consequently, a reduction in the inflow. This abnormality can be found in the cerebral capillary networks caused by an abnormal narrowing or stricture in the upstream arterioles, i.e., carotid artery occlusion. Patients with inadequate blood supply relative to metabolic demand (misery perfusion) may be at increased risk for cerebral ischemia and stroke. The observation (by positron emission tomography and functional magnetic resonance imaging) suggests that the area of low perfusion exhibits the highest OEF. Hence, increased OEF can be associated with prior ischemic events in the cerebral microcirculation,40, 41 which can be predicted by the 3D realistic model presented in this study (Figure 7A).
The predicted flow-metabolism coupling, similar to physiologic observations using positron emission tomography and functional magnetic resonance imaging, has demonstrated that the fractional increase in CBF is much larger than the fractional increase in the cerebral metabolic rate of oxygen (CMRO2). The studies using positron emission tomography and functional magnetic resonance imaging have reported a wide range of changes in CBF against changes in the oxygen demands (references in Figure 7B) and some of them4, 37, 38 are in good agreement with the estimated flow-metabolism lines (solid lines) derived from the model.
There are differences between the flow-metabolism coupling lines relating to the Buxton and Frank model and the 3D model, which result from different types of the architecture and geometry between the two models. The OEF (E) in the Buxton and Frank model (equation 7) is derived from an average over the transit time distribution. One of the conditions for validity of equation 7 is that either all capillaries have the same mean transit time or the mean transit time decreases as flow increases.13 The 3D model consists of complex flow pathways with a wide heterogeneity in the lengths and outlet PO2 values consistent with the physiologic ranges found in the cortex. These heterogeneous characteristics in the flow pathways lead to a complex oxygen transport with a significantly wide variety of transit times for RBCs along the flow capillary pathways. A change in the perfusion rate for the model leads to not only changes in the transit time of flow pathways but also changes in the shape of distribution of transit times in the model (Figure 4B). Hence, changes in OEF as a function of the flow in the model is not fully consistent with equation 7 and the assumptions of Buxton and Frank. In Figure 7A, the difference between the predicted line in the Buxton and Frank model (idealistic model) and the presented model can be significant by the increasing inconsistency in the shape of distribution of transit times for different perfusion rates in the model. In the case of the presented model, the mean times are different. This phenomenon, in turn, leads to a lack of matching between the flow coupling lines relating to the two models (dashed lines in Figure 7B). However, the predicted flow-metabolism coupling in the model is in good agreement with the physiologic observations compared with the Buxton and Frank model (Figure 7B). In conclusion, the proposed model for the relationship between CBF and CMRO2 variations during neural stimulation provides a consistent framework for understanding O2 metabolism in the brain. The model is capable of simulating the non-linear coupling between the changes in flow and metabolism compatible with physiologic observations.
The blood regulation in the downstream levels (cerebral capillary networks) caused by contraction/dilation of cerebral capillaries is beyond the scope of this present work. The pericyte cells are initially considered to be a form of smooth muscle cell and modulators of blood flow in the cerebral capillary network in response to changes in neural activities, which are dispersedly located on the abluminal surface of the cerebral capillary walls.42
The authors declare no conflict of interest.
References
- Hudetz AG. Blood flow in the cerebral capillary network: a review emphasizing observations with intravital microscopy. Microcirculation. 1997;4:233–252. doi: 10.3109/10739689709146787. [DOI] [PubMed] [Google Scholar]
- Villringer A, Them A, Lindauer U, Einhaupl K, Dirnagl U. Capillary perfusion of the rat brain cortex. An in vivo confocal microscopy study. Circ Res. 1994;75:55. doi: 10.1161/01.res.75.1.55. [DOI] [PubMed] [Google Scholar]
- Tomita M, Tanahashi N, Takeda H, Schiszler I, Osada T, Unekawa M, et al. Capillo-venous flow in the brain: significance of intravascular RBC aggregation for venous flow regulation. Clin Hemorheol Microcirc. 2006;34:51–57. [PubMed] [Google Scholar]
- Masamoto K, Tanishita K. Oxygen transport in brain tissue. J Biomech Eng. 2009;131:074002. doi: 10.1115/1.3184694. [DOI] [PubMed] [Google Scholar]
- Tsai AG, Johnson PC, Intaglietta M. Oxygen gradients in the microcirculation. Physiol Rev. 2003;83:933. doi: 10.1152/physrev.00034.2002. [DOI] [PubMed] [Google Scholar]
- Vovenko E. Distribution of oxygen tension on the surface of arterioles, capillaries and venules of brain cortex and in tissue in normoxia: an experimental study on rats. Pflugers Arch. 1999;437:617–623. doi: 10.1007/s004240050825. [DOI] [PubMed] [Google Scholar]
- Krogh A. The number and distribution of capillaries in muscles with calculations of the oxygen pressure head necessary for supplying the tissue. J Physiol. 1919;52:409. doi: 10.1113/jphysiol.1919.sp001839. [DOI] [PMC free article] [PubMed] [Google Scholar]
- Middleman S. Transport Phenomena In The Cardiovascular System. Wiley-Interscience: New York; 1972. [Google Scholar]
- Popel A. Theory of oxygen-transfor to tissue. Crit Rev Biomed Eng. 1989;17:257–321. [PMC free article] [PubMed] [Google Scholar]
- Hsu R, Secomb TW. A Green's function method for analysis of oxygen delivery to tissue by microvascular networks. Math Biosci Eng. 1989;96:61–78. doi: 10.1016/0025-5564(89)90083-7. [DOI] [PubMed] [Google Scholar]
- Secomb T, Hsu R, Beamer N, Coull B. Theoretical simulation of oxygen transport to brain by networks of microvessels: effects of oxygen supply and demand on tissue hypoxia. Microcirculation. 2000;7:237–247. [PubMed] [Google Scholar]
- Fang Q, Sakadži S, Ruvinskaya L, Devor A, Dale AM, Boas DA. Oxygen advection and diffusion in a three dimensional vascular anatomical network. Opt express. 2008;16:17530. doi: 10.1364/oe.16.17530. [DOI] [PMC free article] [PubMed] [Google Scholar]
- Buxton RB, Frank LR. A model for the coupling between cerebral blood flow and oxygen metabolism during neural stimulation. J Cereb Blood Flow Metab. 1997;17:64–72. doi: 10.1097/00004647-199701000-00009. [DOI] [PubMed] [Google Scholar]
- Hayashi T, Watabe H, Kudomi N, Kim KM, Enmi JI, Hayashida K, et al. A theoretical model of oxygen delivery and metabolism for physiologic interpretation of quantitative cerebral blood flow and metabolic rate of oxygen. J Cereb Blood Flow Metab. 2003;23:1314–1323. doi: 10.1097/01.WCB.0000090506.76664.00. [DOI] [PubMed] [Google Scholar]
- Valabregue R, Aubert A, Burger J, Bittoun J, Costalat R. Relation between cerebral blood flow and metabolism explained by a model of oxygen exchange. J Cereb Blood Flow Metab. 2003;23:536–545. doi: 10.1097/01.WCB.0000055178.31872.38. [DOI] [PubMed] [Google Scholar]
- de Bresser J, Tiehuis AM, van den Berg E, Reijmer YD, Jongen C, Kappelle LJ, et al. Progression of cerebral atrophy and white matter hyperintensities patients with type 2 diabetes. Diabetes Care. 2010;33:1309–1314. doi: 10.2337/dc09-1923. [DOI] [PMC free article] [PubMed] [Google Scholar]
- Safaeian N, Sellier M, David T. A computational model of hemodynamic parameters in cortical capillary networks. J Theor Biol. 2011;271:145–156. doi: 10.1016/j.jtbi.2010.11.038. [DOI] [PubMed] [Google Scholar]
- Motti EDF, Imhof HG, Yasargil MG. The terminal vascular bed in the superficial cortex of the rat. J Neurosurg. 1986;65:834–846. doi: 10.3171/jns.1986.65.6.0834. [DOI] [PubMed] [Google Scholar]
- Harrison RV, Harel N, Panesar J, Mount RJ. Blood capillary distribution correlates with hemodynamic-based functional imaging in cerebral cortex. Cereb Cortex. 2002;12:225. doi: 10.1093/cercor/12.3.225. [DOI] [PubMed] [Google Scholar]
- Cassot F, Lauwers F, Fouard C, Prohaska S, Lauwers-Cances V. A novel three-dimensional computer-assisted method for a quantitative study of microvascular networks of the human cerebral cortex. Microcirculation. 2006;13:1–18. doi: 10.1080/10739680500383407. [DOI] [PubMed] [Google Scholar]
- Lauwers F, Cassot F, Lauwers-Cances V, Puwanarajah P, Duvernoy H. Morphometry of the human cerebral cortex microcirculation: general characteristics and space-related profiles. Neuroimage. 2008;39:936–948. doi: 10.1016/j.neuroimage.2007.09.024. [DOI] [PubMed] [Google Scholar]
- Tata DA, Anderson BJ. A new method for the investigation of capillary structure. J Neurosci Methods. 2002;113:199–206. doi: 10.1016/s0165-0270(01)00494-0. [DOI] [PubMed] [Google Scholar]
- Nishimura N, Schaffer CB, Friedman B, Lyden PD, Kleinfeld D. Penetrating arterioles are a bottleneck in the perfusion of neocortex. Proc Natl Acad Sci. 2007;104:365. doi: 10.1073/pnas.0609551104. [DOI] [PMC free article] [PubMed] [Google Scholar]
- Weber B, Keller AL, Reichold J, Logothetis NK. The microvascular system of the striate and extrastriate visual cortex of the macaque. Cereb Cortex. 2008;18:2318. doi: 10.1093/cercor/bhm259. [DOI] [PubMed] [Google Scholar]
- Murray CD. The physiological principle of minimum work: I. The vascular system and the cost of blood volume. Proc Natl Acad Sci USA. 1926;vol 12:207–214. doi: 10.1073/pnas.12.3.207. [DOI] [PMC free article] [PubMed] [Google Scholar]
- Pries AR, Secomb TW. Microvascular blood viscosity in vivo and the endothelial surface layer. Am J Physiol Heart Circ Physiol. 2005;289:H2657–H2664. doi: 10.1152/ajpheart.00297.2005. [DOI] [PubMed] [Google Scholar]
- Pries AR, Secomb TW, Gaehtgens P, Gross JF. Blood flow in microvascular networks. Experiments and simulation. Circ Res. 1990;67:826. doi: 10.1161/01.res.67.4.826. [DOI] [PubMed] [Google Scholar]
- Safaeian N. Computational Modelling of Capillaries in Neuro-Vascular Coupling [PhD thesis] University of Canterbury: Christchurch, New Zealand; 2013. [Google Scholar]
- Zweifach BW. Quantitative studies of microcirculatory structure and function: I. Analysis of pressure distribution in the terminal vascular bed in cat mesentery. Circ Res. 1974;34:841. [PubMed] [Google Scholar]
- Goldman D, Popel AS. A computational study of the effect of capillary network anastomoses and tortuosity on oxygen transport. J Theor Biol. 2000;206:181–194. doi: 10.1006/jtbi.2000.2113. [DOI] [PubMed] [Google Scholar]
- McGoron AJ, Nair P, Schubert RW. Michaelis-Menten kinetics model of oxygen consumption by rat brain slices following hypoxia. Ann Biomed Eng. 1997;25:565–572. doi: 10.1007/BF02684195. [DOI] [PubMed] [Google Scholar]
- Hellums J, Nair P, Huang N, Ohshima N. Simulation of intraluminal gas transport processes in the microcirculation. Ann Biomed Eng. 1995;24:1–24. doi: 10.1007/BF02770991. [DOI] [PubMed] [Google Scholar]
- Secomb T, Hsu R. Simulation of O2 transport in skeletal muscle: diffusive exchange between arterioles and capillaries. Am J Physiol Heart Circ Physiol. 1994;267:H1214. doi: 10.1152/ajpheart.1994.267.3.H1214. [DOI] [PubMed] [Google Scholar]
- Reglin B, Secomb TW, Pries AR. Structural adaptation of microvessel diameters in response to metabolic stimuli: where are the oxygen sensors. Am J Physiol Heart Circ Physiol. 2009;297:H2206. doi: 10.1152/ajpheart.00348.2009. [DOI] [PMC free article] [PubMed] [Google Scholar]
- Lipowsky HH. Microvascular rheology and hemodynamics. Microcirculation. 2005;12:5–15. doi: 10.1080/10739680590894966. [DOI] [PubMed] [Google Scholar]
- Vafaee MS, Gjedde A. Model of blood-brain transfer of oxygen explains nonlinear flow-metabolism coupling during stimulation of visual cortex. J Cereb Blood Flow Metab. 2000;20:747–754. doi: 10.1097/00004647-200004000-00012. [DOI] [PubMed] [Google Scholar]
- Wey HY, Wang DJ, Duong TQ. Baseline CBF, and BOLD, CBF, and CMRO2 fMRI of visual and vibrotactile stimulations in baboons. J Cereb Blood Flow Metab. 2010;31:715–724. doi: 10.1038/jcbfm.2010.154. [DOI] [PMC free article] [PubMed] [Google Scholar]
- Fox PT, Raichle ME. Focal physiological uncoupling of cerebral blood flow and oxidative metabolism during somatosensory stimulation in human subjects. Proc Natl Acad Sci. 1986;83:1140. doi: 10.1073/pnas.83.4.1140. [DOI] [PMC free article] [PubMed] [Google Scholar]
- Fox PT, Raichle ME, Mintun MA, Dence C. Nonoxidative glucose consumption during focal physiologic neural activity. Science. 1988;241:462. doi: 10.1126/science.3260686. [DOI] [PubMed] [Google Scholar]
- Yamaguchi H, Fukuyama H, Nagahama Y, Nabatame H, Shio H. Cerebral hemodynamics and risk for recurrent stroke in symptomatic internal carotid artery occlusion. Rinsho Shinkeigaku. 1999;39:513. [PubMed] [Google Scholar]
- He X, Yablonskiy DA. Quantitative BOLD: mapping of human cerebral deoxygenated blood volume and oxygen extraction fraction: default state. Magn Reson Med. 2007;57:115–126. doi: 10.1002/mrm.21108. [DOI] [PMC free article] [PubMed] [Google Scholar]
- Peppiatt CM, Howarth C, Mobbs P, Attwell D. Bidirectional control of CNS capillary diameter by pericytes. Nature. 2006;443:700–704. doi: 10.1038/nature05193. [DOI] [PMC free article] [PubMed] [Google Scholar]