

Abstract
Aims: Here we report that chromatin, the complex and dynamic eukaryotic DNA packaging structure, is able to sense cellular redox changes. Histone H3, the only nucleosomal protein that possesses cysteine(s), can be modified by glutathione (GSH). Results: Using Biotin labeled glutathione ethyl ester (BioGEE) treatment of nucleosomes in vitro, we show that GSH, the most abundant antioxidant in mammals, binds to histone H3. BioGEE treatment of NIH3T3 cells indicates that glutathionylation of H3 is maximal in fast proliferating cells, correlating well with enhanced levels of H3 glutathionylation in different tumor cell lines. Furthermore, glutathionylation of H3 in vivo decreases in livers from aged SAMP8 and C57BL/6J mice. We demonstrate biochemically and by mass spectrometry that histone variants H3.2/H3.3 are glutathionylated on their cysteine residue 110. Furthermore, circular dichroism, thermal denaturation of reconstituted nucleosomes, and molecular modeling indicate that glutathionylation of histone H3 produces structural changes affecting nucleosomal stability. Innovation: We characterize the implications of histone H3 glutathionylation in cell physiology and the modulation of core histone proteins structure affected by this modification. Conclusion: Histone H3 senses cellular redox changes through glutathionylation of Cys, which increases during cell proliferation and decreases during aging. Glutathionylation of histone H3 affects nucleosome stability structure leading to a more open chromatin structure. Antioxid. Redox Signal. 19, 1305–1320.
Introduction
The basic repeating unit of chromatin, named nucleosome, is constituted by 147 base pairs of DNA wrapped around a histone octamer. Nucleosomes contain two copies of each of the core histone proteins H2A, H2B, H3, and H4. Each protein has both a histone fold domain, which mediates the histone-histone and histone-DNA interactions that are crucial for the assembly of the nucleosome core particle and a tail domain, which protrudes from the nucleosome core particle (14). Mainly this flexible tail region is susceptible to post-translational modifications (PTMs).
Innovation.
The work presents glutathione, a physiological antioxidant, as a new structural factor in the architecture of chromatin, connecting cell proliferation with histone H3 glutathionylation. Glutathionylation of H3 increases in cancer cells, and decreases in aging. Functionally, glutathionylation of H3 serves as an opening agent for nucleosomes, which in turn, might assist replication.
Glutathionylation of H3 opens up a new field of investigation with potential involvement in epigenetics, redox changes, and cell cycle regulation, underscoring its role in genomic instability and its possible consequences in disease and aging.
Chromatin can be classified into two structural distinct forms, an open structure called euchromatin that is permissive for transcription and a compacted and largely repressive form, called heterochromatin. This compacted chromatin can be further subdivided into constitutive and facultative heterochromatin. The former is always compacted and present genes are silenced, whereas genes in the latter structure are transcriptionally repressed only at certain times.
The mechanisms by which chromatin structures can be dynamically changed are fundamental for processes, such as DNA replication, repair, recombination, and transcription. The introduction of covalent modifications (such as e.g., acetylation, methylation, phosphorylation) in histones can alter chromatin structure. These modifications introduced by different enzymes constitute “the histone code” (24, 55). More than 70 different histone modification sites and eight types of histone PTMs have been reported using different approaches, such as mass spectrometry (MS), antibody-based detection techniques, and metabolic-labeling studies (4, 28). These marks are necessary for the proper execution of many cellular processes also, including metabolism. The important functional roles of these marks become apparent when looking at events leading to miswriting, misreading, and miss-erasing that most likely contribute to several human cancers [for a recent review see (9)].
Histone modifications have also been shown to be important for proper cell cycle progression (63). Regulation of S phase depends on chromatin fibre loosening in front of the replication fork and the rapid assembly of nascent DNA strands with core histones. Both DNA and canonical histone synthesis occur simultaneously to ensure the required supply of all histones. The mechanism of histone deposition onto newly synthesized DNA is still an open question. It was proposed that the H3-H4 tetramer is first deposited followed by the binding of two histone H2A-H2B dimers (46). However, more recent results indicate that H3.3-H4 incorporation occurs as dimers with the majority of the splitting tetramer events during DNA replication (66).
In a previous report, we described that the level of nuclear glutathione (GSH), the most important nonenzymatic antioxidant in eukaryotes, changes during cell cycle (33). Redox sensing mechanisms seem to play important nuclear roles and also act on chromatin. We have identified histone carbonylation as a PTM involved in histone detoxification after DNA synthesis (17). In addition, GSH appears as an essential molecule for controlling cell proliferation and organism development, in both mammalian and plant cells (12, 35, 42, 62).
All core histone proteins have variants counterparts, with the exception of histone H4 (21), and histone H3 variants (H3.1, H3.2 and H3.3, among others) constitute one of the most representative family. The extent of H3 oxidation/reduction in vivo and the role of cysteine (C) 110, as well as C96 in the special case of H3.1, during chromatin-related processes is not well understood. In the “H3 barcode hypothesis” it was proposed that histone H3 variants might play a major role in cell differentiation and cell lineage restriction (21). Specifically, it was hypothesized that the unique cysteines in H3 variants might be important for nucleosomal and chromatin higher-order structures, and for their interaction with specific chaperones through distinct intra- or inter-molecular disulphide bridges. Thus, glutathionylation of histones, the interaction of histone–SH groups with GSH might be important for normal cell function. Recently, de Luca et al. (11) reported the glutathionylation of H3 and showed that it increases the susceptibility of MCF7 human breast cancer cells to doxorubicin treatment.
Here we describe and characterize the glutathionylation of histone H3 in vitro and in mammalian tissue cell cultures. H3 glutathionylation levels are higher in proliferating cells, decreasing when cells are confluent. In addition, histone H3 proteins isolated from tumor cell lines are more glutathionylated than H3 from noncancer cells. Furthermore, we show evidence that this process takes place in vivo using a senescent SAMP8, as well as aged C57BL/6J mice strains. Interestingly, H3 glutathionylation seems to directly influence chromatin structure through nucleosome destabilization as we can show by circular dichroism (CD), melting temperature, and in silico analyses. Our results points out a new role for nuclear GSH in the regulation of chromatin structure.
Results
Histone H3 is glutathionylated in vitro
To study the potential susceptibility of histone H3 to glutathionylation, we used pure calf thymus core histones. Proteins were treated with different concentrations of S-nitrosoglutathione (GSNO). GSNO induces glutathionylation in different proteins, such as alcohol dehydrogenase, glycerol-3-phosphate dehydrogenase, NF-κB, glycogen phosphorylase b, and carbonic anhydrase I (27, 45, 58).
As illustrated in Figure 1A, the amount of free cysteine in H3 quantified by 5,5′-Dithiobis-(2-nitrobenzoic acid) (DTNB) changes after GSNO treatment. Addition of increasing concentrations of GSNO to core histone preparations causes a significant reduction in the absorbance of the reaction product 2-nitro-5-thiobenzoic acid (TNB), indicating a decrease in free cysteine in histone H3. To evaluate disulfide bridge formation between two H3 histones being formed, we performed SDS-PAGE electrophoresis under nonreducing conditions followed by Coomassie staining and an immunoblot with an anti-H3 antibody. We did not find an increase in the amount of H3 dimers, suggesting that an increase of disulfide bounds between two H3 histones does not take place under our experimental conditions (Fig. 1A, inset). These observations indicate that, the decrease of free cysteines is due to histone H3 glutathionylation in vitro.
FIG. 1.

Chemical analysis of cysteine reactivity in histone H3. The number of free cysteine residues decreases with increasing concentrations of GSNO without dimer formation. (A) Titration of calf thymus histones with different concentrations of GSNO to detect free cysteine residues in histone H3. Detection of free cysteine residues was performed using DTNB, absorbance of TNB product was recorded at 420 nm. Results are expressed as means±standard deviation (SD) of five independent experiments. The statistical significance is expressed as: *p<0.05; **p<0.01; ***p<0.005 versus 0 μM GSNO. Inset: Immunoblot to evaluate monomeric and dimeric histone H3 from calf thymus after incubation with different amounts of GSNO (see A) using nonreducing conditions. (B) Immunoblot analysis of BioGEE treated core histone proteins from calf thymus using HRP-streptavidin (top) and anti-H3 antibodies (bottom). The experiments were carried out under nonreducing (left) and reducing (right) conditions, as indicated by the absence or presence of β-mercaptoethanol. BioGEE, biotinylated glutathione ethyl ester; DTNB, 5,5′-dithiobis-(2-nitrobenzoic acid); GSNO, S-nitrosoglutathione; TNB, 2-nitro-5-thiobenzoic acid.
To confirm the susceptibility of H3 to glutathionylation we again utilized isolated pure calf thymus core histones. These proteins were treated with biotinylated glutathione ethyl ester (BioGEE) (Supplementary Fig. S1, inset; Supplementary Data are available online at www.liebertpub.com/ars), a synthetic molecule that is used to detect protein glutathionylation in vitro. Before BioGEE addition, histones were incubated or not with H2O2 (to produce reactive cysteines) in the absence or presence of β-mercaptoethanol, thereby generating oxidant, nonoxidant, and reducing conditions, respectively. Such a H2O2 treatment contributes to generate reactive Cys and oxidize BioGEE; thus, facilitating glutathionylation reactions. As expected, only BioGEE treatment of histone under nonoxidant and oxidizing, but not reducing, conditions (absence of β-mercaptoethanol) led to the appearance of a band around 17 kDa in immunoblots with streptavidin-HRP (Fig. 1B). These data suggest that histone H3 is indeed glutathionylated, as the biotin signal determined with streptavidin-HRP has the molecular weight of histone H3. Moreover, we established that with both treatments, with or without H2O2, the same amount of H3 glutathionylation can be attained, indicating that histone Cys are reactive to glutathionylation. In agreement, reducing conditions (treatment with β-mercaptoethanol), that are expected to remove BioGEE moieties from modified cysteines, prevented H3 glutathionylation.
On the other hand, we performed MALDI-TOF analysis of histone core from calf thymus incubated with BioGEE, observing that H3 ionization capability changed after reaction with BioGEE (Supplementary Fig. S2), suggesting a new specie formed.
Histone H3 is glutathionylated in living cells in a proliferation-dependent manner
Since we previously showed that the nuclear GSH level differs between cell cycle stages and, changes in the pattern and level of protein glutathionylation occur in mammalian and plant cells (12, 33, 35, 42, 62); we next wondered whether histone H3 could also be glutathionylated in cells and whether this modification event is related to cell proliferation and nuclear GSH. First, we characterized the nuclear GSH levels in NIH3T3 fibroblasts during cell proliferation by image-in-flow cytometry using 5-chloromethylfluorescein diacetate (CMFDA) as a fluorescent probe. In accordance with our previous results, we observed that nuclear GSH level increases when cells are highly proliferative (Supplementary Fig. S3 and Supplementary Table S1). Next, we set out to determine the glutathionylation capability of proliferating cells by using BioGEE as marker reagent. To control any possible negative effects of BioGEE on the cell cycle, we analyzed the DNA synthesis profile of treated and nontreated NIH3T3 fibroblasts by measuring BrdU incorporation. Both control and BioGEE treated cells showed a similar proliferation rate (Fig. 2A, top). In addition, we determined changes in the level of the proliferation cell nuclear antigen, proliferating cell nuclear antigen (PCNA) that is overexpressed during DNA synthesis (Fig. 2A, bottom). Regardless of the presence or absence of BioGEE in the medium the maximal amount of PCNA was reached between 24–48 h of cell culture, just when cells are in the exponential proliferation phase. In summary, BioGEE-treatment does not impair cell proliferation and is therefore, a suitable reagent to analyze a potential correlation between cell cycle and histone H3 glutathionylation.
FIG. 2.

Analysis of histone H3 glutathionylation during cell proliferation. Glutathionylation of histone H3 increases during cell proliferation. (A) DNA synthesis rates for control (nontreated) and BioGEE (250 μM) treated NIH3T3 fibroblasts determined by BrdU incorporation assay (top). Immunoblot analysis of PCNA protein expression at 6, 24, 48, and 120 h of cell culture using total protein extracts from control and BioGEE treated NIH3T3 fibroblasts (bottom). Equal loading was controlled using anti-tubulin antibody in the immunoblots. The statistical significance is expressed as *p<0.05 between compared groups. (B) Changes in biotin-glutathionylated nuclear proteins during cell proliferation. Coomassie blue staining of SDS-PAGE gel containing nuclear proteins from Bio-GEE treated NIH3T3 fibroblasts harvested at different culture time points, used as loading control (top). Immunoblot using streptavidin-HRP to detect nuclear glutathionylated proteins (bottom). Notice a 15 kDa band corresponding to the size of histone H3 is observed (see arrow). (C) Analysis of glutathionylated proteins and H3 expression during NIH3T3 proliferation. Immunoblots of nuclear extracts from NIH3T3 cells incubated with either, anti-GSH or anti-H3 antibodies under nonreducing (left) and reducing conditions (right). (D) Free cellular NAD+/NADH ratios during cell cycle in NIH3T3 cells as cellular redox marker. The statistical significance is expressed as *p<0.05 between compared groups. GSH, glutathione; PCNA, proliferating cell nuclear antigen.
To determine a potential proliferation-coupled glutathionylation susceptibility of proteins in mammalian cells, we incubated NIH3T3 fibroblasts with BioGEE for various time points and obtained nuclear proteins extracts. Those were separated by 15% SDS-PAGE and either stained with Coomassie as loading control or immunoblotted with streptavidin-HRP to determine changes in the level of protein glutathionylation (Fig. 2B). The biotin signal of BioGEE increased at 6, 24, and 48 h of cell culture; with a marked reduction seen in samples prepared after 120 h. Interestingly, we also observed a ∼15 kDa band that coincides with the expected molecular weight of histone H3. The intensity of this band changed during the cell cycle in a similar fashion to other nuclear proteins. This intensity increased at 24 and 48 h and considerably diminished at 120 h, just when cells reached confluency.
To evaluate the possibility of histone glutathionylation, we generated nuclear lysates of cells in different stages of cell proliferation, and performed a similar immunoblot under nonreducing conditions to estimate the amounts of in vivo glutathionylated proteins during cell proliferation. Here we did not include any BioGEE treatment, but instead used an antibody against endogenous glutathionylated proteins and an anti-H3 antibody to identify histone H3 in the immunoblot. Besides many glutathionylated nuclear proteins, we again observed a glutathionylated protein of a molecular weight of 15 kDa that coincided with the size of histone H3 (Fig. 2C). In addition, we detected a putative dimer band of H3 (∼30 kDa) under nonreducing conditions, where the respective GSH signal increased at 24 and 48 h of cell culture (Fig. 2C). These time points showed the highest nuclear GSH levels in NIH3T3 cells (see Supplementary Fig. S3). These results correlate with a more reduced redox profile, as suggested by the NAD+/NADH ratio (Fig. 2D) opening the possibility that glutathionylation of histone H3 occurs in a reduced redox environment, just when cells increase DNA synthesis.
Histone H3 variants are glutathionylated in NIH3T3 fibroblasts and cancer cells
To specify that the observed GSH signal at 15 kDa indeed corresponds to a modified histone H3 and not any other protein of the same molecular weight, histone proteins were isolated using a histone purification Kit (Active Motif), and reverse phase high performance liquid chromatography (RP-HPLC) procedures. Using this method, a further separation of proteins and histones from different families (H3, H4, H2A, and H2B) can be achieved. The different fractions were then analyzed for protein content by Coomassie staining (Fig. 3A, top) and immunoblots with anti-H3 antibody and streptavidin-HRP to detect the biotin signal of BioGEE (Fig. 3A, bottom). In agreement with our previous data, we observed a reproducible streptavidin-HRP signal of the appropriate size only in H3-containing fractions that originated from BioGEE-treated cells (lane 9). This result strongly suggests that histone H3 is glutathionylated.
FIG. 3.

Glutathionylation of histone H3 variants. (A) Analysis of glutathionylated histones. Coomassie blue-stained SDS-PAGE gel of collected fractions from RP-HPLC-purified histones from NIH3T3 fibroblasts treated with BioGEE (top). The locations of the separated core histone proteins H3 (*), H2A/H2B (♦) and H4 (●) are noted. Immunoblot of same samples using an antibody against histone H3 and streptavidin conjugated with horseradish peroxidase (bottom). Lanes 1, 3, 6, and 8 correspond to H2A/H2B purified fractions and lanes 2, 4, 7, and 9 correspond to H3/H4 purified fractions. Lane 5 contains the marker. The asterisk indicates band corresponding to the biotin-signal of BioGEE bound to histone H3. (B) 2D-TAU immunoblot with acid extracted histones from 24 h cultured NIH3T3 cells incubated with BioGEE. After TAU first dimension, histones were separated in 15% SDS-PAGE second dimension. Afterwards, the membrane was incubated with streptavidin-HRP (bottom). Locations of distinct histone variants are indicated in Coomassie gel (top). RP-HPLC, reverse phase high performance liquid chromatography; TAU, triton acid urea.
Next, we wondered if mammalian histone H3 variants (H3.1, H3.2, and H3.3) from BioGEE treated cells were glutathionylated. So, we used nonreducing 2D-triton acid urea (TAU) gels that allow the separation of histone variants (53) (Fig. 3B, top). Streptavidin-HRP was used to visualize H3 glutathionylation demonstrating that all H3 variants were glutathionylated, albeit to a different extend (Fig. 3B, bottom). H3.1 showed the lowest, whereas H3.2 and H3.3 showed highest levels of streptavidin-HRP signals. In summary, our data support the notion that all histone H3 variants are glutathionylated in mammalian cells.
Next, we studied whether histone H3 glutathionylation occurs in cancer cells. We used two established high proliferative human cancer cell lines, HeLa (cervix cancer) and MDA-MB-468 (breast cancer), as well as two human primary fibroblast lines, HF1 and HF2. All cell lines were cultured to reach 80%–90% of confluency. Acid-extracted histones were then analyzed by Coomassie staining or immunoblotting using an anti-GSH antibody. Interestingly, we observed GSH signals only in both cancer cell lines, but not in confluent human fibroblasts cell lines (Fig. 4A). As observed in previous experiments, we again detected GSH signals corresponding to histone H3, strongly supporting the hypothesis that this particular histone is glutathionylated in proliferating cells, which have higher cellular GSH levels than confluent cells (Fig. 4B).
FIG. 4.

High proliferative cancer cells show higher GSH levels and glutathionylated H3 than normal fibroblasts. Gene transcription of proliferation related genes is affected when GSH is depleted. (A) Immunoblots of histone extracts from HeLa and MDA-MB-468 tumor cell lines and normal human fibroblasts (HF1 and HF2) incubated with anti-GSH and anti-H3 antibodies under nonreducing conditions. (B) GSH cellular levels in tumor and normal cells determined by GSH S-transferase assay. (C) GSH levels in NIH3T3 cells at 24 h after GSH depletion by DEM treatment by GSH S-transferase assay. (D) DNA synthesis rates for control (nontreated) and DEM treated NIH3T3 cells at 24 h of cell culture. (E) Immunoblot analysis of glutathionylated histones showing the band corresponding to H3 (top) and the replication-dependent H3.1 after GSH depletion by DEM in NIH3T3 at 24 h of cell culture. Equal loading was controlled using anti-H3 antibody in the immunoblot (bottom). (F) Relative expression levels of HIST1H3A, PCNA, and Id2 genes by qRT-PCR after GSH depletion using DEM (GAPDH expression was used for normalization). The statistical significance is expressed as: *p<0.05, #p<0.05, &p<0.05 between compared groups. DEM, diethyl maleate.
Histone H3 glutathionylation and expression of replication-dependent genes are affected by GSH depletion
Since we observed that histone H3 glutathionylation levels increased during cell proliferation, we wondered if depletion of GSH alters histone glutathionylation and also affects replication-dependent (RD) gene expression in NIH3T3 cells. Thus, we depleted GSH using diethyl maleate (DEM) at 24 h of cell culture (Fig. 4C). Our results indicated that GSH depletion decreases DNA synthesis (Fig. 4D), confirming our previously published results (35). The present results correlate with low levels of histone H3 glutathionylation and H3.1 variant (Fig. 4E). Furthermore, it leads to the downregulation of PCNA, Id2, and the RD variant H3.1 gene expression measured by qRT-PCR (Fig. 4F), and also to low levels of the proteins codified by these genes (Supplementary Fig. S4).
Identification of glutathionylation of histone H3 variants by MS
Having obtained evidence using biochemical approaches that mammalian histone H3 variants were glutathionylated in proliferating cells, we sought to confirm our results with an alternative method. Using a MS based approach we set out to identify the presence of GSH on histone H3 with the subsequent determination of the residue used for this modification. After incubation of NIH3T3 cells with BioGEE for 24 h, histones were acid extracted and histone H3 variants (H3.1, H3.2 and H3.3) separated by a RP-HPLC (see Supplementary Fig. S5). RP-HPLC fractions were collected, concentrated and the addition of BioGEE to histone H3 was verified by immunoblot, analyzing the biotin signal under reducing and nonreducing conditions (data not shown). Afterwards, confirmed samples were digested using Asp-N endopeptidase and analyzed by MS. The use of Asp-N as peptidase enabled us to identify one peak at 2582.3 m/z for H3.2/H3.3 (see Supplementary Fig. S6 and Supplementary Table S2) or 2583.5 m/z for H3.1 (see Supplementary Fig. S7 and Supplementary Table S2) corresponding to C110 containing peptides (DTNLCAIHAKRVTIMPK) modified by BioGEE. In addition, we also detected a specific peak located at 2569.5 m/z corresponding to the H3.1-BioGEE peptide, in which a methyl group may have been released (probably from the acetyl group of the BioGEE molecule). An additional peak was found at 2565.25 m/z, that has been assigned to the H3.1-BioGEE peptide, in which, H2O was lost (see Supplementary Fig. S7, and Supplementary Table S2). However, a C96 containing peptide from histone H3.1 could not be identified using this approach.
The identification of these peaks with the mass assigned to BioGEE incorporation to (DTNLCAIHAKRVTIMPK) peptide in H3.1 and H3.2/H3.3 variants enabled us to design the strategy to study glutathionylation of histone H3 under reducing and non reducing conditions.
In that way, GSH might be able to establish a labile bond between its cysteine and the C110 residue present in the histone H3 variants, giving rise to peptide DTNLCBioGEEAIHAKRVTIMPK. Thus, we decided to analyze the specificity of the BioGEE peak using DTT as a reducing agent. These conditions should break down the BioGEE-C110 producing sulphydryl groups and thereby, strengthening our data in support of an in vivo glutathionylation of C110 in histone H3.
Thus, we treated our Asp-N digested samples with DTT and monitored C110-containing peptides by MS. Results in Figure 5A and B show the peaks obtained for BioGEE-H3.2/H3.3 and H3.2/H3.3 C110 containing peptides, respectively, in nonreducing (top) and reducing (bottom) conditions. We observed a direct inverse correlation in the peak intensities between BioGEE containing and unmodified H3.2/H3.3 peptides (106–122) before and after DTT treatment. Furthermore, we observed a peptide at 2596.4 m/z that corresponds to a BioGEE modified peptide with an additional monomethylation of K122.
FIG. 5.

MALDI-TOF mass analysis of C110-containing peptides from H3.2/H3.3 fraction using nonreducing and reducing conditions. Cysteine 110 from H3 isoforms H3.2 and H3.3 binds to GSH. H3.2/H3.3 fractions were obtained by RP-HPLC (A) Evaluation of 2582.4 m/z (BioGEE-H3.2/H3.3; peptide 106–122; DTNLCBioGEEAIHAKRVTIMPK) peak intensity before and after reduction of BioGEE-H3.2/H3.3 sample. Upper: nonreduced BioGEE sample; Lower: BioGEE reduced sample. (B) Evaluation of 1911 m/z (peptide 106–122; DTNLCAIHAKRVTIMPK) peak intensity before and after reduction of BioGEE-H3.2/H3.3 sample. Upper: nonreduced BioGEE sample; Lower: BioGEE reduced sample.
Although monomethylation of K122 has been previously described in human HEK293 cells (18, 22), it has not been found, as far as we know, in mouse histone H3. However, having shown that this mark also exists in mouse cells, this particular peptide (DTNLCAIHAKRVTIMPKMe) allowed us the identification of BioGEE addition to C110. As predicted, under reducing conditions, the intensity of the 2596.4 m/z peak decreased (Fig. 5A), suggesting that removal of this particular modification occurred. Furthermore, when we analyzed the corresponding peptide without BioGEE addition (peak at 1911.0 m/z, Fig. 5B, top) we observed an increase in its intensity after reduction with DTT (Fig. 5B, bottom) as a consequence of the enrichment of the aa 106–122 nonmodified peptide. These data independently confirm that glutathionylation of C110 in H3.2/H3.3 occurs in living mammalian cells, that agree with the 2D-TAU results observed in Figure 3B.
Taken together, we identified a disulphide bond between the cysteine from BioGEE and C110 present in all mammalian histone H3 variants and thus confirm glutathionylation modification in histone proteins, as recently was showed by de Luca et al. (11).
In vivo glutathionylation of histone H3
Having observed the glutathionylation of H3 in different cellular models of mammalian cells, we focused our attention on the physiological implications of histone glutathionylation in different in vivo models. Thus, we decided to evaluate changes in glutathionylated H3 levels during aging, a physiological condition in which GSH levels decrease. We used a mice strain with an accelerated senescence (SAMP8) and the aged C57BL/6J mice with physiological aging.
To study the levels of glutathionylated H3, we purified histones by acid extraction from liver tissue of both strains and analyze them by immunoblot. Our results indicate that glutathionylation of H3 is higher in younger than older SAMP8 and C57BL/6J mice, indicating that H3-glutathionylation decreases with aging (Fig. 6A, B). Furthermore, we analyzed the correlation of H3 glutathionylation with other PTMs in H3 related with chromatin conformation. Some PTMs have been shown to be altered during aging (40). Thus, we wonder if H3 glutathionylation correlates with some of these PTMs. Our results indicate that during aging H3K9ac decreases in both mice models. However, no differences were observed in H3K9me3 (Fig. 6A, B).
FIG. 6.
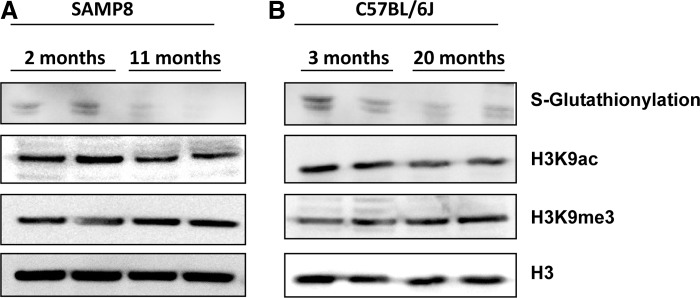
Age-related changes of post-translational modifications in SAMP8 and C57BL/6J mice models. Decreased acetylation of H3K9 when glutathionylation of H3 decreases in livers from SAMP8 and old C57BL/6J mice. Age-related changes of glutathionylated histone H3 and acetyl and tri-methyl histone H3 in Lys9 (H3K9ac and H3K9me3) determined by immunoblot in liver isolated histones obtained from (A) SAMP8 strain (2 and 11 months) and (B) C57BL/6J strain (3 and 20 months). Histones were acid extracted from liver tissue following the procedure described in methods and separated in a 15% SDS-PAGE electrophoresis using non reducing conditions. Histone H3 was used as loading control.
Glutathionylation of H3 affects nucleosome stability
To study any possible functional implications of histone H3 glutathionylation, we studied the effects of this modification on chromatin structure by CD (Fig. 7A) and sensitive DNA melting temperature procedures (Fig. 7B) in the presence and absence of GSH.
FIG. 7.

Thermal denaturation and circular dichroism (CD) experiments of reconstituted nucleosomes in the presence of GSH. (A) Representative CD curves for control histones from calf thymus (solid line), GSH treated (dotted line), and GSSG treated (dashed line) showing changes in the secondary structure of the nucleosomes. (B) Representative nucleosome melting temperature (Tm) profiles from nontreated histones plus type XV DNA (solid line) from calf thymus and GSH treated histones plus DNA (dashed line). Inset: Table containing the Tm values obtained from three independent experiments (mean±SD).
We analyzed the secondary structure of the histone core by CD, an excellent tool for rapid determination of the secondary structure and folding of proteins (19). Proteins with high content of α-helices have negative bands at 222 and 208 nm. However, proteins with β-sheets have a negative band at 218 nm. Results in Figure 7A for control histones showed the two characteristic bands of α-helices. Treatment with GSH increased the elipticity at 208 nm, and GSSG treatment clearly increased the values of negative bands at 208 and 222 nm, indicating the rearrangement of secondary structure of the nucleosome after treatment with reduced or oxidized GSH, demonstrating that GSH destabilizes nucleosomes.
In addition, Figure 7B shows a typical melting curve of the nucleosome denaturation process. Using control nucleosomal arrays containing untreated histones, we obtained a fusion temperature (Tm) of 77.2°C±4.2°C, a similar value as obtained by Lewis and Chiu (30). When we analyzed the fusion temperature of core histones-DNA complexes consisting of GSH treated histones we observed a decrease in the DNA melting temperature to 69.1°C±3.5°C and an increment in the slope of the curve, suggesting an altered nucleosomal stability. It is possible that treatment with GSH produced a quicker denaturation of nucleosomes. These results are in agreement with those of Lewis and Chiu (30), as they showed that mixed disulfide formation in C96 and/or C110 with sulfhydryl reagents destabilized the histone core (30).
In an effort to understand the possible structure of histone H3 after glutathionylation and the possible functional implications that this modification would have in the accommodation of H3 in the nucleosomal core and on chromatin folding, we used molecular modeling methods. Histone H3.1 from the 2CV5.pdb file corresponding to crystal structure of human nucleosome core particle (60) available in the protein data bank (PDB) was selected because it contains C96 and C110. Docking studies allow us to evaluate the implications of glutathionylation of both cysteines on histone H3. The model of modified histone H3 was obtained by docking together H3.1 and GSH. Interactions between H3.1 and the GSH molecule were estimated in terms of distances between different atoms. The individual elements in the complexes represent low energy models by themselves, since they have been energy minimized; in the case of the GSH molecule (Fig. 8A) or they are crystal structures in the case of the H3.1 variant. The final model has also been subjected to limited energy minimization, primarily to normalize the geometry.
FIG. 8.

In silico structure modelling of glutathionylated histone H3.1. The GSH molecule is able to modify conformation of histone H3. (A) Chemical structure of the GSH molecule obtained from the database resource for the National Center for Biotechnology Information. Structural models of histone H3.1 (blue figures) indicating the distances between cysteines and proximal residues of N-terminal tail for C110 (B) or C96 (C). Inserted figures in light purple show the disposition of GSH disulphide bond in glutathionylated (B) C110 or (C) C96 cysteines contained in α2-helix in relation to the N-terminal tail of H3.1.
The central histone-fold domains of all histone proteins are composed of a highly similar structure. The general secondary structure of histones consists of three α-helices in the histone-fold motif that are arranged in an antiparallel manner through the L1 loop of one in juxtaposition with the L2 loop of the other (32, 49). The N-terminal domain the histone H3 tail protrudes out of the nucleosome and is susceptible to PTMs. Binding of the GSH molecule to either C110 or C96 located in the more extended α2-helix showed different patterns for both cases. On the one hand, C110 glutathionylation produced particular structural changes to accommodate the GSH in the α2-helix because the antiparallel N-terminal α3-helix overlapped with the GSH molecule (Fig. 8B). Moreover, C96 can accommodate the GSH molecule on the α2-helix without considerable steric hindrance with the other α-helices (Fig. 8C). Furthermore, the glutathionylation of C110 alters the hydrogen bonds between both H3 histones (Supplementary Fig. S8).
According to these models and the physicochemical characterization by CD and Tm, our model suggests that Cys110 glutathionylation produces a greater change in the conformational structure of H3.1 than Cys96 glutathionylation.
Discussion
Chromatin is a cellular dynamic structure, which changes during the cell cycle and other cellular events. Many histone variants and their modifications can influence the state of chromatin compaction (24, 55). Some PTMs have been associated with redox related mechanisms. For example, Drake et al. demonstrated that the modification of histones by 4-hydroxynonenal (HNE) alters the binding of histones to the DNA (15). Histone carbonylation, as product of histone oxidation has been described as a DNA integrity protection mechanism by which histones can capture reactive oxygen species (52), and also as a mark for histone elimination by the nuclear proteasome (17). Furthermore, histone H3 nitration alters the nucleosome structure (13). de Luca et al. (11) showed how glutathionylation of H3 increases the susceptibility of MCF7 human breast cancer cells to doxorubicin treatment; probably by increasing the drug accessibility to the chromatin packed DNA, although they did not show how glutathionylation affects the structure of the nucleosomes and therefore, the chromatin.
In the present report, we provide biochemical and MS evidence that C110 in histone H3 is glutathionylated in mammalian cells depending on the nuclear GSH levels and cell preliferation. Furthermore, we found lower levels of H3 glutathionylation in liver from old SAMP8 and C57BL/6J mice. Finally, our data show how this modification produces changes the structure of the nucleosome.
The association between PTMs and their effects on chromatin structure has been explained by the “histone code hypothesis” (24, 55). Even small changes in the sequence between histone members might have an impact on their particular PTM signature (24, 55). For example, H3.3 contains S31, A87, I89, and G90, while H3.2 replaces these positions with A31, S87, V89, M90. H3.1, and H3.2 differ only in one amino acid C96 in H3.1 instead of S96 in H3.2. The variant H3.3 is enriched in PTMs associated with gene activation, and is placed in transcriptionally active domains (25, 36). On the other hand, H3.2 is enriched in PTMs linked to gene silencing (10, 22), and H3.1 is enriched with PTMs associated with gene activation and gene silencing marks (22, 29). Histone variants may play a role in establishing gene-expression profiles exhibited by a particular cell type at a particular time point (21).
It has long been speculated that histones, in particular H3, might have the potential to “sense” changes in redox states through their cysteine residues (43). However, so far very few studies have actually addressed this question because of the challenging technical requirements. Early studies developed by Prior et al. (47) and Lewis and Chiu (30) demonstrated the distinct reactivity of H3 cysteines with sulfhydryl reagents. Cysteines were exposed in euchromatic regions and could form disulfide bonds with these reagents. In heterochromatin, cysteine residues did not react, indicating that these cysteines are deeply buried in the macromolecule (47). Our in vitro studies using either spectrophotometric or biochemical measurements (Fig. 1A, B) and the recent report of de Luca and co-workers (11) strongly suggest that glutathionylation of histone H3 occurs.
Another possibility is that nuclear redox states are recognized through the generation of disulfide bonds. Although the occurrence of cysteine oxidation (C96 and C110) in living cells and their putative functional implications remain to be elucidated, several hypothetical possibilities exist. These include inter-nucleosome disulfide bonds between C96, intra-H3 disulfide bond inside one nucleosome and disulfide bridges between H3 and other proteins (21). Wood et al. proposed disulfide bond formation between two histone H3 molecules in oxidant conditions. However, crystal structure analyses did not show the existence of disulphide bounds between H3 histone in this situation (65). Similar results could be deduced after evaluation of H3 amounts (in monomer or dimer forms) in our GSNO experiments (Fig. 1A, inset).
It is well known that transcriptionally active chromatin is replicated in early S-phase, whereas heterochromatin is replicated in late S-phase (37). Previous results published by us showed changes in the concentration and location of GSH during cell cycle (33). Therefore, when we characterized the distribution of GSH in NIH3T3 fibroblasts, we observed a GSH concentration into the nucleus in the early phases of cell proliferation. However, this ratio decreased when cells reached confluence (33). The fluctuations in the intracellular redox state during cell cycle progression may represent a mechanism linking oxidative metabolic and cellular processes to cell cycle regulatory pathways (38), as seen for histone carbonylation after DNA synthesis (17). We also observed by image-in-flow cytometry using CMFDA as a fluorescent probe that levels of nuclear GSH were high during maximal cell proliferation (Supplementary Fig. S3 and Supplementary Table S1). These changes in nuclear GSH levels are related to modifications in the compaction state of chromatin, and probably in the control of the replication process of different chromatin forms (17, 34, 35, 41, 42). For example, previous results have shown the repression of Id2 expression in rat liver by chromatin compaction after GSH depletion using an acetaminophen overdose (44).
The incubation of NIH3T3 cells with BioGEE, histone extraction at cell proliferating times and purification of distinct histone fractions using affinity columns or RP-HPLC procedures, allowed us to resolve that the histone H3 variants (H3.1, H3.2, and H3.3) can be glutathionylated (Fig. 3A, B). Interestingly, we observed that cancer cells, with high proliferative capability had higher GSH levels and showed more histone glutathionylation than normal fibroblasts (Fig. 4A, B). Further results implied that GSH levels are involved in cell proliferation (Fig. 4C), affecting the regulation of RD gene expression, such as PCNA, Id2, and RD H3.1 (Fig. 4E).
Thus, this PTM modulated by GSH levels and the cellular redox state (as observed by NAD+/NADH ratio; Fig. 2) in proliferating cells, probably connects this PTM with S phase and chromatin assembly/disassembly with redox-sensing mechanisms.
Furthermore, we found H3 glutathionylation in histone extracts from liver in young SAMP8 and C57BL/6J mice (Fig. 6A, B). The results agree with the report of Iakova et al. (23). They observed higher proliferation in isolated hepatocytes from young animals compared with their old counterparts. The analysis of other PTMs in H3 indicated that decreased levels of glutathionylated H3 correlated with decreased levels of H3K9ac (Fig. 6A, B). These results agree with previous reports obtained by Kawakami et al. (26, 40).
The functional implications of glutathionylation of histone H3 are currently unknown, although our measurements of nucleosome stability and prediction of nucleosomal structure upon H3 C110 glutathionylation indicate its influence on chromatin structure. Since we observed changes in the secondary structure of the nucleosome after GSH treatment by CD analysis (Fig. 7A) and Tm (Fig. 7B), together with a predicted altered nucleosomal structure that impairs the accommodation of other histones (Fig. 8), we propose that glutathionylation leads to a relaxed histone octamer in which DNA is less tightly packed around the nucleosome. Thus, according to the present results, glutathionylation of H3 C110 can influence replication capacity and the replacement of histones. Interestingly, glutathionylation of H3 C110 produces considerable changes in the H3 structure since the accommodation of GSH in the α2-helix is proposed to overlap with the N-terminal α3-helix affecting intra-molecular interactions (6, 8, 32). In fact, it has been described that a C110E replacement in H3 destabilizes the H3-H3 hydrophobic four-helix bundle tetramer interface in vitro (1). Consequently, covalent modifications of cysteines change nucleosome stability and destabilize DNA-histone interactions. Therefore, we hypothesize that glutathionylation of H3 offers a new alternative mechanism for chromatin assembly-disassembly. On the other hand, although we do not have, at the moment, evidence for C96 glutathionylation, this residue could, in theory, accommodate the GSH molecule without drastic changes in H3 conformation.
The molecular and cellular effects produced by H3 glutathionylation in the putative regulation of chromatin packaging and unfolding remains to be elucidated. But our results indicate that histone H3 glutathionylation opens chromatin results that agree with with the observations of de Luca et al. (11). Several classic experiments already point towards the possibility that under certain circumstances the H3 C110 residue is accessible even in a nucleosomal context thereby allowing its reaction with some reagents. In hyperacetylated histones (5), when cells are in the active S-phase (54) or when the nucleosome “cores” change their conformation during transcription (47), H3 C110 has been shown to be more exposed.
Several reports suggest that oxidative stress and reactive oxygen species may produce epigenetic changes (16, 48), although the importance and real involvement of such reactions in physiological or pathological situations may be clarified in the next years.
The present report provides clear evidence that mammalian histone H3 variants are glutathionylated on C110 using independent techniques: biochemical methods and MS analyses.
A number of fascinating questions arise in light of the present results and will be the focus of future, technically challenging, experiments. It is of great interest to further evaluate quantitatively whether all H3 variants are equally glutathionylated and whether this novel modification is also present in highly condensed heterochromatin. Furthermore, although we did not directly detect a C96 modification in the present study, it is possible that this mark was missed because of methodological and detection limitations and more sensitive MS studies will hopefully shed light on the possible modification of this residue as well.
Methods
Chemicals and cell culture reagents
Sulfo-NHS-LC-Biotin was obtained from Pierce. Sodium bicarbonate and ammonium bicarbonate, GSNO, glutathione ethyl ester (GEE), 7-chloro-4-nitrobenzo-2-oxa-1,3-diazol (Cl-NBD), DTNB, calf thymus histones type-II and calf thymus DNA type-XV were obtained from Sigma-Aldrich. Molecular weight of histone H3 for calculations was obtained by MALDI-TOF.
Dulbecco's modified Eagle's medium (DMEM), and DMEM/F12, fetal calf serum (FCS), nonessential amino acids and antibiotics (penicillin, streptomycin) were provided by Invitrogen. NIH3T3 fibroblasts, HeLa cells, MDA-MB-468 breast cancer cell line and two human fibroblasts cell lines (HF1 and HF2) were obtained from female and male healthy volunteers (Cell Repository of INCLIVA, Valencia) and used in the study. Proliferation of cell lines was determined with the “Cell proliferation ELISA BrdU colorimetric assay” from Roche.
H3 glutathionylation experiments: Reaction of core histones from calf thymus with GSNO
Histones from calf thymus type-II were prepared using denaturing buffer (30 mM Tris-HCl, 3 mM EDTA, urea 10 M). Theoretically, about 19% of histones are H3 (50). With the experimental mass of histone H3 of 15,324 m/z obtained by MALDI-TOF MS, we calculated the theoretical concentration of free cysteine in the histone core. Glutathionylation reactions of H3 were carried out by incubating 1 mg of prepared core histone with 75, 169, 338 and 500 μM of GSNO for 1 h in darkness at room temperature. To evaluate the amounts of histones (in monomer and dimer form), after GSNO treatment, immunoblot with H3 antibody was applied.
Titration of free–SH groups with DTNB
The number of free–SH groups of histone H3 was determined spectrophotometrically with DTNB at 412 nm, as was described by Zhong et al. (67) with some modifications. The absorbance was recorded in a Kontron Uvikon 810 UV-visible thermostatized spectrophotometer. The thiol content was calculated using an extinction coefficient of TNB at 412 nm (ɛM= 13,600 M−1 cm−1 Tris-HCl 30 mM).
Biotin labeling of GEE
Biotinylation of GEE (BioGEE) was carried out as described by Sullivan (57), using Sulfo-NHS-LC-biotin (Pierce) as a biotinylating reagent. Electrospray ionization mass spectrometry (ESI-MS) of BioGEE, m/z Exp: 675.41 (L+H+); Calc: 674.83; Exp: 6: 697.38 (L+Na+) (Chemical structure [Inset] and ESI-MS can be seen in Supplementary Fig.S1). The yield of the final product 5-((1-((2-ethoxy-2oxoethyl)amino)-3-mercapto-1-oxopropan-2-yl)amino)-5-oxo-2-(6-(5-(2-oxohexahydro-1H-thieno[3,4-d]imidazol-4-yl)pentanamido)hexanamido)pentanoic acid was ∼95%. Mass spectrometric analysis (electrospray ionization, ESI-MS, in positive mode) of the crude reaction mixture confirmed the addition of biotin to the GSH ethyl ester. The analysis by ESI-MS of BioGEE reagent was performed by injection of the reaction mixture by syringe pump 60061 (Cole-Parmer) into the ESI source at flow rate of 240 μl/h into the mass spectrometer ESI-MS Esquire 3000+ (Bruker Daltonic) LC-MS systems Agilent 1100 (Agilent Technologies, Inc). The MS parameters were: positive ion mode; capilarly, −4300 V; capillary exit offset, 147 V; end plate offset, −500 V; skimmer, 52 V, dry gas, N2, 6 K/min; dry temperature, 350°C; nebulizer, 7 psi; and scan range, 80–1500 m/z. “Chemical structure (Inset) and ESI-MS can be seen in Supplementary Figure S1. The yield of reaction was ∼95%.
In vitro biotin-glutathionylation of calf thymus histone H3
First, we carried out the reaction under non oxidant conditions. Later, we induced an oxidation of Cys with 100 μM of H2O2 for 15 min, before the BioGEE (1 mM) addition. Optimal concentration of H2O2 was established to produce a sulphenic acid group (Cys-SOH), an intermediate for glutathionylation of proteins (2, 3). Cys-SOH formation was evaluated by formation of Cys-SO-NBD adduct with a Cl-NBD reagent which shows a maximal peak of absorbance at 345 nm (data not shown). For the biotin-glutathionylation of H3, a solution of 1.5 ml of BioGEE 5 mM were slowly dropped to a solution of 0.5 ml of calf thymus core histone (2 mg) in phosphate buffer (0.1 M Na2PO4, 0.15 M NaCl, pH=7.2). The reaction mixture was stirred in darkness for 45 min at room temperature, under non reducing conditions. Reaction was monitored by MALDI-TOF MS (see Supplementary Fig. S2). Briefly, at 0 min and 20 min after BioGEE addition to the histone core, samples were spotted onto a MALDI-TOF plate (AnchorChip1 600/384 T F target plate (Bruker Daltonics). When deposited samples were dry, and then 0.5 μl of a-cyano-4-hydroxycinnamic acid 5 mg/ml (Sigma) in 0.1% TFA/acetonitrile/H2O (1:1; v/v) matrix solution were added. Mass spectra were recorded in positive reflectron mode of a MALDI-TOF mass spectrometer (Reflex IV; Bruker Daltonics) with delayed extraction operated in reflection mode. Acquired spectra were analyzed directly using XMASS (Bruker Daltonics). The spectrum was collected considering a mass gate between 5000 Da and 20,000 Da to identify modified H3.
Cell culture
NIH3T3 fibroblasts, HF1, HF2 and HeLa cells were cultured in DMEM supplemented with 10% FCS and antibiotics (25 units/ml penicillin and 25 μg/ml streptomycin). MDA-MB-468 was cultured in DMEM/F12 medium supplemented with 10% foetal bovine serum. All cells were grown in 5% CO2 in air at 37°C in 75 cm2 flasks. NIH3T3 were maintained in culture as described previously by Markovic et al. (33) for 120, 48, 24, and 6 h before the nuclear or histone extraction. Tumor cell lines (MDA-MB-468 and HeLa) and fibroblasts from healthy donors (HF1 and HF2) were cultured 96 h before extraction of histones. Doubling times (hours): NIH3T3 23,1; HeLa 18,1; HF1 28,2; HF2 27,3; MDA-MB-468: 30,4.
Protein labeling with BioGEE in cell culture
Labeling of proteins was carried out as follows. 3 h after plating BioGEE (250 μM) was added to the cell culture. Then NIH3T3 cells were maintained in culture for 6, 24, 48, and 120 h (confluence).
Sample tissues
Histones were isolated from −80°C stored liver tissue of 2- and 11-month old male (senescence associated mice prone) SAMP8 and 3- and 20-month old male C57BL/6J mice strains obtained from the breeding colony housed and cared in accordance of institutional guidelines (UCIM, Medicine School, University of Valencia).
Histone extraction and purification by RP-HPLC or separation by 2D-TAU gels
Histones from liver were isolated by two steps protocol. First nuclei from liver tissue of SAMP8 and C57BL/6J mice were obtained using the protocol described by Nagata et al. (39). Histones from tissue isolated nuclei and cells (NIH3T3, HeLa, MDA-MB-468 and human fibroblasts) were isolated using an acid extraction protocol as has been previously described (53). Histone fractions were loaded onto an SDS-PAGE under reducing and nonreducing conditions to evaluate the efficiency of the separation protocol. Afterwards, histone H3 variants (H3.1, H3.2 and H3.3) were separated by RP-HPLC using a C4 column (250×4.6-mm Jupiter, 10 μm, 300 Å; Phenomenex) and linear gradient of 35%–53% solvent B (solvent A, 0.1% trifluoroacetic acid; solvent B, 99.92% acetonitrile and 0.08% trifluoroacetic acid) over 30 min at 1.0 ml/min on a Biotech Ettan microLC (GE Healthcare), as described previously (64). Also histone was separated using histone purification Kit (Active motif) according to the manufacturer's instructions. Alternatively, histones were separated in a 2D-TAU gel to distinguish between H3 variants, as described previously (53). The preparation of such gels and subsequent blotting on PVDF membranes and immunoblot against streptavidine HRP and H3 was performed.
Characterization of BioGEE addition to histone H3 from NIH3T3 cells by MALDI-TOF MS
About 250 ng of RP-HPLC purified histone H3 variants (H3.1 and H3.2/H3.3) from NIH3T3 were digested using Asp-N (aspartate endopeptidase) in digestion buffer (50 mM Tris-HCl; 2.5 mM ZincSulfate; pH 8), overnight, at 37°C. Asp-N was used because trypsin and chymotrypsin do not produce peaks with enough intensity to allow an efficient analysis (data not shown). The reaction was stopped with 10 μl of TFA 10% (pH=1.0). The final volume was 30 μl. BSA was used as control digestion. The digestion crudes were desalted using serial ZipTip C4 and C18. Samples were eluted from ZipTip C4 with 80% acetonitrile and one microliter of the digested protein solution was spotted on a MALDI plate. Nonretained peptides were concentrated and desalted with ZipTip C18 in a similar way (The FT obtained from Tip-C4 were passed through C18 column). When deposited samples were dried, 0.5 μl of a-cyano-4-hydroxycinnamic acid 5 mg/ml (Sigma) in 0.1% TFA/acetonitrile/H2O (1:1; v/v) matrix solution were added. Mass spectra were recorded in positive reflectron mode of a MALDI-TOF mass spectrometer (4700 Proteomics Analyzer; Applied Biosystems).
One aliquot of the digestion products was reduced using 10 mM DTT for 20 min, at 65°C. Then, other samples were processed as nonreduced products.
Manual comparative analyses were performed with mMass 3.8.0 software (56). Studies were focused on 106–122 H3 peptides (for H3.2/H3.3 histone variants), the only Cys-containing peptide in all H3 variants.
Redox cellular profile by [NAD+]/[NADH] ratio and cellular GSH determination
[NAD+]/[NADH] ratio can be calculated using the equilibrium reaction of the lactate dehydrogenase Keq=1.11×10⁻⁴ (piruvate/lactate)([NADH]/[NAD+]) at pH 7.0 and 38°C based on the original work by Bücher and Klingenberg later developed by Krebs (61). The ratio lactate/piruvate was evaluated spectrophotometrically using the method by Gutmann and Wahlefeld (20). GSH cellular levels were determined by GSH S-transferase assay as previously described (7).
Thermal denaturation of reconstituted nucleosome
We used core particles of histones from calf thymus, type-II, and calf thymus DNA, type-XV (CT-DNA). First, histones were treated with GSH (1 mM), and then ultrafiltrated using Microcon 5-MW spin columns (Millipore Corporation). The concentration was tested by measuring the absorbance at 280 nm and using a PAGE electrophoresis and Coomassie blue staining (data not shown). The reconstitution experiments, previously done thermal denaturation of nucleosomes, were carried out by mixing histones and DNA in 1:1 ratio using the procedure described by Tatchell and Van Holde (59). Thermal denaturation studies were developed with an Agilent 8453 UV-vis spectrophotometer (Agilent Technologies, Inc.) equipped with a Peltier (Agilent 89090A) using the procedure described by Lewis and Chiu, with some modifications (30). The melting point was obtained with the first derivative using the Savitsky-Golay algorithm.
CD studies of reconstituted core of histone
CD measurements were performed using a Jasco spectropolarimeter (model J-715) interfaced to a computer (J700 software), maintaining a constant temperature of 25°C using a Peltier PTC-351S apparatus. Samples of histones were prepared to a final concentration of 10 μg, and treatments of GSH and GSSG at final concentrations of 5 mM in 10 mM phosphate, 100 mM KCl buffer. Control and treated samples were placed in 0.1 cm cuvette and the spectra were recorded in the wavelength range of 200–280 nm. Three accumulations and a scan speed of 20 nm/min and response time of 1 s were chosen to record CD spectra. Experiments were repeated three times to confirm reproducibility of the results.
Molecular illustration of glutathionylated H3
The histone H3 structure, available in Protein Data Bank (2CV5.pdb) (60) as part of a human nucleosome particle crystal structure, was used to model the GSH-H3 complex. 2CV5.pdb was chosen, because it contains the H3.1 variant with both C96 and C110. The SWISSPROT database was used to corroborate the sequence of H3.1 variant. Geometry of the GSH molecule was taken from The Database Resource of the National Center for Biotechnology Information (National Library of Medicine). Visualization and manipulations of the GSH molecule were made by Molden (51).
Visualization, manipulation, analysis, and structure superpositions were carried out using the VMD (Visual molecular dynamics program). The structural models of the different elements of the structure were first obtained individually and then docked together into a GSH-H3 complex.
Nuclear GSH determination by image-in-flow cytometry
Nuclear GSH was determined at different times of cell culture of NIH3T3 by multispectral image-in-flow cytometry (MsIFC) using an imageStream100 System (Amnis Corporation). That system combines the power of flow cytometry and the high content information of fluorescence microscopy.
Cells were trypsinized and prepared in sterilized 1.5 ml tubes at density of 5×10⁵ cells/100 μl and incubated with CMFDA 0.025 μM (Invitrogen Probes) in DMEM (Invitrogen) at 37°C, 5% CO2 for 30 min. Then cells were centrifuged at 1500 rpm, 5 min, and the medium was changed with fresh medium and cells incubated for additional 30 min. Last 15 min cells were dyed also with 1 μM DRAQ5 (Cell Signaling). Single stained controls were prepared for spectral compensation.
Images were obtained using 40×magnification and a 488-laser power 30 to 100 mW, depending of the level of staining. Cell classifiers were set to minimal area of 105 pixels to avoid the acquisition of debris, and camera sensitivity was 32 on the first and 512 on all other channels Typical files contained imagery for 3000–10,000 cells in 4 channels (Ch) of interest: Ch1: Side scatter (470–505 nm), Ch2: Brightfield (420–470), Ch3: GSH distribution marked with CMFDA fluorescence (505–560) and Ch6: nuclear image defined by far red fluorescence of Draq5 (660–730). Quantitative analysis was performed using IDEAS 4.0 (Image Data Exploration and Analysis Software). To estimate the nuclear GSH compartmentation the wizard “Nuclear Localization” was applied. The results are presented as histograms of normalized cell frequency as a function of nuclear and GSH co-localization defined by the “similarity” (log transformed Pearson's Correlation Coefficient) of the CMFDA and Draq5 fluorescence. Cells with high nuclear GSH represent a population R1, with the”similarity” higher than 1.
Gene expression analyses by qRT-PCR
Total RNA was isolated from cells using the PARIS™ Protein and RNA Isolation System (Ambion) according to the manufacturer's instructions. For reverse transcription reactions, purified RNA was reverse transcribed using random hexamers with the High-Capacity cDNA reverse transcription kit (Applied Biosystems) according to the manufacturer's instructions. The mRNA levels were determined by quantitative real-time PCR analysis using an ABI Prism 7900 HT Fast Real-Time PCR System (Applied Biosystems). Gene-specific primer pairs and probes for PCNA (proliferation cell nuclear antigen), ID2 (transcription factor Id2), and the HIST1H3A (RD variant histone H3.1) (Assay-on-demand, Applied Biosystems), were used together with TaqManH Universal PCR Master Mix (Applied Biosystems) and reverse transcribed sample RNA in 20 μl reaction volumes. The levels of glyceraldehyde-3-phosphate dehydrogenase expression were measured in all samples to normalize results differences in RNA input, RNA quality and reverse transcription efficiency. Each sample was analyzed in triplicate, and the expression was calculated according to the 2−ΔΔCt method (31).
Analysis of proteins by nonreducing SDS-PAGE
Proteins from biotin-glutathionylation experiments and cell lysates were separated by 15% SDS-PAGE under reducing or nonreducing conditions (absence of β-mercaptoethanol in the Laemmli buffer). After electrophoresis, proteins were transferred to a nitrocellulose membrane. Then membranes were blocked and incubated with primary antibodies streptavidin-HRP (1:5000; ZYMED), anti-GSH primary antibody (1:1000; Virogen), anti-H3 antibody (1:50,000; Upstate), anti-PCNA and anti-Id2 (1:1000; Santa Cruz Biotech), anti-H3.1 (1:750; Novus Biologicals), anti-H3K9ac and anti-H3K9me3 (1:1000; Cell Signaling). After incubation with secondary antibodies conjugated with horseradish peroxidase: anti-mouse antibody (1:6000; Calbiochem) or anti-rabbit antibody (1:2500; Cell Signalling), the membranes were incubated with ECL Western Blotting Detection Reagents (GE Healthcare, Amhersam) and proteins were detected by exposure with a Fujifilm scanning densitometer (Fujifilm LAS-1000 plus).
Statistics
For statistical analysis of the results, the mean was taken as the measurement of the main tendency, while the standard deviation (SD) was taken as the dispersion measurement. Results obtained in titration of free Cys in H3 histone with DTNB shown in Figure 1A and BrdU incorporation assay in NIH3T3 at different times of cell culture presented in Figures 2A, D and 4B are expressed as mean±SD of three or five experiments. For the statistical analysis one way ANOVA with Student-Newman-Keuls test were performed in these experiments. Results obtained in Figure 4C, D, and F shown the mean±SD of measures. Data referred to Figure 4C, D, and F and thermal denaturation experiments, shown in the inset of Figure 7B, have been assessed in three independent experiments. Significance was assessed by one tailed t Student's test using p≤0.05 as the critical limit.
Supplementary Material
Abbreviations Used
- BioGEE
biotinylated glutathione ethyl ester
- CD
circular dichroism
- CMFDA
5-chloromethylfluorescein diacetate
- DEM
diethyl maleate
- DTNB
5,5′-dithiobis-(2-nitrobenzoic acid)
- GSH
glutathione
- GSNO
S-nitrosoglutathione
- MS
mass spectrometry
- PCNA
proliferating cell nuclear antigen
- PTMs
post-translational modifications
- RD
replication-dependent
- RP-HPLC
reverse phase high performance liquid chromatography
- TNB
2-nitro-5-thiobenzoic acid
Acknowledgments
This work was supported by SAF2008-01338 grants from the Ministerio de Ciencia e Innovación and financial support from the CIBERER (Biomedical Network Research Center for Rare Diseases) to F.V.P. J.L.G.-G. thanks the Conselleria de Sanitat of the Generalitat Valenciana for the grant, which allowed his stay in S.B.H.'s laboratory. A.G. thanks the Conselleria de Educación of the Generalitat Valenciana for the financial support received by grants GVPRE/2008/154. O.P. and M.C. acknowledge the Spanish Ministerio de Ciencia e Innovación for the project BIO2009-12513-C02-02, both also are members of the Grup de Recerca de Generalitat de Catalunya, 2009SGR-1457.
S.B.H. was supported by the SFB TR5 (DFG) and CIPSM.
The authors wish to thank G. García, A. Velázquez, S. Banuls and I. Esmoris for technical support. We thank Axel Imhof for his recommendations and suggestions concerning MS data acquisition and interpretation. Special thanks to Luz Valero for their contributions from the Centro de Investigación Príncipe Felipe (CIPF).
Author Disclosure Statement
No competing financial interests exist for any of the authors.
References
- 1.Banks DD. Gloss LM. Folding mechanism of the (H3-H4)2 histone tetramer of the core nucleosome. Protein Sci. 2004;13:1304–1316. doi: 10.1110/ps.03535504. [DOI] [PMC free article] [PubMed] [Google Scholar]
- 2.Barrett WC. DeGnore JP. Keng YF. Zhang ZY. Yim MB. Chock PB. Roles of superoxide radical anion in signal transduction mediated by reversible regulation of protein-tyrosine phosphatase 1B. J Biol Chem. 1999;274:34543–34546. doi: 10.1074/jbc.274.49.34543. [DOI] [PubMed] [Google Scholar]
- 3.Barrett WC. DeGnore JP. Konig S. Fales HM. Keng YF. Zhang ZY. Yim MB. Chock PB. Regulation of PTP1B via glutathionylation of the active site cysteine 215. Biochemistry. 1999;38:6699–6705. doi: 10.1021/bi990240v. [DOI] [PubMed] [Google Scholar]
- 4.Berger SL. The complex language of chromatin regulation during transcription. Nature. 2007;447:407–412. doi: 10.1038/nature05915. [DOI] [PubMed] [Google Scholar]
- 5.Bode J. Henco K. Wingender E. Modulation of the nucleosome structure by histone acetylation. Eur J Biochem. 1980;110:143–152. doi: 10.1111/j.1432-1033.1980.tb04849.x. [DOI] [PubMed] [Google Scholar]
- 6.Bohm L. Hayashi H. Cary PD. Moss T. Crane-Robinson C. Bradbury EM. Sites of histone/histone interaction in the H3- H4 complex. Eur J Biochem. 1977;77:487–493. doi: 10.1111/j.1432-1033.1977.tb11690.x. [DOI] [PubMed] [Google Scholar]
- 7.Brigelius R. Glutathione oxidation and activation of pentose phosphate cycle during hydroperoxide metabolism. A comparison of livers from fed and fasted rats. Hoppe Seylers Z Physiol Chem. 1983;364:989–996. doi: 10.1515/bchm2.1983.364.2.989. [DOI] [PubMed] [Google Scholar]
- 8.Camerini-Otero RD. Felsenfeld G. Histone H3 disulfide dimers and nucleosome structure. Proc Natl Acad Sci U S A. 1977;74:5519–5523. doi: 10.1073/pnas.74.12.5519. [DOI] [PMC free article] [PubMed] [Google Scholar]
- 9.Chi P. Allis CD. Wang GG. Covalent histone modifications—miswritten, misinterpreted and mis-erased in human cancers. Nat Rev Cancer. 2010;10:457–469. doi: 10.1038/nrc2876. [DOI] [PMC free article] [PubMed] [Google Scholar]
- 10.Chow JC. Brown CJ. Forming facultative heterochromatin: silencing of an X chromosome in mammalian females. Cell Mol Life Sci. 2003;60:2586–2603. doi: 10.1007/s00018-003-3121-9. [DOI] [PMC free article] [PubMed] [Google Scholar]
- 11.de Luca A. Moroni N. Serafino A. Primavera A. Pastore A. Pedersen JZ. Petruzzelli R. Farrace MG. Pierimarchi P. Moroni G. Federici G. Sinibaldi Vallebona P. Lo Bello M. Treatment of doxorubicin-resistant MCF7/Dx cells with nitric oxide causes histone glutathionylation and reversal of drug resistance. Biochem J. 2011;440:175–183. doi: 10.1042/BJ20111333. [DOI] [PubMed] [Google Scholar]
- 12.Diaz Vivancos P. Wolff T. Markovic J. Pallardo FV. Foyer CH. A nuclear glutathione cycle within the cell cycle. Biochem J. 2010;431:169–178. doi: 10.1042/BJ20100409. [DOI] [PubMed] [Google Scholar]
- 13.Dixit K. Khan MA. Sharma YD. Moinuddin Alam K. Physicochemical studies on peroxynitrite-modified H3 histone. Int J Biol Macromol. 2010;46:20–26. doi: 10.1016/j.ijbiomac.2009.10.009. [DOI] [PubMed] [Google Scholar]
- 14.Downs JA. Nussenzweig MC. Nussenzweig A. Chromatin dynamics and the preservation of genetic information. Nature. 2007;447:951–958. doi: 10.1038/nature05980. [DOI] [PubMed] [Google Scholar]
- 15.Drake J. Petroze R. Castegna A. Ding Q. Keller JN. Markesbery WR. Lovell MA. Butterfield DA. 4-Hydroxynonenal oxidatively modifies histones: implications for Alzheimer's disease. Neurosci Lett. 2004;356:155–158. doi: 10.1016/j.neulet.2003.11.047. [DOI] [PubMed] [Google Scholar]
- 16.Dwivedi RS. Herman JG. McCaffrey TA. Raj DS. Beyond genetics: epigenetic code in chronic kidney disease. Kidney Int. 2011;79:23–32. doi: 10.1038/ki.2010.335. [DOI] [PMC free article] [PubMed] [Google Scholar]
- 17.Garcia-Gimenez JL. Ledesma AM. Esmoris I. Roma-Mateo C. Sanz P. Vina J. Pallardo FV. Histone carbonylation occurs in proliferating cells. Free Radic Biol Med. 2012;52:1453–1464. doi: 10.1016/j.freeradbiomed.2012.01.022. [DOI] [PubMed] [Google Scholar]
- 18.Garcia BA. Hake SB. Diaz RL. Kauer M. Morris SA. Recht J. Shabanowitz J. Mishra N. Strahl BD. Allis CD. Hunt DF. Organismal differences in post-translational modifications in histones H3 and H4. J Biol Chem. 2007;282:7641–7655. doi: 10.1074/jbc.M607900200. [DOI] [PubMed] [Google Scholar]
- 19.Greenfield NJ. Using circular dichroism collected as a function of temperature to determine the thermodynamics of protein unfolding and binding interactions. Nat Protoc. 2006;1:2527–2535. doi: 10.1038/nprot.2006.204. [DOI] [PMC free article] [PubMed] [Google Scholar]
- 20.Gutmann I. Wahlefeld A. Methods of Enzymatic Analysis. In: Bergmeyer HU, editor. New York: Academic Press; 1974. pp. 1464–1468. [Google Scholar]
- 21.Hake SB. Allis CD. Histone H3 variants and their potential role in indexing mammalian genomes: the “H3 barcode hypothesis”. Proc Natl Acad Sci U S A. 2006;103:6428–6435. doi: 10.1073/pnas.0600803103. [DOI] [PMC free article] [PubMed] [Google Scholar]
- 22.Hake SB. Garcia BA. Duncan EM. Kauer M. Dellaire G. Shabanowitz J. Bazett-Jones DP. Allis CD. Hunt DF. Expression patterns and post-translational modifications associated with mammalian histone H3 variants. J Biol Chem. 2006;281:559–568. doi: 10.1074/jbc.M509266200. [DOI] [PubMed] [Google Scholar]
- 23.Iakova P. Awad SS. Timchenko NA. Aging reduces proliferative capacities of liver by switching pathways of C/EBPalpha growth arrest. Cell. 2003;113:495–506. doi: 10.1016/s0092-8674(03)00318-0. [DOI] [PubMed] [Google Scholar]
- 24.Jenuwein T. Allis CD. Translating the histone code. Science. 2001;293:1074–1080. doi: 10.1126/science.1063127. [DOI] [PubMed] [Google Scholar]
- 25.Johnson L. Mollah S. Garcia BA. Muratore TL. Shabanowitz J. Hunt DF. Jacobsen SE. Mass spectrometry analysis of Arabidopsis histone H3 reveals distinct combinations of post-translational modifications. Nucleic Acids Res. 2004;32:6511–6518. doi: 10.1093/nar/gkh992. [DOI] [PMC free article] [PubMed] [Google Scholar]
- 26.Kawakami K. Nakamura A. Ishigami A. Goto S. Takahashi R. Age-related difference of site-specific histone modifications in rat liver. Biogerontology. 2009;10:415–421. doi: 10.1007/s10522-008-9176-0. [DOI] [PubMed] [Google Scholar]
- 27.Klatt P. Pineda Molina E. Perez-Sala D. Lamas S. Novel application of S-nitrosoglutathione-Sepharose to identify proteins that are potential targets for S-nitrosoglutathione-induced mixed-disulphide formation. Biochem J. 2000;349:567–578. doi: 10.1042/0264-6021:3490567. [DOI] [PMC free article] [PubMed] [Google Scholar]
- 28.Kouzarides T. Chromatin modifications and their function. Cell. 2007;128:693–705. doi: 10.1016/j.cell.2007.02.005. [DOI] [PubMed] [Google Scholar]
- 29.Lachner M. Jenuwein T. The many faces of histone lysine methylation. Curr Opin Cell Biol. 2002;14:286–298. doi: 10.1016/s0955-0674(02)00335-6. [DOI] [PubMed] [Google Scholar]
- 30.Lewis PN. Chiu SS. Effect of histone H3 sulfhydryl modifications on histone-histone interactions and nucleosome formation and structure. Eur J Biochem. 1980;109:369–376. doi: 10.1111/j.1432-1033.1980.tb04803.x. [DOI] [PubMed] [Google Scholar]
- 31.Livak KJ. Schmittgen TD. Analysis of relative gene expression data using real-time quantitative PCR and the 2(-Delta Delta C(T)) Method. Methods. 2001;25:402–408. doi: 10.1006/meth.2001.1262. [DOI] [PubMed] [Google Scholar]
- 32.Luger K. Mader AW. Richmond RK. Sargent DF. Richmond TJ. Crystal structure of the nucleosome core particle at 2.8 A resolution. Nature. 1997;389:251–260. doi: 10.1038/38444. [DOI] [PubMed] [Google Scholar]
- 33.Markovic J. Borras C. Ortega A. Sastre J. Vina J. Pallardo FV. Glutathione is recruited into the nucleus in early phases of cell proliferation. J Biol Chem. 2007;282:20416–20424. doi: 10.1074/jbc.M609582200. [DOI] [PubMed] [Google Scholar]
- 34.Markovic J. Garcia-Gimenez JL. Gimeno A. Vina J. Pallardo FV. Role of glutathione in cell nucleus. Free Radic Res. 2010;44:721–733. doi: 10.3109/10715762.2010.485989. [DOI] [PubMed] [Google Scholar]
- 35.Markovic J. Mora NJ. Broseta AM. Gimeno A. de-la-Concepcion N. Vina J. Pallardo FV. The depletion of nuclear glutathione impairs cell proliferation in 3t3 fibroblasts. PLoS One. 2009;4:e6413. doi: 10.1371/journal.pone.0006413. [DOI] [PMC free article] [PubMed] [Google Scholar]
- 36.McKittrick E. Gafken PR. Ahmad K. Henikoff S. Histone H3.3 is enriched in covalent modifications associated with active chromatin. Proc Natl Acad Sci U S A. 2004;101:1525–1530. doi: 10.1073/pnas.0308092100. [DOI] [PMC free article] [PubMed] [Google Scholar]
- 37.McNairn AJ. Gilbert DM. Epigenomic replication: linking epigenetics to DNA replication. Bioessays. 2003;25:647–656. doi: 10.1002/bies.10305. [DOI] [PubMed] [Google Scholar]
- 38.Menon SG. Goswami PC. A redox cycle within the cell cycle: ring in the old with the new. Oncogene. 2007;26:1101–1109. doi: 10.1038/sj.onc.1209895. [DOI] [PubMed] [Google Scholar]
- 39.Nagata T. Redman RS. Lakshman R. Isolation of intact nuclei of high purity from mouse liver. Anal Biochem. 2010;398:178–184. doi: 10.1016/j.ab.2009.11.017. [DOI] [PubMed] [Google Scholar]
- 40.Nakamura A. Kawakami K. Kametani F. Nakamoto H. Goto S. Biological significance of protein modifications in aging and calorie restriction. Ann N Y Acad Sci. 2010;1197:33–39. doi: 10.1111/j.1749-6632.2009.05374.x. [DOI] [PubMed] [Google Scholar]
- 41.Olins DE. Bryan PN. Harrington RE. Hill WE. Olins AL. Conformational states of chromatin nu bodies induced by urea. Nucleic Acids Res. 1977;4:1911–1931. doi: 10.1093/nar/4.6.1911. [DOI] [PMC free article] [PubMed] [Google Scholar]
- 42.Pallardo FV. Markovic J. Garcia JL. Vina J. Role of nuclear glutathione as a key regulator of cell proliferation. Mol Aspects Med. 2009;30:77–85. doi: 10.1016/j.mam.2009.01.001. [DOI] [PubMed] [Google Scholar]
- 43.Panyim S. Sommer KR. Chalkley R. Oxidation of the cysteine-containing histone F3. Detection of an evolutionary mutation in a conservative histone. Biochemistry. 1971;10:3911–3917. doi: 10.1021/bi00797a018. [DOI] [PubMed] [Google Scholar]
- 44.Penella E. Sandoval J. Zaragoza R. Garcia C. Vina JR. Torres L. Garcia-Trevijano ER. Molecular mechanisms of Id2 down-regulation in rat liver after acetaminophen overdose. Protection by N-acetyl-L-cysteine. Free Radic Res. 2010;44:1044–1053. doi: 10.3109/10715762.2010.498825. [DOI] [PubMed] [Google Scholar]
- 45.Pineda-Molina E. Klatt P. Vazquez J. Marina A. Garcia de Lacoba M. Perez-Sala D. Lamas S. Glutathionylation of the p50 subunit of NF-kappaB: a mechanism for redox-induced inhibition of DNA binding. Biochemistry. 2001;40:14134–14142. doi: 10.1021/bi011459o. [DOI] [PubMed] [Google Scholar]
- 46.Polo SE. Almouzni G. Chromatin assembly: a basic recipe with various flavours. Curr Opin Genet Dev. 2006;16:104–111. doi: 10.1016/j.gde.2006.02.011. [DOI] [PubMed] [Google Scholar]
- 47.Prior CP. Cantor CR. Johnson EM. Littau VC. Allfrey VG. Reversible changes in nucleosome structure and histone H3 accessibility in transcriptionally active and inactive states of rDNA chromatin. Cell. 1983;34:1033–1042. doi: 10.1016/0092-8674(83)90561-5. [DOI] [PubMed] [Google Scholar]
- 48.Rahman I. Marwick J. Kirkham P. Redox modulation of chromatin remodeling: impact on histone acetylation and deacetylation, NF-kappaB and pro-inflammatory gene expression. Biochem Pharmacol. 2004;68:1255–1267. doi: 10.1016/j.bcp.2004.05.042. [DOI] [PubMed] [Google Scholar]
- 49.Ramaswamy A. Bahar I. Ioshikhes I. Structural dynamics of nucleosome core particle: comparison with nucleosomes containing histone variants. Proteins. 2005;58:683–696. doi: 10.1002/prot.20357. [DOI] [PubMed] [Google Scholar]
- 50.Robyt JF. Ackerman RJ. Chittenden CG. Reaction of protein disulfide groups with Ellman's reagent: a case study of the number of sulfhydryl and disulfide groups in Aspergillus oryzae -amylase, papain, and lysozyme. Arch Biochem Biophys. 1971;147:262–269. doi: 10.1016/0003-9861(71)90334-1. [DOI] [PubMed] [Google Scholar]
- 51.Schaftenaar G. Noordik JH. Molden: a pre- and post-processing program for molecular and electronic structures. J Comput Aided Mol Des. 2000;14:123–134. doi: 10.1023/a:1008193805436. [DOI] [PubMed] [Google Scholar]
- 52.Sharma R. Nakamura A. Takahashi R. Nakamoto H. Goto S. Carbonyl modification in rat liver histones: decrease with age and increase by dietary restriction. Free Radic Biol Med. 2006;40:1179–1184. doi: 10.1016/j.freeradbiomed.2005.11.013. [DOI] [PubMed] [Google Scholar]
- 53.Shechter D. Dormann HL. Allis CD. Hake SB. Extraction, purification and analysis of histones. Nat Protoc. 2007;2:1445–1457. doi: 10.1038/nprot.2007.202. [DOI] [PubMed] [Google Scholar]
- 54.Sterner R. Boffa LC. Chen TA. Allfrey VG. Cell cycle-dependent changes in conformation and composition of nucleosomes containing human histone gene sequences. Nucleic Acids Res. 1987;15:4375–4391. doi: 10.1093/nar/15.11.4375. [DOI] [PMC free article] [PubMed] [Google Scholar]
- 55.Strahl BD. Allis CD. The language of covalent histone modifications. Nature. 2000;403:41–45. doi: 10.1038/47412. [DOI] [PubMed] [Google Scholar]
- 56.Strohalm M. Hassman M. Kosata B. Kodicek M. mMass data miner: an open source alternative for mass spectrometric data analysis. Rapid Commun Mass Spectrom. 2008;22:905–908. doi: 10.1002/rcm.3444. [DOI] [PubMed] [Google Scholar]
- 57.Sullivan DM. Wehr NB. Fergusson MM. Levine RL. Finkel T. Identification of oxidant-sensitive proteins: TNF-alpha induces protein glutathiolation. Biochemistry. 2000;39:11121–11128. doi: 10.1021/bi0007674. [DOI] [PubMed] [Google Scholar]
- 58.Tao L. English AM. Protein S-glutathiolation triggered by decomposed S-nitrosoglutathione. Biochemistry. 2004;43:4028–4038. doi: 10.1021/bi035924o. [DOI] [PubMed] [Google Scholar]
- 59.Tatchell K. Van Holde KE. Reconstitution of chromatin core particles. Biochemistry. 1977;16:5295–5303. doi: 10.1021/bi00643a021. [DOI] [PubMed] [Google Scholar]
- 60.Tsunaka Y. Kajimura N. Tate S. Morikawa K. Alteration of the nucleosomal DNA path in the crystal structure of a human nucleosome core particle. Nucleic Acids Res. 2005;33:3424–3434. doi: 10.1093/nar/gki663. [DOI] [PMC free article] [PubMed] [Google Scholar]
- 61.Veech RL. Eggleston LV. Krebs HA. The redox state of free nicotinamide-adenine dinucleotide phosphate in the cytoplasm of rat liver. Biochem J. 1969;115:609–619. doi: 10.1042/bj1150609a. [DOI] [PMC free article] [PubMed] [Google Scholar]
- 62.Vivancos PD. Dong Y. Ziegler K. Markovic J. Pallardo FV. Pellny TK. Verrier PJ. Foyer CH. Recruitment of glutathione into the nucleus during cell proliferation adjusts whole-cell redox homeostasis in Arabidopsis thaliana and lowers the oxidative defence shield. Plant J. 2010;64:825–838. doi: 10.1111/j.1365-313X.2010.04371.x. [DOI] [PubMed] [Google Scholar]
- 63.Wang C. Fu M. Mani S. Wadler S. Senderowicz AM. Pestell RG. Histone acetylation and the cell-cycle in cancer. Front Biosci. 2001;6:D610–D629. doi: 10.2741/1wang1. [DOI] [PubMed] [Google Scholar]
- 64.Wiedemann SM. Mildner SN. Bonisch C. Israel L. Maiser A. Matheisl S. Straub T. Merkl R. Leonhardt H. Kremmer E. Schermelleh L. Hake SB. Identification and characterization of two novel primate-specific histone H3 variants, H3.X and H3.Y. J Cell Biol. 2010;190:777–791. doi: 10.1083/jcb.201002043. [DOI] [PMC free article] [PubMed] [Google Scholar]
- 65.Wood CM. Sodngam S. Nicholson JM. Lambert SJ. Reynolds CD. Baldwin JP. The oxidised histone octamer does not form a H3 disulphide bond. Biochim Biophys Acta. 2006;1764:1356–1362. doi: 10.1016/j.bbapap.2006.06.014. [DOI] [PubMed] [Google Scholar]
- 66.Xu M. Long C. Chen X. Huang C. Chen S. Zhu B. Partitioning of histone H3-H4 tetramers during DNA replication-dependent chromatin assembly. Science. 2010;328:94–98. doi: 10.1126/science.1178994. [DOI] [PubMed] [Google Scholar]
- 67.Zhong L. Arner ES. Holmgren A. Structure and mechanism of mammalian thioredoxin reductase: the active site is a redox-active selenolthiol/selenenylsulfide formed from the conserved cysteine-selenocysteine sequence. Proc Natl Acad Sci U S A. 2000;97:5854–5859. doi: 10.1073/pnas.100114897. [DOI] [PMC free article] [PubMed] [Google Scholar]
Associated Data
This section collects any data citations, data availability statements, or supplementary materials included in this article.