

Abstract
The goal of this project was to use functional genomic methods to identify molecular biomarkers as indicators of the impact of TCDD exposure in rainbow trout. Specifically, we investigated the effects of chronic dietary TCDD exposure on whole juvenile rainbow trout global gene expression associated with histopathological analysis. Juvenile rainbow trout were fed Biodiet starter with TCDD added at 0, 0.1, 1, 10 and 100 ppb (ng TCDD / g food), and fish were sampled from each group at 7, 14, 28 and 42 days (d) after initiation of feeding. 100 ppb TCDD caused 100% mortality at 39 d. Fish fed with 100 ppb TCDD food had TCDD accumulation of 47.37 ppb (ng TCDD / g fish) in whole fish at 28 d. Histological analysis from TCDD-treated trout sampled from 28 d and 42 d revealed that obvious lesions were found in skin, oropharynx, liver, gas bladder, intestine, pancreas, nose and kidney. In addition, TCDD caused anemia in peripheral blood, decreases in abdominal fat, increases of remodeling of fin rays, edema in pericardium and retrobulbar hemorrhage in the 100 ppb TCDD-treated rainbow trout compared to the control group at 28 d. Dose- and time-dependent global gene expression analyses were performed using the cGRASP 16,000 (16K) cDNA microarray. TCDD-responsive whole body transcripts identified in the microarray experiments have putative functions involved in various biological processes including growth, cell proliferation, metabolic process, and immune system processes. Nine microarray-identified genes were selected for QPCR validation. CYP1A3 and CYP1A1 were common up-regulated genes and HBB1 was a common down-regulated gene among each group based on microarray data, and their QPCR validations are consistent with microarray data for the 10 and 100 ppb TCDD treatment groups after 28-d exposure (p< 0.05). In addition, in the 100 ppb group at 28d, expression of complement component C3-1 and trypsin-1 precursor have a more than 10-fold induction from the microarray experiments, and their QPCR validations are consistent and showed significant induction in the 100 ppb group at 28d (p< 0.05). Overall, lesion in nasal epithelium is a novel and significant result in this study, and TCDD-responsive rainbow trout transcripts identified in the present study may lead to the development of new molecular biomarkers for assessing the potential impacts of environmental TCDD on rainbow trout populations.
Keywords: TCDD, juvenile, rainbow trout, biomarker, lesions, microarray
Introduction
TCDD (2, 3, 7, 8-tetrachlorodibenzo-p-dioxin) is a chemical by-product of burning or incinerating chlorinated industrial chemicals and other hydrocarbons and is a contaminant of and byproduct of manufacture of chlorinated phenol products. TCDD is a well-known endocrine disruptor (Kociba et al., 1978; Safe et al., 1998; Vos et al., 1974), carcinogen (Yang and Rhim, 1995) and oxidative stress inducing agent (Stohs, 1990) in humans and other vertebrates. The Aryl hydrocarbon receptor (AHR) belongs to the Per-ARNT-Sim (PAS) family and binds TCDD and modulates TCDD-responsive gene expression by combining with the AHR nuclear translocator (ARNT) (Hutz et al., 2006). This heteromeric complex then binds to the aryl hydrocarbon-receptor responsive element (AHRE) to regulate expression of TCDD-responsive genes, most notably those encoding xenobiotic-metabolizing enzymes such as cytochrome P4501A1 (CYP1A1) and P4501B1 (CYP1B1) (Schrenk, 1998). TCDD persists in the environment and bioaccumulates in humans and wildlife through the food-web, posing long-term health consequences (White and Birnbaum, 2009). In teleosts, developmental exposure to TCDD induces cardiovascular dysfunction, craniofacial malformation, and neuronal degeneration(Dong et al., 2002; Hill et al., 2003; King Heiden et al., 2009; Spitsbergen et al., 1991). Embryonic exposure of lake trout (Salvelinus namaycush) to as little as 400 parts per trillion (ppt) of TCDD causes blue-sac disease, which is an edematous syndrome (Spitsbergen et al., 1991). A study by King Heiden et al. (2009) showed that TCDD exposure in early-life stage zebrafish caused craniofacial malformations (operculum and jaw), edema (yolk sac and pericardium), and decreases in cardiac output. In rainbow trout (Oncorhynchus mykiss), dietary TCDD causes liver and spleen lesions, hepatocellular necrosis, and decreased peripheral leukocyte counts in adults, and decreased survival and increased rates of edema and deformities in fry (Giesy et al., 2002; Walter et al., 2000). Sublethal exposure of juvenile rainbow trout to parenteral TCDD results in fin necrosis and lymphomyeloid lesions including thymic involution, splenic lymphoid depletion, myelosuppression, and peripheral leucopenia and thrombocytopenia (Spitsbergen et al., 1988a; Spitsbergen et al., 1988b). Epithelial lesions occurred in visceral organs including necrosis of gastric cardiac mucosa, atrophy or hyperplasia of serous gastric glands depending on the hatchery strain, vacuolar inclusions in exocrine pancreatic cells, and hatchery strain-related lesions in liver varying from no lesions to mild or severe diffuse hepatopathy with hyaline cytoplasmic inclusions and bile duct hyperplasia (Spitsbergen et al., 1988a; Spitsbergen et al., 1988b).
Rainbow trout is an important species in the Laurentian Great Lakes. Due to its availability of good genomic recourses, such as sequence databases and DNA microarrays, we were able to apply this model for toxicogenomic research (Koop et al., 2008; Rise et al., 2004a; Rise et al., 2004b; von Schalburg et al., 2005a). This species may serve as an ecotoxicogenomic model, providing a linkage between the laboratory and the lakes. Rainbow trout also constitutes a powerful model for studies of carcinogenesis, comparative immunology, physiology of the stress response, and molecular genetics (Thorgaard et al., 2002). For example, rainbow trout present a significant advantage for low-dose carcinogen testing due to acute sensitivity to a number of human carcinogens (William et al., 2003). Although most of the recent investigations of impacts of TCDD in teleosts have been on embryonic and adult exposure (Giesy et al., 2002; Hornung et al., 1999; Spitsbergen et al., 1991; Walter et al., 2000), studies of dietary TCDD exposure in juvenile rainbow trout are not well documented. We think juvenile developmental stages connect embryonic/larval and adult stages, and studies of TCDD exposure (especially chronic exposure) in juveniles are extremely important and will likely provide outcomes that are different from studies involving TCDD exposures of embryos and adults. For example, early life stages (egg or fry) of salmonids are exquisitely sensitive to the cardiovascular toxicity of TCDD so that fish succumb rapidly to edema and circulatory failure (Spitsbergen et al., 1991; Hornung et al., 1999). However, the severe epithelial and lymphomyeloid lesions occurring in older juvenile fish exposed to TCDD are not being observed at that early life stage since they have not developed yet. We conducted TCDD exposures to juvenile fish ranged from low to high doses, thus we are able to detect and characterize a number of epithelial and lymphomyeloid lesions that are not evident following early life exposure of salmonids to TCDD due to the rapid death of highly sensitive early life stages (Walker and Peterson, 1991).
We performed long-term feeding trials with diets containing 0, 0.1, 1, 10 and 100 parts per billion (ppb) TCDD in juvenile rainbow trout for 42 d. TCDD-induced pathologic alterations and TCDD bioaccumulation in rainbow trout were evaluated. Molecular biomarkers of whole juvenile rainbow trout response to dietary TCDD were identified by microarray experiments, and nine microarray-identified genes were subjected to QPCR with individual RNA samples to assess biological variability of transcript expression.
In the Great Lakes region, 0.02 ppb - 0.04 ppb TCDD is found in the whole body of adult commercial salmonid species (e.g., lake trout) (Ryan et al., 1984; Turyk et al., 2012). It is reported that the no observable adverse effect level (NOAEL) of TCDD toxicity equivalence concentrations in lake trout eggs is 0.005 ppb, and higher levels of TCDD in eggs cause sublethal effects or mortality (Cook et al., 2003). The doses of TCDD in the current study were higher than environmental levels. We assumed that TCDD at experimental levels would cause overt toxicity in rainbow trout allowing for the identification of biomarkers and histopathologic outcomes.
Materials and Methods
Chemicals and diets
Powdered TCDD was purchased from the National Cancer Institute—Chemical Carcinogen Reference Standard Repository, Midwest Research Institute (Kansas City, MO) and stored at room temperature. Diets for treatments were prepared by dissolving the required amount of TCDD for each dose in ethanol (PHARMCO-AAPER, Brookfield, CT) and mixing 1 l ethanol per kilogram of the Biodiet starter #2 (Bio-Oregon, Inc., Longview, WA). The ethanol in the mixture was evaporated under a fume hood.
Animals
Rainbow trout were handled following protocols approved by the Animal Care and Use Committee (ACUC) of the University of Wisconsin–Milwaukee (UWM). Eyed trout eggs, provided by the Fish and Wildlife Service Ennis National Fish Hatchery (Ennis, MT), were reared in 10°C dechlorinated municipal water at the UWM Children's Environmental Health Sciences Core Center (CEHSC) Aquatic Animal Models facility. Rainbow trout were fed BioDiet starter #2 (Bio-Oregon, Inc., Longview, WA) at 4% of body weight per day with TCDD added at 0, 0.1, 1, 10 and 100 ppb (nominal concentration, ethanol as a vehicle) starting at 45 days after hatching (0.18 ± 0.01 g, average ± SEM). Fish were kept in one tank per treatment group and all the feed was consumed for all diets. Fish were sampled from each treatment group at 7, 14, 28 and 42 d after the onset of feeding the experimental diets. Individual fish were anaesthetized in dechlorinated municipal water containing 100 mg/l of MS222 (Tricaine methanesulfonate; Finquel, Redmond, WA), placed into 1.5 ml microcentrifuge tubes, and then frozen quickly in liquid nitrogen. The samples were stored at -80°C until RNA isolation.
Body weight and length of 10 animals in each treatment group were measured weekly, and condition factor was calculated by (weight [g]/length [cm] 3) *100. Statistical analyses of length, weight, and condition factor were performed using One-Way ANOVA followed by Student-Newman-Keuls test using the SigmaStat software (version 3.5), and data were plotted using Sigmaplot (version 11.0).
TCDD accumulation in juvenile rainbow trout
TCDD concentrations were obtained using methods derived from Antunes et al. (2008). Dichloromethane, hexane, and nonane were obtained from Acros Organics (Thermo Fisher Scientific, NJ). Hexane and dichloromethane were electron capture detector (ECD) tested by the manufacturer while all solvents were ECD tested in the lab. Accelerated solvent extraction of TCDD from pooled whole rainbow trout was performed using a Dionex ASE150. Approximately 1 g of homogenized trout (5-8 fish) was mixed with dispersant in a 5 ml stainless steel extraction cell. ASE extraction was performed using hexane solvent, heated to 150°C, with a 5 min static time, rinse volume of 150 %, and a purge of 80 sec. for three cycles. TCDD samples were cleaned by loading them onto a hexane-washed 1 g glass Florisil column, and TCDD was eluted with 10 ml dichloromethane. Recovery efficiency was assessed by spiking 0.2 g of porcine fat with approximately 50 ng TCDD and extracting TCDD from this sample as described above. Samples were evaporated to dryness in an Eppendorf Vacufuge Plus and reconstituted in 1000 μl of nonane for analysis. TCDD extracts were analyzed on a Thermo Ultra Trace GC with a Programmed Temperature Vaporization (PTV) inlet, AS3000 autosampler, and ECD detector. Initial oven temperature was set at 180°C for 1 min, and then increased by 2.5°C per min to 270°C for 5 min (total run time 40 min). PTV inlet temperature was 300°C, splitless time 0.8 min, and split flow 30 ml/min. H2 carrier flow rate was 1.5 ml/min and makeup (N2) flow rate was 50 ml/min. ECD base temperature was 270°C with ECD temperature at 300°C, reference current 1 nA, pulse amplitude 50 V, and pulse width 1 microsec. One μl samples were injected onto an Agilent DB-Dioxin column 60m×0.25mm ID, 0.25 micron film thickness. Linear standard curves were created from 1-100 ng/ml and R2 values >0.99 for TCDD standard with a retention time of 24.65 min. The limit of quantitation for TCDD was set at 10 ng/ml or 10 ppb rainbow trout.
Additional samples were sent to the Wisconsin State Laboratory of Hygiene (WSLH, Madison, WI) for more sensitive analysis of TCDD residues. Fish were removed from −20°C storage and transferred to a bath of liquid nitrogen for several minutes. A pestle was used to pulverize the brittle tissue between sheets of aluminum foil. The pooled tissue from three individuals was then scraped from the foil into beakers and weighed. Sample weights ranged from 0.32 g to 1.55 g. Dioxins/furans extractions were performed using a Supelco Dioxin Prep System (Sigma-Aldrich, St. Louis, MO). All dioxin-grade solvents and reagents and sample clean-up columns were also purchased from Sigma-Aldrich. Standards were purchased from Cambridge Isotopes (Andover, MA). U.S. EPA Method 1613 was followed to determine dioxins/furans concentrations. Briefly, 8 g sodium sulfate was added to the fish tissue as a drying agent. Samples were transferred to cellulose extraction thimbles and 13-C labeled surrogate standards were added to each thimble. A 1:1 hexane: dichloromethane mixture was used to extract the samples for 24 h on a soxhlet extraction apparatus. Following concentration on a Rotavapor (Buchi Corporation, New Castle, DE), extracts were passed through multilayer silica gel columns. After another concentration step, dioxins/furans were captured on a dual layer carbon column, and then eluted using toluene. Following blow down on a Turbovap (Caliper Life Sciences, Hopkinton, MA), extracts were transferred to silanized GC vials containing dioxin internal standards in nonane. Solvent exchange from toluene to nonane was completed under nitrogen blow down. Final volume of extract was 20 μL. Samples were analyzed on a Thermo Electron MAT95 XP magnetic sector mass spectrometer operating in EI mode, using selected ion monitoring (SIM) at 10,000 resolving power.
We compared accumulation of dietary TCDD in whole rainbow trout to the model developed by Fisk et al. (1997).
where Cfish is the concentration of TCDD in fish (ppb), α is assimilation efficiency, F is the feeding rate (food weight [g] / fish weight per day [g]), Cfood is the nominal concentration of TCDD in food (ppb), kD is the depuration rate constant, and t is the time of uptake (days). We used values of α= 0.49, kD =0.0088, and F =0.04.
Histopathology
After dietary TCDD exposure of 28 d, fish were collected from each treatment group for histopathologic analysis. Briefly, fish were anesthetized in a buffered solution of 100 mg/l of MS222, and the coelomic cavity was opened allowing perfusion of internal organs. A transverse incision at the level of the anterior spinal cord enhanced fixation of brain and kidney. Tails were removed. Head and body were placed into plastic cassettes separately. The samples were fixed in Davidson's solution (24 h), rinsed in cold tap water (24 h), decalcified in Cal-EX (Fisher Scientific) for 24 h, and rinsed again in cold tap water (24 h). Dehydration occurred in 50% and then 70% ethanol for 24 h each. The samples were sent to Mass Histology Service Inc (Worcester, MA) for paraffin embedding, sagittal-step sectioning near the midline and medial to the eye (2-4 per fish), mounting on glass slides and staining with hematoxylin and eosin. Histopathologic analysis was performed by a Jan M. Spitsbergen, who is a veterinary pathologist certified by the American College of Veterinary Pathologists having 30 years of experience in fish pathology research and diagnostic pathology.
RNA isolation and purification
Total RNA was isolated using TRIzol Reagent (Invitrogen, Carlsbad, CA) following the manufacturer's protocol. Briefly, individual whole fish were homogenized in 1 ml of TRIzol reagent with a PowerGen 500 homogenizer (Fisher Scientific, Pittsburgh, PA). Chloroform (Fisher Scientific, Pittsburg, PA) (0.2 ml) was added for phase separation and mixed by inverting the tubes by hand for 15 s. The samples were then centrifuged at 11400 rpm for 15 min at 8°C. The upper aqueous phase was transferred to a clean 1.5 ml microcentrifuge tube, and 0.5 ml of isopropyl alcohol (PHARMCO-AAPER, Brookfield, CT) was added. RNA was precipitated at room temperature (10 min) and pelleted by centrifugation at 11400 rpm for 15 min at 8°C. The supernatant was removed and the pellet was washed with 1 ml 75% ethanol. The samples were centrifuged at 11400 rpm for 5 min at 8°C, supernatants were removed, and RNA pellets were air-dried and dissolved in RNase-free water (Gibco, Grand Island, NY). Total RNA samples (< 45 μg in a total volume of 100 μl) were digested with 2.5 μl DNase I (1500 U) for 10 min at room temperature and further column RNA purification was performed using the RNeasy MiniElute cleanup kit (Qiagen, MD) following the manufacturer's protocol. The purity and quantity of RNA were examined using A260/A230 and A260/A280 ratios calculated by the ND-1000 NanoDrop Spectrophotometer (Thermo Scientific, Wilmington, DE, USA) and quality and integrity of RNA was examined by 1% TAE agarose gel electrophoresis.
Microarrays
To study the impacts of dietary TCDD on the juvenile rainbow trout whole body transcriptome, two independent microarray experiments were performed. The first microarray experiment investigated dose-dependent impacts of TCDD on gene expression (Experiment 1), while the second microarray experiment looked into time-dependent impacts of TCDD on gene expression (Experiment 2). For Experiment 1, column-purified total RNA samples of 10 fish from each treatment group (0, 0.1, 1, 10 and 100 ppb) at 28 d were used for the microarray experiment. For Experiment 2, purified whole body total RNA samples of 10 fish from the 0 ppb and 10 ppb treatment groups at 7 d, 14 d, 28 d and 42 d were used for the microarray experiment. Four arrays, including with two dye-swaps to avoid dye bias, were analyzed for each comparison (TCDD treated vs. vehicle control) (Supplemental Figure 1).
For target synthesis, purified RNA samples from 10 individual fish from the same group were pooled with each fish contributing an equal quantity (1 μg) of RNA to a given pool. cDNA was synthesized from 1 μg of pooled RNA using SuperScript II Reverse Transcriptase (Invitrogen, Carlsbad, CA) and the Array 900 Expression Array Detection kit (Genisphere, Hatfield, PA) according to the Array 900 protocol. Briefly, for each microarray target, 1 μg of pooled RNA was denatured at 80°C for 5 min in the presence of oligo (dT) primers with 5′-prime unique sequences complementary to the Cy3 or Cy5 Capture Reagents, then reverse transcribed at 42°C for 2.5 h (see the Array 900 manual for details regarding the labeling system chemistry). The reverse transcription reactions were stopped, denatured (with degradation of RNA), and neutralized following the Array 900 manual. The cDNAs for each “TCDD vs. control” comparison were combined and incubated at 50°C until being hybridized to consortium for Genomics Research on All Salmonids Project (cGRASP) 16K cDNA microarrays (http://web.uvic.ca/grasp/microarray/array.html, batch number FA009 for microarray experiment 1, and batch number IB009 for microarray experiment 2) platform version 2.1 (von Schalburg et al., 2005a).
Prior to hybridization, arrays were washed in 0.1 % SDS (2 × 5 min), rinsed in RNase-free water (5 × 1 min) in 50 ml conical tubes (BD Falcon, Franklin Lakes, NJ), and then immersed in 95°C RNase-free water (1 × 3 min) to denature the probes. Slides were dried by centrifugation (2000 rpm for 5 min, room temperature) and kept at 50°C until use. Hybridization was performed using HybriSlips coverslips (Sigma, St. Louis, MO) and Corning microarray hybridization chambers (Corning, Tewksbury, MA) in a water bath at 50°C for 16 h; the first hybridization used LNA dT blocker (vial 9 in the Array 900 kit) and formamide-based hybridization buffer (vial 7 in the Array 900 kit) as directed in the Array 900 manual. Following the first hybridization, arrays were washed in 2× SSC (Ambion, Austin, TX), 0.2% SDS solution (Ambion, Austin, TX) at 50°C (1 × 15 min), 2× SSC (1 × 15 min) at room temperature, then 0.2× SSC (1 × 15 min) at room temperature; all microarray wash solutions were made using RNase-free water. The fluorescence labeling hybridization (50 °C for 4 h) utilized the Genisphere 3DNA Cy3 and Cy5 Capture Reagents in formamide-based hybridization buffer (vial 7). After the second hybridization, the arrays were washed and dried as previously described. Microarrays were scanned at 10 μm resolution using a ScanArray Express (PerkinElmer Life Sciences, Inc, Boston, MA). The photomultiplier tube settings (PMT) for Cy3 and Cy5 were 70 and 65-66, respectively. TIFF images of arrays were generated with ScanArray Express software (PerkinElmer).
Microarray data analysis
Fluorescence intensity data for Cy3 and Cy5 channels were extracted from TIFF images using ImaGene 7.5 software (BioDiscovery Inc., El Segundo, CA). Background correction, data transformation (setting background corrected values < 0.01 to 0.01), Lowess normalization, and analysis (e.g. fold-change calculations) were performed using GeneSpring GX 7.3 (Agilent Technologies, Palo Alto, CA). Transcripts with reproducible 2-fold or greater differences in expression between TCDD exposed and control RNA samples in all slides of a given comparison (e.g. up-regulated in 1.0 ppb TCDD compared to control at the 28 d time point in all 4 replicate arrays, see Supplemental Figure 1 for design of microarray experiments) were identified with GeneSpring using Venn diagrams to determine the intersection between informative gene lists from all technical replicates in a given comparison including dye-swaps. To remove features with low-trust signal values (i.e. close to background), thresholds were calculated as the average background signal plus one standard deviation of all salmonid features for each channel of a given array. Any features with raw (non-background corrected or normalized) signal below threshold in the dominant channel (i.e. channel with the highest signal for a given comparison) in more than 1 replicate array were removed from the informative gene lists. Gene Ontology (GO) functional annotations for the cDNAs printed in the 16K cGRASP salmonid array were retrieved using the BLAST2GO (v 2.5.1) software (Conesa et al., 2005). For the details on the procedure employed for GO mapping by BLAST2GO refer to Conesa et al. (2005). Microarray data (both pre- and post-normalized) have been deposited in the Gene Expression Omnibus (GEO) database (http://www.ncbi.nlm.nih.gov/geo/). The Superseries accession number is GSE45781, and the data is accessible through GEO Series accession number GSE45779 for Experiment 1 (dose-dependent), and GSE45780 for Experiment 2 (time-dependent).
QPCR validation of selected microarray-identified TCDD exposure biomarker candidates
Real-time quantitative polymerase chain reaction (QPCR) was performed to validate the microarray results, confirm the expression of target genes of interest (GOI), and study the biological variability of transcript expression. RNA of seven individual fish was randomly selected from samples used to make pools for the microarray experiments (see above). First-strand cDNA was synthesized from 1 μg of DNase treated, column-purified RNAof individual fish with 0.1 μg random ninemers using an AffinityScriptTM Multi Temperature cDNA synthesis Kit (Agilent, CA) according to the manufacturer's protocol. QPCR primers were designed online using Primer 3 (http://frodo.wi.mit.edu/ primer3/). We used EST sequences representing the informative cDNA features printed on the microarray to perform BLASTN alignments against the EST database of NCBI (http://www.ncbi.nlm.nih.gov/dbEST/). The best (lowest E-value) hit from rainbow trout identified using BLASTN was considered to be the best putative rainbow trout ortholog of a given microarray-identified informative cDNA, and that sequence was used for primer design. The majority of cDNA features on the 16K cGRASP array are Atlantic salmon (Salmo salar) (von Schalburg et al., 2005a). Therefore the putative rainbow trout ortholog was identified if the informative feature was from Atlantic salmon; however, if the informative feature was from rainbow trout, then this sequence was directly used for QPCR primer design. Each primer pair was tested with melting curves to verify that the primers amplified a single product and that there were no primer dimers. The amplification efficiency of each primer set was determined with ABI software by generating a standard curve using five serial 4-fold dilutions of cDNA samples from the control group run in triplicates. The sequences of QPCR primers and their amplification efficiencies are shown in Supplemental Table 1.
PCR amplification was performed using the StepOnePlus™ Real-Time PCR System (Applied Biosystems, Carlsbad, CA) in 15 μl reactions using 2 μl of cDNA (10 ng of input total RNA), 50 nM each of forward and reverse primers and 1× Power SYBR Green PCR Master Mix (Applied Biosystems, Carlsbad, CA). Ubiquitin (GenBank accession number CB501475) was selected as the normalizer gene for QPCR, as it was the only gene with microarray-determined transcript expression within 1.2-fold changes in all 15 slides of microarray Experiment 1 and within 1.5-fold changes in all 16 slides of microarray Experiment 2.
For each sample, target and normalizer genes were run in triplicate on each 96-well PCR plate. The real-time PCR program consisted of 1 cycle of 95°C for 9 min; and 40 cycles of (95°C for 15 sec, 59°C for 30 sec and 72°C for 30 sec), with fluorescence detection at the end of each 60°C step. The CT values were determined using the StepOne software (version 2.1) (Applied Biosystems) with automated threshold and baseline determination. The relative starting quantity (RQ) of each transcript was calculated using the comparative CT method for relative quantification with calculated efficiencies (Livak and Schmittgen, 2001). For each target gene, the individual sample with the lowest RQ value was set as a calibrator (i.e. RQ equal to 1). Gene expression data are presented as mean (± standard error) RQ relative to the calibrator. QPCR fold changes were calculated as ratio of average RQs between treatments and control.
Statistical analysis of QPCR data was performed using SigmaStat 11.0 (Systat Software, Inc., Chicago, IL). One-way analysis of variance (ANOVA) was used to detect effects of TCDD exposure on the expression of each target gene. If the differences in the mean values among the treatment groups were greater than would be expected by chance (p<0.05), then the Tukey post-hoc test was used for pair-wise multiple comparisons. If the data failed in the Shapiro-Wilk normality test or Equal Variance Test, then Kruskal-Wallis One-Way Analysis of Variance on Ranks was used, and significant differences between treatments and control were evaluated using the Dunn's post-hoc test.
Results
Survival, growth and TCDD accumulation in TCDD-treated rainbow trout
The cumulative survival rate of dietary TCDD-treated trout during 42 d of exposure is shown in Figure 1A. After 42 days of feeding, significant mortality (p<0.05, Kaplan-Meier survival analysis with log-rank significance test) was observed in both the 10 and 100 ppb treatment groups, with survival rates of 42.5% and 0%, respectively. TCDD exposure significantly affected body length and weight in all TCDD treatment groups (Figure 1B). At 14 days, 1 ppb TCDD significantly reduced body weight and length, and 10 ppb TCDD significantly reduced body length (Figure 1B). After 28 days, body weight and length were significantly reduced in all TCDD-treatment groups compared to the controls. At 42 days, 1 ppb TCDD significantly reduced body weight, and 10 ppb TCDD significantly reduced both body weight and length (Figure 1B). A significant reduction in condition factor was only seen with 1 ppb TCDD at 14 days (Figure 1B).
Figure 1.


Survival rates and growth of TCDD-treated fish over 42 d. A) Survival rates of TCDD-treated trout within 42 d. Exposure to 10 and 100 ppb of TCDD caused significant decreases in survival of trout compared to the control group (p<0.05) by Kaplan-Meier survival analysis with log-rank significance test. B) Condition factor, body length and weight of TCDD-treated juvenile rainbow trout over 42-d dietary TCDD exposure. Condition factor was calculated as (weight [g]/length [cm]3) × 100.
Due to sensitivity limitations of the GC-ECD and the small sample size, we were only able to detect TCDD in the highest exposure group after 28 days of exposure using this technique. The recovery-corrected TCDD concentration in 100 ppb-treated fish at 28 d was 47.37 ppb (±6.56 S.E.M., analytical replicates = 3), and this result matches the level expected (48.64 ppb) from Fisk's model (Figure 2). Additional fish samples were analyzed by Thermo Electron MAT95 XP magnetic sector mass spectrometry. The recovery-corrected concentration in 0.1, 1.0 and 10 ppb-treated fish at 42 d were 0.02, 0.12 and 3.21 ppb, respectively (Figure 2). And these concentrations are lower than the predicted accumulations from Fisk's model, 0.05, 0.49 and 4.86 ppb, respectively.
Figure 2.

Semi-log plot of TCDD accumulation estimation model and TCDD measurement in juvenile rainbow trout. The model was developed by Fisk et al. (1997). TCDD accumulation in four group samples was measured: ◆100-ppb TCDD treated fish at 28 d; ■10-ppb TCDD treated fish at 42 d; ▼1-ppb TCDD treated fish at 42 d;● 0.1-ppb TCDD treated fish at 42 d.
TCDD-induced clinical toxicity and gross and microscopic lesions in juvenile rainbow trout
After 28 days of exposure to TCDD, some rainbow trout (less than 20%) in the 10 ppb and 100 ppb groups were stationary at the bottom of the tank and some swam erratically. Half of these stationary fish were diffusely dark in pigment and showed hemorrhages on the operculum covering the gills. These effects became more severe at 42 days in the 10 ppb group, and all fish in the 100 ppb group were dead by 39 days. TCDD-induced lesions were characterized as three categories: epithelial lesions, mesenchymal lesions and edema syndrome. From 28 days to 42 days, the lesions exhibited time-dependent occurrences in various organs of TCDD-treated rainbow trout (Figure 3). At 28 days, lesions were found in 10 ppb and 100 ppb treatment groups, while at 42 days some lesions were found in lower treatment group such as 0.1 ppb.
Figure 3.

Heat-map of lesions found in juvenile rainbow trout fed with TCDD-treated diets. Fish were collected at 28 d and 42 d after starting of dietary TCDD exposure. Lesions were characterized in three main categories: epithelial lesions, mesenchymal lesions and edema syndrome. The heat-map was generated based on the percentage of the fish showed the lesions in the fish used for histopathologic analysis. The percentage scale in the key goes from 0 to 1 (0, 0.2, 0.4, 0.6, 0.8 and 1).
Detailed information on epithelial lesions is shown in Supplemental Table 2. Briefly, epithelial lesions were observed in skin (spongiosis of epidermis, epithelial hyperplasia and subcutaneous hemorrhage), oropharynx (hyperplasia of mucosal epithelium), liver (depletion of glycogen and necrosis of hepatocytes), gas bladder and pneumatic duct (metaplasia, necrosis and hyperplasia of mucosal epithelium as well as underinflation of gas bladder, Figure 4), intestine and stomach (underdevelopment), pancreas (depletion of secretory granules in acinar cells), nose (degeneration of neurosensory epithelium, Figure 5), and kidney (degeneration and atrophy of glomeruli, Figure 6). Most of the epithelial lesions were observed in 10 ppb and 100 ppb groups. TCDD induced cystic degeneration of nasal epithelium in the 10 ppb group at 42 d (Figure 5).
Figure 4.

TCDD induced epithelial lesions in gas bladder of rainbow trout after 42 d of dietary exposure. A) normal gas bladder of rainbow trout in the 0 ppb (control) group; B) columnar mucoid metaplasia (*) and single cell necrosis (arrows) in caudal gas bladder of rainbow trout treated with 10 ppb-TCDD.
Figure 5.

TCDD caused degeneration in nasal epithelium in rainbow trout after 42 d of dietary exposure. A) Nasal epithelium of rainbow trout in the 0 ppb (control) group; B) cystic degeneration (arrows) of nasal epithelium was found in rainbow trout treated with 10 ppb of TCDD.
Figure 6.
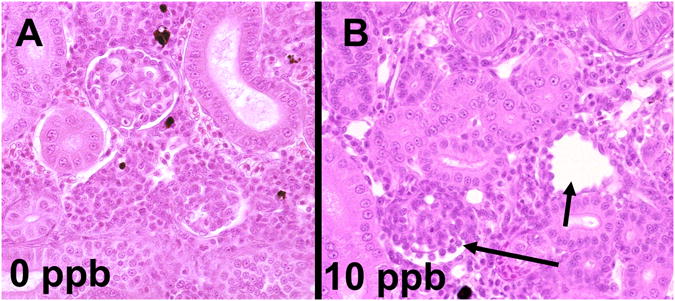
TCDD induced kidney glomerular degeneration and atrophy in rainbow trout after 28 d of dietary exposure. A) Normal kidney of rainbow trout in the 0 ppb (control) group; B) glomerular degeneration (arrows) was found in rainbow trout treated with 10 ppb of TCDD.
Regarding TCDD-caused lesions in mesenchymal tissues (Supplemental Table 3), the trout treated with 10 ppb and 100 ppb TCDD exhibited reduced numbers of blast cells in kidney marrow, depletion of abdominal fat, increased remodeling of fin rays, and anemia in peripheral blood compared with the vehicle control (i.e. 0 ppb TCDD) group. After 42 days, one of five fish treated with 0.1 ppb TCDD was anemic, and abdominal fat was reduced in 3 out of 4of the fish treated with 1 ppb TCDD. These lesions were not observed in controls.
Edema syndrome (Supplemental Table 4) was characterized by pericardial edema (Figure 7), endothelial blebs on atrial endocardium, ascites and retrobulbar hemorrhage. In the 0.1 ppb treatment group, some fish had slight pericardial edema and blebs on atrial endocardium. In the 1 ppb treatment group, fish had pericardial edema, ascites and blebs on atrial endocardium. Fish treated with 10 ppb and 100 ppb TCDD showed greater severity of the edema syndrome compared with fish in control group.
Figure 7.

TCDD induced ascites and pericardial edema in rainbow trout after 42d of dietary exposure. A) Normal heart of rainbow trout in the 0 ppb (control) group; B) ascites (*) and pericardial edema (arrow) was found in rainbow trout treated with 10 ppb of TCDD.
Dysregulated genes from microarray data and QPCR validation
One microarray slide failed quality control in the comparison between the 10 ppb group and the reference of Experiment 1 (i.e. the multi-dose, single time point microarray experiment) since this slide has a large smear and bad image quality; thus a total of 31 microarrays from both the Experiments 1 and 2 (Supplemental Figure 1) contributed to microarray data analyses. Numbers of up- and down-regulated genes with more than 2-fold changes of expression on all contributing microarray slides of a given comparison are shown in Figure 8A for Experiment 1 and Figure 8B for Experiment 2 (i.e. the single dose, multiple time point experiment). The complete lists of microarray-identified TCDD-responsive genes, including BLAST identification and microarray data (mean fold change and SEM), are shown in Supplemental Table 5. In microarray Experiment 1, the overlapping up-regulated genes at 28d for 1 ppb, 10 ppb, and 100 ppb TCDD treatments were cytochrome P450 1A3 (two microarray features represented by sequences with GenBank accession numbers CA044359 and CB501070), and cell differentiation protein rcd1 (CA051849); overlapping down-regulated genes among 1,10 and 100 ppb TCDD groups are hemoglobin subunit alpha (CB492226), hemoglobin subunit beta-1 (CK990563), tumor protein D52(CA038353), midasin (CB505759), and two unknown genes (CA053773 and CA037818) (Figure 8A; Supplemental Table 5). In microarray Experiment 2, overlapping up-regulated genes in the 10 ppb treatment group at all four time points were cytochrome P4501A1 (CB497960), and cytochrome P450 1A3 (CB501070); cell differentiation protein rcd1 (CA051849) was up-regulated at 14 d, 28 d, and 42 d time points (Figure 8B; Supplemental Table 5). Genes that were down-regulated in the 10 ppb TCDD treatment group at 14 d, 28 d, and 42 d time points were hemoglobin subunit alpha (CA041804) and hemoglobin subunit beta-1 (CA061084) (Figure 8B; Supplemental Table 5). For complete lists of TCDD-responsive transcripts identified in the microarray experiments (including BLAST information, microarray mean fold change and SEM), please see Supplemental Table 5. Note that the microarray experiments used pooled samples and included technical replicate (rather than biological replicate) arrays; therefore, microarray fold change statistics (i.e. mean and SEM) provide information on technical variability. Since the QPCR validation experiment included biological replicates (as well as technical replicates, see Methods for details), the QPCR data provide information on biological variability.
Figure 8.

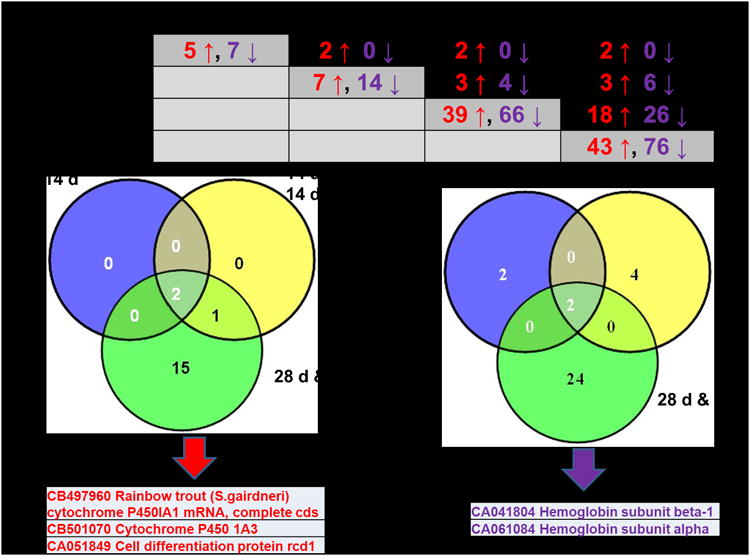
Overlapping dysregulated genes with more than two-fold changes among doses of Experiment 1 (A) or among time points of Experiment 2 (B). The numbers in red font correspond to numbers of up-regulated genes, and the numbers in purple font correspond to down-regulated genes. In Experiment 1, three and six probes were found to be up- and down-regulated, respectively, by the three highest TCDD doses (1 ppb, 10 ppb, and 100 ppb) at 28 d. In experiment 2, two probes were found to be up-regulated at all four time points, and two probes were found to be down-regulated at 14 d, 28 d and 42 d time points (Supplemental Table 5).
Most of the TCDD-induced lesions in rainbow trout were found in the 10 ppb group at 42 d and the 100 ppb group at 28 d. Thus, we identified the GO functional annotations of the microarray-identified dysregulated genes from the 10 ppb group at 42 d and the 100 ppb group at 28 d using BLAST2GO. The percentages of dysregulated genes associated with Biological Process GO terms are shown in Supplemental Figure 2. High proportions of TCDD-responsive genes (both up- and down-regulated) in the 10 ppb group (28 d) were associated with the GO terms “cellular process”, “metabolic process”, “biological regulation”, and “response to stimulus”. In the 100 ppb at 28 d group, all genes with GO Biological Process (GOBP) terms “response to stimulus” and “cell wall organization or biogenesis” were up-regulated, and all genes with GOBP terms “viral reproduction”, “growth”, and “cell proliferation” were down-regulated. High proportions of up-regulated genes for the 10 ppb group (42 d) were related to the GO terms “biological regulation”, “response to stimulus”, “metabolic process”, and “immune system process”; high proportions of down-regulated genes for the 10 ppb group (42 d) were associated with the GO terms “metabolic process”, “localization, multicellular organismal process”, and “cellular process” . In the 10 ppb at 42 d group, all genes with GOBP terms “immune system process”, “locomotion”, “death”, “cell proliferation”, and “multi-organism process” were up-regulated.
Nine microarray-identified genes were selected for QPCR validation (Figure 9). Cytochrome P450 1A3 (CYP1A3), cytochrome P450IA1 (CYP1A1) and cell differentiation protein rcd1 (RCD1) were common up-regulated genes based on microarray data (Figure 8; Supplemental Table 5). By QPCR validation, expression of CYP1A3 showed a significant induction in each group in Experiments 1 and 2, except for 0.1 ppb at 28 d (Figure 9A). CYP1A3 transcript was significantly induced (compared with time-matched controls) in the 1 ppb, 10 ppb and 100 ppb groups at 28 d and in all four time points in the single-dose (10 ppb) experiment (Figure 9A). QPCR showed that maximum CYP1A3 transcript induction (70-fold compared with time-matched control group) was observed in the 100 ppb 28 d group (Figure 9A). CYP1A1 transcript was shown by QPCR to be significantly up-regulated in the 10 ppb and 100 ppb groups at 28 d and in the 7 d, 14 d, and 28 d time points in the single-dose experiment (Figure 9B). Maximum CYP1A1 transcript induction (101.7-fold compared with dose-matched control group) was observed in the 100 ppb 28 d group (Figure 9B). QPCR showed that RCD1 transcript was weakly (1.5 to 2-fold) and non-significantly up-regulated in 0.1 ppb, 1 ppb, and 10 ppb groups, and significantly 4.4-fold up-regulated in the 100 ppb group in the multi-dose, single time-point experiment (Figure 9C); in the 10 ppb multiple time-point experiment, QPCR showed that RCD1 was 1.9-fold induced at 14 d and 42 d, although this up-regulated was only significant at 14 d (Figure 9C).
Figure 9.


QPCR analyses of selected microarray-identified genes. Gene expression data are presented as mean (±standard error) RQ (relative quantity) normalized to ubiquitin and calibrated to the individual with the lowest expression of target gene. Overall fold-changes are presented in the box under the bar. Fold up-regulation (in a white box) was calculated as (average RQ of treatment group) / (average RQ of 0 ppb group, and fold down-regulation (in a black box) where appropriate was calculated as the inverse of fold up-regulation. Letters denote statistically significant differences (p<0.05), and asterisks (*) represent significant (p < 0.05) difference compared to controls using multiple comparison test by one-way ANOVA.
Hemoglobin subunit beta-1(HBB1) was down-regulated genes in both microarray Experiments 1 and 2 (Figure 8; Supplemental Table 5). QPCR showed that HBB1 was weakly (1.9-2.2 fold) and non-significantly down-regulated in 0.1 ppb and 1 ppb groups, and significantly 10-fold down-regulated in 10 ppb and 100 ppb groups in the multi-dose, single time-point experiment (Figure 9D). In the 10 ppb multiple time-point experiment, QPCR showed that HBB1 was significantly 4.4-fold down-regulated at 14 d and significantly down-regulated more than 10-fold at both 28 d and 42 d time points (Figure 9D).
Complement component C3-1 and C1q and tumor necrosis factor related protein 3 (C1QTNF3) are up-regulated in the 10 and 100 ppb groups at 28 d (Supplemental Table 5). QPCR showed that complement C3-1 transcript was significantly over 11-fold induced in 10 ppb and 100 ppb groups at 28 d in the multi-dose experiment, and significantly over 8-fold induced in 10 ppb group at both 28 d and 42 d in the single-dose, multiple time-point experiment (Figure 9E). No significant changes in the expression of C1QTNF3 transcript were observed by QPCR, although the microarray and QPCR data showed the same trend (i.e. induction by TCDD) for C1QTNF3 expression in 10 ppb and 100 ppb groups (Figure 9F; Supplemental Table 5). Microarray data for tumor protein D52 (CA038353) showed down-regulation in the 1, 10 and 100 ppb groups in Experiment 1, and in the 28 and 42 d time points in Experiment 2 (Supplemental Table 5); the QPCR data for this gene showed slight (less than 1.5-fold), non-significant down-regulation at 0.1 ppb and 1 ppb groups of the multi-dose experiment, and at 7 d, 28 d, and 42 d of the single-dose, multiple time-point experiment (Figure 9G). Contrary to the microarray results, QPCR showed that tumor protein D52 transcript was significantly 3.8-fold up-regulated in 100 ppb group at 28 d, and significantly 2.3-fold up-regulated in 10 ppb group at 14 d (Figure 9G). Metalloproteinase inhibitor 2 precursor (CA054726, TIMP2) was selected for QPCR because it was up-regulated 2.7-fold with 0.1 ppb at 28 d, however QPCR data showed TIMP2 transcript was only upregulated in 10 ppb at 14 d and 100 ppb at 28 d (Figure 9H). Microarray data for trypsin-1 precursor (CB511628) exhibited more than two-fold reduction with10 ppb at 42 d, but an induction with 100 ppb at 28 d (Supplemental Table 5). The QPCR data for trypsin-1 precursor are consistent with the microarray data for this gene, showing 5.3-fold non-significant down-regulation and 6.7-fold significant down-regulation in 10 ppb group at 28 d and 42 d, respectively, and 21.3-fold significant up-regulation in 100 ppb group at 28 d (Figure 9I).
Discussion and Summary
Survival, growth, and bioaccumulation in TCDD-treated juvenile rainbow trout
In the present study, TCDD did cause overt adverse effects on juvenile trout, including lowered body weight and length in the 10 and 100 ppb TCDD groups after 28 d (Figure 1B), and showed 100% lethality in the 100 ppb TCDD group at 39 d (Figure 1A). The survival rate curve in Figure 1A indicates that the LD50 of dietary TCDD for juvenile trout at 42 d in our study is close to 10 ppb. Based on previous reports recorded in the Pesticide Action Network (PAN) Pesticide Database (http://www.pesticideinfo.org/), most dietary TCCD exposures have been performed in juvenile fish larger than 3 g or in adults. Previous research reported that juvenile rainbow trout (3-7 g) did not exhibit an increase in relative lethality after dietary TCDD at 494 ppt in food over 13 weeks (Kleeman et al., 1986), and dietary TCDD at 413 ppt in food caused 13% mortality in larger juvenile trout (5-9 g) after 180 d (Fisk et al., 1997; Hektoen et al., 1994). In juvenile rainbow trout with 35 g of body weight, LD50 of TCDD ranges from 7 to 15 ppb (Spitsbergen et al., 1988b). Our results more closely resemble results for the larger juvenile trout studied in Kleeman et al. (1986) in comparison to the hatchlings studied by Walker and Peterson (1991). The study by Walker and Peterson (1991) showed that LD50 of TCDD in fry stages (from hatching onset to swim-up) of rainbow trout ranges from 0.2-0.5 ppb, suggesting that trout at earlier developmental stages with smaller body sizes may be more vulnerable to the effects of TCDD exposure than the approximately 0.2 g through 35 g fish studied by ourselves and Kleeman et al. (1986) respectively.
Our results were consistent with the TCDD bioaccumulation model of Fisk and colleagues (1997) of TCDD bioaccumulation at the 100 ppb dose range at 42 d despite a relatively limit of detection in our study. Using Fisk's model as a guide, we expected quantifiable TCDD concentrations show dose-dependent accumulation in fish, and this was confirmed with the second analytical measurement. However, bioaccumulation of TCDD at 28 d in fish treated with TCDD of lower than 100 ppb are lower than those from the Fisk's model. This suggests that Fisk's model can apply to young juvenile rainbow trout at high dietary TCDD levels, however, the model overestimates TCDD body burden at lower dietary exposures.
The trout in our study were younger and smaller than those reported in the study of Fisk and colleagues (1997), which necessitated the use of multiple fish per extraction; the young age and low body fat of fish in the current study were likely responsible for the low overall TCDD concentrations detected. This suggested deviation from the model in younger and smaller rainbow trout at the lower dosage range. However additional work must be done to confirm these findings, and to test the hypothesis that TCDD bioaccumulation may vary in early and later juvenile stages of rainbow trout.
TCDD-induced lesions in rainbow trout
In our study, TCDD (in the ppb range) caused epithelial and mesenchymal lesions in skin, liver, digestive tract, kidney and nose with multiple edema syndromes in juvenile rainbow trout with body weight lower than those used by Spitsbergen et al. (1988b). Most of these the histopathologic findings reflect similarities to previous studies in juvenile fish by Spitsbergen et al (1988a, b), and share some overlapping features to the previous studies in fry and adult fish, such as edema syndrome (in fry) and lesions in liver and digestive tract (in adult) (Giesy et al., 2002; Hornung et al., 1999; Spitsbergen et al., 1991; Walter et al., 2000). Lesions caused by TCDD exposure in animals vary greatly depending on species, strain and age at exposure. However, overall the main target tissues are lymphomyeloid, epithelial, and cardiovascular tissues (Kimbrough, 1983; McConnell et al., 1984; McConnell et al., 1978; van Logten et al., 1980).
The most significant and novel finding in our study is the TCDD-induced lesions in nasal neurosensory epithelium of rainbow trout, and it is the first report of TCDD-induced lesions in nasal neurosensory epithelium in rainbow trout. The fish size in the present study (started with 0.18 g) was much smaller than previous studies of juvenile fish (range 6-250 g) (Spitsbergen et al., 1988b), suggesting that fish nervous system (e.g., olfactory neurosensory epithelial) is be more vulnerable to TCDD exposure when fish are at younger age with smaller body size.
TCDD-induced neuronal toxicities in mammals have been reported. In rats and mice, TCDD induced apoptosis in granule neuron cells in the cerebellum and increased reactive oxygen species (ROS) formation, resulting in cognitive and motor dysfunction (Collins et al., 2008; Kim and Yang, 2005). Dietary TCDD exposure caused neurobehavioral dysfunction in rats, including deficits in spatial learning and visual abilities (Seo et al., 1999), and a reduction in motor abilities in running-wheel tests (Markowski et al., 2001). However, there is much less information reported regarding TCDD-induced neurotoxicity in rainbow trout, except for TCDD-induced decreases in the densities of retinal ganglion cells (RGCs) in one publication (Carvalho and Tillitt, 2004). Moreover, there are no previous reports of TCDD-induced morphologic lesions in the olfactory organ of fish. In rat and mice, olfactory mucosa is a binding site for TCDD as determined by autoradiography (Gillner et al., 1987), and intraperitoneal injection of 5 ppb TCDD enhanced activities of metabolic enzymes in olfactory mocosa of rats (Genter et al., 2002). Dioxin-like (co-planar) compounds (such as polychlorinated biphenyls, PCBs) were also found to cause hyperplastic and metaplastic changes within the nasal mucosa in rats (Nyska et al., 2005). Female dark mink had focal lymphocytic meningitis in regions of the olfactory bulb after chronic TCDD exposure (Hochstein et al., 2001). In the present study, we show new evidence of neuronal toxicity induced by dietary TCDD in nasal neurosensory epithelium of fish. The lesions in nasal neurosensory epithelium might damage the fish's food-sensing abilities. The neuroepithelial tissue of the nose of salmonids is also essential for homing to their breeding grounds so that these TCDD-induced lesions could have serious implications for potential disruption of breeding.
In addition, the necrosis and underinflation of the gas bladder may also explain in part why TCDD-treated fish were stationary at the bottom of the tanks and showed a great overall loss of movement. The planes of section of tissues examined in this study did not include thymus so that we cannot evaluate possible thymic involution in the fish from this study.
Gene expression in rainbow trout due to TCDD exposure
In the study, we use whole fish extraction strategy to develop a method for identifying biomarkers of TCDD, since it is convenient and applicable for most labs that are using fish samples for ecotoxicology study, especially when fish are small and tissues in small fish may be difficult to work in field study. Direct comparison microarray experimental designs involving pooled samples and technical replicate arrays with dye-swaps (similar to the experimental designs employed in the current study) have been effectively used to identify candidate molecular biomarkers of fish cell or tissue responses to pathogens(Rise et al., 2004a; Workenhe et al., 2009), growth hormone transgenesis (Rise et al., 2006), and decreased temperature (Hall et al., 2011).
In rainbow trout, there are two isoforms of CYP1A genes, CYP1A1 and CYP1A 1A3; they share high conservation of nucleotide sequences and both can be induced by TCDD exposure (Carvan et al., 1999; Råbergh et al., 2000). We found both CYP1A1 and CYP1A3 showed dose- and time-dependent induction with TCDD exposure, indicating that they are robust biomarkers for TCDD exposure in rainbow trout. That CYP1A genes act as biomarkers to TCDD exposure is consistent with previous study by Finne et al. (2007).
TCDD caused decreases in concentration of hemoglobin in mice (Vos et al., 1974). In the present study, HBB1 showed more than 10-fold changes in expression in the 10 and 100 ppb groups after 28 d. The microarray Experiments 1 and 2 showed that more than 100 probes annotated as hemoglobin alpha or beta subunit were down-regulated with more than two-fold changes (Supplemental Table 5). This correlates with the anemia observed in peripheral blood in the present study that might result from TCDD-induced decreases in hemoglobin production in rainbow trout or from erythrocyte destruction resulting from circulatory disruption and regional hypoxia or hemorrhage (Bukowska, 2004; Chu et al., 2001; Spitsbergen et al., 1991).
Trypsin-1 acts as a protease in pancreas (Hirota et al., 2006), and expression of trypsin-1 precursor transcripts exhibited an induction with 100 ppb at 28 d, indicating the disruption of metabolic process in TCDD-treated trout. Complement component C3 was found to be involved in regulating immune response processes (Lambris, 1993; Sunyer et al., 1996), and it appears to be a good biomarker at 10 and 100 ppb at 28 and 42 d of treatment.
Microarrays are a powerful tool that can be used to explore the molecular mechanisms and identify biomarkers for TCDD exposure. The 16K cGRASP microarray contains 13,421 Atlantic salmon and 2,576 rainbow trout cDNA features. The average percentage binding of Atlantic salmon and rainbow trout liver targets to the 16K chip was 54.0% and 63.3%, respectively (von Schalburg et al., 2005a). Salmonid cDNA microarrays have been shown to be effective functional genomics tools for a variety of experimental applications in rainbow trout (Finne et al., 2007; Lewis et al., 2010; Tymchuk et al., 2009; von Schalburg et al., 2005b). Therefore, it is a suitable tool for the current gene expression analyses to identify biomarkers in TCDD-treated rainbow trout. There are some possibilities of causing discrepancies in gene expression between QPCR and microarray, such as different location of microarray probe and QPCR amplicon, or unidentified paralogs or other related transcripts that may influence the microarray hybridization results. There could be general unspecific binding, for example, the printed cDNAs are of different sizes and therefore have different melting temperatures (Tms), but due to the nature of a microarray there was only one hybridization temperature.
In conclusion, dietary TCDD exposure significantly influenced growth and survival of juvenile rainbow trout. We found epithelial and mesenchymal lesions and edema syndromes in TCDD-treated fish following four weeks of dietary exposure, and these dose- and time-dependent pathologic results reflect some similarities between adult and embryonic exposures to TCDD. The enriched GO terms for dysregulated genes were correlated with the pathologic outcomes in juvenile rainbow trout. HBB1, CYP1A1 and CYP1A3 were the most robust biomarkers for TCDD-treated trout; and complement component C3, trypsin-1 precursor and TIMP2 transcripts can also be used as molecular biomarkers for TCDD exposure at certain levels. We suggest that our biomarker analysis using whole fish bodies can be applied to assessments in the field by collecting whole fish for RNA isolation and biomarker gene expression analyses. A high-quality reference genome sequence for rainbow trout would be very useful for identifying all paralogs and other related transcripts that could influence hybridization results in toxicogenomics microarray experiments, facilitating the development of paralog-specific QPCR assay for toxicant-responsive genes of interest.
Supplementary Material
Highlights.
First report of the effects of dietary TCDD in juvenile trout smaller than 20g
TCDD uptake was estimated using published models and confirmed by GC
First report of dietary TCDD-induced lesions in nasal epithelium in any species
Several useful biomarkers are identified from microarray-based transcriptomics analysis
Acknowledgments
This research has been supported by the Wisconsin Sea Grant College Program (R/BT-21), UWM Children's Environmental Health Sciences Core Center (NIEHS 2P30ES004184), and the Shaw Fund of the Greater Milwaukee Foundation. Great thanks to Jennifer R. Hall (Ocean Sciences Centre, Memorial University of Newfoundland) for the technical assistance of microarray hybridizations. Many thanks to Kendrick Wall, Susan Miller, Arie Brenner, Doug Kline and Matt Pickens for their technical assistance. Matthew L. Rise holds the Canada Research Chair (tier 2) in Marine Biotechnology at Ocean Sciences Centre, Memorial University of Newfoundland. This paper has been submitted by Qing Liu in partial fulfillment of the requirements for the Ph.D. degree in Biological Sciences at the University of Wisconsin-Milwaukee.
Footnotes
Publisher's Disclaimer: This is a PDF file of an unedited manuscript that has been accepted for publication. As a service to our customers we are providing this early version of the manuscript. The manuscript will undergo copyediting, typesetting, and review of the resulting proof before it is published in its final citable form. Please note that during the production process errors may be discovered which could affect the content, and all legal disclaimers that apply to the journal pertain.
References
- Antunes P, Viana P, Vinhas T, Capelo JL, Rivera J, Gaspar EM. Optimization of pressurized liquid extraction (PLE) of dioxin-furans and dioxin-like PCBs from environmental samples. Talanta. 2008;75:916–925. doi: 10.1016/j.talanta.2007.12.042. [DOI] [PubMed] [Google Scholar]
- Bukowska B. Damage to erythrocytes caused by 2,3,7,8-tetrachloro-dibenzo-p-dioxin (in vitro) Cell Mol Biol Lett. 2004;9:261–270. [PubMed] [Google Scholar]
- Carvalho PS, Tillitt DE. 2, 3, 7, 8-TCDD effects on visual structure and function in swim-up rainbow trout. Environ Sci Technol. 2004;38:6300–6306. doi: 10.1021/es034857i. [DOI] [PubMed] [Google Scholar]
- Carvan MJ, III, Ponomareva LV, Solis WA, Matlib RS, Puga A, Nebert DW. Trout CYP1A3 Gene: Recognition of Fish DNA Motifs by Mouse Regulatory Proteins. Mar Biotechnol. 1999;1:155–166. doi: 10.1007/pl00011763. [DOI] [PubMed] [Google Scholar]
- Chu I, Lecavalier P, Håkansson H, Yagminas A, Valli VE, Poon P, Feeley M. Mixture effects of 2,3,7,8-tetrachlorodibenzo-p-dioxin and polychlorinated biphenyl congeners in rats. Chemosphere. 2001;43:807–814. doi: 10.1016/s0045-6535(00)00437-9. [DOI] [PubMed] [Google Scholar]
- Collins LL, Williamson MA, Thompson BD, Dever DP, Gasiewicz TA. Opanashuk LA. 2, 3, 7, 8-Tetracholorodibenzo-p-dioxin exposure disrupts granule neuron precursor maturation in the developing mouse cerebellum. Toxicol Sci. 2008;103:125–136. doi: 10.1093/toxsci/kfn017. [DOI] [PubMed] [Google Scholar]
- Cook PM, Robbins JA, Endicott DD, Lodge KB, Guiney PD, Walker MK, Zabel EW, Peterson RE. Effects of aryl hydrocarbon receptor-mediated early life stage toxicity on lake trout populations in Lake Ontario during the 20th century. Environ Sci Technol. 2003;37:3864–3877. doi: 10.1021/es034045m. [DOI] [PubMed] [Google Scholar]
- Dong W, Teraoka H, Yamazaki K, Tsukiyama S, Imani S, Imagawa T, Stegeman JJ, Peterson RE, Hiraga T. 2,3,7,8-tetrachlorodibenzo-p-dioxin toxicity in the zebrafish embryo: local circulation failure in the dorsal midbrain is associated with increased apoptosis. Toxicol Sci. 2002;69:191–201. doi: 10.1093/toxsci/69.1.191. [DOI] [PubMed] [Google Scholar]
- Finne EF, Cooper GA, Koop BF, Hylland K, Tollefsen KE. Toxicogenomic responses in rainbow trout (Oncorhynchus mykiss) hepatocytes exposed to model chemicals and a synthetic mixture. Aquat Toxicol. 2007;81:293–303. doi: 10.1016/j.aquatox.2006.12.010. [DOI] [PubMed] [Google Scholar]
- Fisk AT, Yarechewski AL, Metner DA, Evans RE, Lockhart WL, Muir DCG. Accumulation, depuration and hepatic mixed-function oxidase enzyme induction in juvenile rainbow trout and lake whitefish exposed to dietary 2,3,7,8-tetrachlorodibenzo -p-dioxin. Aquatic Toxicology. 1997;37:201–220. [Google Scholar]
- Genter MB, Apparaju S, Desai PB. Induction of olfactory mucosal and liver metabolism of lidocaine by 2,3,7,8-tetrachlorodibenzo-p-dioxin. J Biochem Mol Toxicol. 2002;16:128–134. doi: 10.1002/jbt.10032. [DOI] [PubMed] [Google Scholar]
- Giesy JP, Jones PD, Kannan K, Newsted JL, Tillitt DE, Williams LL. Effects of chronic dietary exposure to environmentally relevant concentrations to 2,3,7,8-tetrachlorodibenzo-p-dioxin on survival, growth, reproduction and biochemical responses of female rainbow trout (Oncorhynchus mykiss) Aquatic Toxicology. 2002;59:35–53. doi: 10.1016/s0166-445x(01)00235-1. [DOI] [PubMed] [Google Scholar]
- Gillner M, Brittebo EB, Brandt I, Söderkvist P, Appelgren LE, Gustafsson JA. Uptake and specific binding of 2,3,7,8-tetrachlorodibenzo-p-dioxin in the olfactory mucosa of mice and rats. Cancer Res. 1987;47:4150–4159. [PubMed] [Google Scholar]
- Hall JR, Clow KA, Rise ML, Driedzic WR. Identification and validation of differentially expressed transcripts in a hepatocyte model of cold-induced glycerol production in rainbow smelt (Osmerus mordax) American Journal of Physiology – Regulatory, Integrative and Comparative Physiology. 2011;301:R995–R1010. doi: 10.1152/ajpregu.00210.2011. [DOI] [PubMed] [Google Scholar]
- Hektoen H, Bernhoft A, Ingebrigtsen K, Skaare JU, Goksøyr A. Response of hepatic xenobiotic metabolizing enzymes in rainbow trout (Oncorhynchus mykiss) and cod (Gadus morhua) to 2,3,7,8-tetrachlorodibenzo-p-dioxin (2,3,7,8-TCDD) Aquatic Toxicology. 1994;28:97–106. [Google Scholar]
- Hill A, Howard CV, Strahle U, Cossins A. Neurodevelopmental defects in zebrafish (Danio rerio) at environmentally relevant dioxin (TCDD) concentrations. Toxicol Sci. 2003;76:392–399. doi: 10.1093/toxsci/kfg241. [DOI] [PubMed] [Google Scholar]
- Hochstein MSJ, Render JA, Bursian SJ, Aulerich RJ. Chronic toxicity of dietary 2,3,7,8-tetrachlorodibenzo-p-dioxin to mink. Vet Hum Toxicol. 2001;43:134–139. [PubMed] [Google Scholar]
- Hornung MW, Spitsbergen JM, Peterson RE. 2,3,7,8-Tetrachlorodibenzo-p-dioxin alters cardiovascular and craniofacial development and function in sac fry of rainbow trout (Oncorhynchus mykiss) Toxicol Sci. 1999;47:40–51. doi: 10.1093/toxsci/47.1.40. [DOI] [PubMed] [Google Scholar]
- Hutz RJ, Carvan MJ, III, Baldridge MG, Conley LK, Heiden TK. Environmental toxicants and effects on female reproductive function. Tren Reprod Bio. 2006;2:1–11. doi: 10.1901/jaba.2006.2-1. [DOI] [PMC free article] [PubMed] [Google Scholar]
- Kim SY, Yang JH. Neurotoxic effects of 2,3,7,8-tetrachlorodibenzo-p-dioxin in cerebellar granule cells. Exp Mol Med. 2005;37:58–64. doi: 10.1038/emm.2005.8. [DOI] [PubMed] [Google Scholar]
- Kimbrough RD. Morphology of lesions produced by the dioxins and related compounds. Environmental Science Research. 1983;26:527–538. [Google Scholar]
- King Heiden TC, Spitsbergen J, Heideman W, Peterson RE. Persistent adverse effects on health and reproduction caused by exposure of zebrafish to 2, 3, 7, 8-tetrachlorodibenzo-p-dioxin during early development and gonad differentiation. Toxicol Sci. 2009;109:75–87. doi: 10.1093/toxsci/kfp048. [DOI] [PMC free article] [PubMed] [Google Scholar]
- Kleeman JM, Olson JR, Chen SM, Peterson RE. Metabolism and disposition of 2, 3, 7,8-tetrachlorodibenzo-p-dioxin in rainbow trout. Toxicol Appl Pharmacol. 1986;83:391–401. doi: 10.1016/0041-008x(86)90221-8. [DOI] [PubMed] [Google Scholar]
- Kociba RJ, Keyes DG, Beyer JE, Carreon RM, Wade CE, Dittenber DA, Kalnins RP, Frauson LE, Park CN, Barnard SD, Hummel RA, Humiston CG. Results of a two-year chronic toxicity and oncogenicity study of 2, 3, 7, 8-tetrachlorodibenzo-p-dioxin in rats. Toxicol Appl Pharmacol. 1978;46:279–303. doi: 10.1016/0041-008x(78)90075-3. [DOI] [PubMed] [Google Scholar]
- Koop BF, von Schalburg KR, Leong J, Walker N, Lieph R, Cooper GA, Robb A, Beetz-Sargent M, Holt RA, Moore R, Brahmbhatt S, Rosner J, Rexroad CE, McGowan CR, Davidson WS. A salmonid EST genomic study: genes, duplications, phylogeny, and microarrays. BMC Genomics. 2008;9:545. doi: 10.1186/1471-2164-9-545. [DOI] [PMC free article] [PubMed] [Google Scholar]
- Lambris JD. The chemistry, biology, and phylogeny of C3. Complement Profile. 1993;1:16–45. [Google Scholar]
- Lewis JM, Hori TS, Rise ML, Walsh PJ, Currie S. Transcriptome responses to heat stress in the nucleated red blood cells of the rainbow trout (Oncorhynchus mykiss) Physiol Genomics. 2010;42:361–373. doi: 10.1152/physiolgenomics.00067.2010. [DOI] [PubMed] [Google Scholar]
- Livak KJ, Schmittgen TD. Analysis of relative gene expression data using real-time quantitative PCR and the 2(-Delta Delta C(T)) Method. Methods. 2001;25:402–408. doi: 10.1006/meth.2001.1262. [DOI] [PubMed] [Google Scholar]
- Markowski VP, Zareba G, Stern S, Cox C, Weiss B. Altered operant responding for motor reinforcement and the determination of benchmark doses following perinatal exposure to low-level 2,3,7,8-tetrachlorodibenzo-p-dioxin. Environ Health Perspect. 2001;109:621–627. doi: 10.1289/ehp.01109621. [DOI] [PMC free article] [PubMed] [Google Scholar]
- McConnell EE, Lucier GW, Rumbaugh RC, Albro PW, Harvan DJ, Hass JR, Harris MW. Dioxin in soil: bioavailability after ingestion by rats and guinea pigs. Science. 1984;223:1077–1079. doi: 10.1126/science.6695194. [DOI] [PubMed] [Google Scholar]
- McConnell EE, Moore JA, Dalgard DW. Toxicity of 2,3,7,8-tetrachlorodibenzo-p-dioxin in rhesus monkeys (Macaca mulatta) following a single oral dose. Toxicol Appl Pharmacol. 1978;43:175–187. doi: 10.1016/s0041-008x(78)80042-8. [DOI] [PubMed] [Google Scholar]
- Nyska A, Yoshizawa K, Jokinen MP, Brix AE, Sells DM, Wyde ME, Orzech DP, Kissling GE, Walker NJ. Olfactory epithelial metaplasia and hyperplasia in female Harlan Sprague-Dawley rats following chronic treatment with polychlorinated biphenyls. Toxicol Pathol. 2005;33:371–377. doi: 10.1080/01926230590930209. [DOI] [PubMed] [Google Scholar]
- Råbergh CM, Vrolijk NH, Lipsky MM, Chen TT. Differential expression of two CYP1A genes in rainbow trout (Oncorhynchys mykiss) Toxicol Appl Pharmacol. 2000;165:195–205. doi: 10.1006/taap.2000.8941. [DOI] [PubMed] [Google Scholar]
- Rise ML, Douglas SE, Sakhrani D, Williams J, Ewart KV, Rise M, Davidson WS, Koop BF, Devlin RH. Multiple microarray platforms utilized for hepatic gene expression profiling of growth hormone transgenic coho salmon with and without ration restriction. Journal of Molecular Endocrinology. 2006;37:259–282. doi: 10.1677/jme.1.02031. [DOI] [PubMed] [Google Scholar]
- Rise ML, Jones SRM, Brown GD, von Schalburg KR, Davidson WS, Koop BF. Microarray analyses identify molecular biomarkers of Atlantic salmon macrophage and hematopoietic kidney response to Piscirickettsia salmonis infection. Physiological Genomics. 2004a;20:21–35. doi: 10.1152/physiolgenomics.00036.2004. [DOI] [PubMed] [Google Scholar]
- Rise ML, von Schalburg KR, Brown GD, Mawer MA, Devlin RH, Kuipers N, Busby M, Beetz-Sargent M, Alberto R, Gibbs AR, Hunt P, Shukin R, Zeznik JA, Nelson C, Jones SRM, Smailus DE, Jones SJM, Schein JE, Marra MA, Butterfield YSN, Stott JM, Ng SHS, Davidson WS, Koop BF. Development and application of a salmonid EST database and cDNA microarray: data mining and interspecific hybridization characteristics. Genome Research. 2004b;14:478–490. doi: 10.1101/gr.1687304. [DOI] [PMC free article] [PubMed] [Google Scholar]
- Ryan JJ, Lau PY, Pilon JC, Lewis D, McLeod HA, Gervais A. Incidence and levels of 2,3,7,8-tetrachlorodibenzo-p-dioxin in Lake Ontario commercial fish. Environ Sci Technol. 1984;18:719–721. [Google Scholar]
- Safe S, Wang F, Porter W, Duan R, McDougal A. Ah receptor agonists as endocrine disruptors: antiestrogenic activity and mechanisms. Toxicol Lett. 1998;102(103):343–347. doi: 10.1016/s0378-4274(98)00331-2. [DOI] [PubMed] [Google Scholar]
- Schrenk D. Impact of dioxin-type induction of drug-metabolizing enzymes on the metabolism of endo- and xenobiotics. Biochem Pharmacol. 1998;55:1155–1162. doi: 10.1016/s0006-2952(97)00591-1. [DOI] [PubMed] [Google Scholar]
- Seo BW, Sparks AJ, Medora K, Amin S, Schantz SL. Learning and memory in rats gestationally and lactationally exposed to 2,3,7,8-tetrachlorodibenzo-p-dioxin (TCDD) Neurotoxicol Teratol. 1999;21:231–239. doi: 10.1016/s0892-0362(98)00049-x. [DOI] [PubMed] [Google Scholar]
- Spitsbergen JM, Kleeman JM, Peterson RE. 2,3,7,8-Tetrachlorodibenzo-p-dioxin toxicity in yellow perch (Perca flavescens) J Toxicol Environ Health. 1988a;23:359–383. doi: 10.1080/15287398809531120. [DOI] [PubMed] [Google Scholar]
- Spitsbergen JM, Kleeman JM, Peterson RE. Morphologic lesions and acute toxicity in rainbow trout (Salmo gairdneri) treated with 2,3,7,8-tetrachlorodibenzo-p-dioxin. J Toxicol Environ Health. 1988b;23 doi: 10.1080/15287398809531119. [DOI] [PubMed] [Google Scholar]
- Spitsbergen JM, Walker AK, Olson JR, Peterson RE. Pathologic alterations in early life stages of lake trout, Salvelinus namaycush, exposed to 2,3,7,8-tetrachlorodibenzo-p-dioxin as fertilized eggs. Aquatic Toxicology. 1991;19:41–71. [Google Scholar]
- Stohs SJ. Oxidative stress induced by 2, 3, 7, 8-tetrachlorodibenzo-p-dioxin (TCDD) Free Radic Biol Med. 1990;9:79–90. doi: 10.1016/0891-5849(90)90052-k. [DOI] [PubMed] [Google Scholar]
- Sunyer JO, Zarkadis IK, Sahu A, Lambris JD. Multiple forms of complement C3 in trout that differ in binding to complement activators. Proc Natl Acad Sci U S A. 1996;93:8546–8551. doi: 10.1073/pnas.93.16.8546. [DOI] [PMC free article] [PubMed] [Google Scholar]
- Thorgaard G, Bailey GS, Williams D, Buhler DR, Kaattari SL, Ristow SS, Hansen JD, Winton JR, Bartholomew JL, Nagler JJ, Walsh PJ, Vijayan MM, Devlin RH, Hardy RW, Overturf KE, Young WP, Robison BD, Rexroad C, Palti Y. Status and opportunities for genomics research with rainbow trout. Comp Biochem Physiol B Biochem Mol Biol. 2002;133:609–646. doi: 10.1016/s1096-4959(02)00167-7. [DOI] [PubMed] [Google Scholar]
- Turyk ME, Bhavsar SP, Bowerman W, Boysen E, Clark M, Diamond M, Mergler D, Pantazopoulos P, Schantz S, Carpenter DO. Risks and benefits of consumption of Great Lakes fish. Environ Health Perspect. 2012;120:11–18. doi: 10.1289/ehp.1003396. [DOI] [PMC free article] [PubMed] [Google Scholar]
- Tymchuk W, Sakhrani D, Devlin R. Domestication causes large-scale effects on gene expression in rainbow trout: analysis of muscle, liver and brain transcriptomes. Gen Comp Endocrinol. 2009;164:175–183. doi: 10.1016/j.ygcen.2009.05.015. [DOI] [PubMed] [Google Scholar]
- van Logten MJ, Gupta BN, McConnell EE, Moore JA. Role of the endocrine system in the action of 2,3,7,8-tetrachlorodibenzo-p-dioxin (TCDD) on the thymus. Toxicology. 1980;15:135–144. doi: 10.1016/0300-483x(80)90007-4. [DOI] [PubMed] [Google Scholar]
- von Schalburg KR, Rise ML, Brown GD, Davidson WS, Koop BF. A comprehensive survey of the genes involved in maturation and development of the rainbow trout ovary. Biol Reprod. 2005b;72 doi: 10.1095/biolreprod.104.034967. [DOI] [PubMed] [Google Scholar]
- von Schalburg KR, Rise ML, Cooper GA, Brown GD, Gibbs AR, Nelson CC, Davidson WS, Koop BF. Fish and chips: Various methodologies demonstrate utility of a 16,006-gene salmonid microarray. BMC Genomics. 2005a;6:126–133. doi: 10.1186/1471-2164-6-126. [DOI] [PMC free article] [PubMed] [Google Scholar]
- Vos JG, Moore JA, Zinkl JG. Toxicity of 2,3,7,8-tetrachlorodibenzo-p-dioxin (TCDD) in C57B1/6 mice. Toxicol Appl Pharmacol. 1974;29:229–241. doi: 10.1016/0041-008x(74)90060-x. [DOI] [PubMed] [Google Scholar]
- Walker MK, Peterson RE. Potencies of polychlorinated dibenzo-p-dioxins, dibenzofurans, and biphenyls, relative to 2,3,7,8-tetrachlorodibenzo-p-dioxin, for producing early life stage mortality in rainbow trout (Oncorhynchus mykiss) Aquat Toxicol. 1991;21:219–238. [Google Scholar]
- Walter GL, Jones PD, Giesy JP. Pathologic alterations in adult rainbow trout, Oncorhynchus mykiss, exposed to dietary 2,3,7,8-tetrachlorodibenzo-p-dioxin. Aquat Toxicol. 2000;50:287–299. doi: 10.1016/s0166-445x(00)00095-3. [DOI] [PubMed] [Google Scholar]
- White SS, Birnbaum LS. An overview of the effects of dioxins and dioxin-like compounds on vertebrates, as documented in human and ecological epidemiology. J Environ Sci Health C Environ Carcinog Ecotoxicol Rev. 2009;27:197–211. doi: 10.1080/10590500903310047. [DOI] [PMC free article] [PubMed] [Google Scholar]
- William DE, Bailey GS, Reddy A, Hendricks JD, Oganesian A, Orner GA, Pereira CB, Swenberg JA. The rainbow trout (Oncorhynchus mykiss) tumor model: recent applications in low-dose exposures to tumor initiators and promoters. Toxicol Pathol. 2003;31 Suppl:58–61. [PubMed] [Google Scholar]
- Workenhe ST, Hori TS, Rise ML, Kibenge MJT, Kibenge FSB. Infectious salmon aneamia virus (ISAV) isolates induce distinct gene expression responses in the Atlantic salmon(Salmo salar) macrophage/dendritic-like cell line TO, assessed using genomic techniques. Molecular Immunology. 2009;46:2955–2974. doi: 10.1016/j.molimm.2009.06.015. [DOI] [PubMed] [Google Scholar]
- Yang JH, Rhim JS. 2,3,7,8-Tetrachlorodibenzo-p-dioxin: molecular mechanism of carcinogenesis and its implication in human in vitro model. Crit Rev Oncol Hematol. 1995;18:111–127. doi: 10.1016/1040-8428(94)00125-d. [DOI] [PubMed] [Google Scholar]
Associated Data
This section collects any data citations, data availability statements, or supplementary materials included in this article.