Abstract
Morpho-functional patterns are important drivers of phenotypic diversity given their importance in a fitness-related context. Although modularity of the mandible and skull has been studied extensively in mammals, few studies have explored shape co-variation between these two structures. Despite being developmentally independent, the skull and mandible form a functionally integrated unit. In the present paper we use 3D surface geometric morphometric methods allowing us to explore the form of both skull and mandible in its 3D complexity using the greater white-toothed shrew as a model. This approach allows an accurate 3D description of zones devoid of anatomical landmarks that are functionally important. Two-block partial least-squares approaches were used to describe the co-variation of form between skull and mandible. Moreover, a 3D biomechanical model was used to explore the functional consequences of the observed patterns of co-variation. Our results show the efficiency of the method in investigations of complex morpho-functional patterns. Indeed, the description of shape co-variation between the skull and the mandible highlighted the location and the intensity of their functional relationships through the jaw adductor muscles linking these two structures. Our results also demonstrated that shape co-variation in form between the skull and mandible has direct functional consequences on the recruitment of muscles during biting.
Keywords: biting, geometric morphometrics, muscle, shrews, surface shape
Introduction
Functional morphology plays a central role in evolutionary biology as performances issued from morpho-functional patterns have direct consequences on fitness (Arnold, 1983; Breuker et al. 2006). Indeed, form-function relationships are under natural selection and highlight the evolutionary processes driving variation in fitness. Yet, the integrated nature of many functional systems makes them resistant to change as selection on one component of the system will have consequences (positive or negative) on the other components that are part of the same system (Wake & Roth, 1989). Modularity has been proposed to be an important means to reconcile the demands of natural selection on locally optimal phenotypes with modularity breaking part of the integration often observed at higher organisational levels (Wagner et al. 2007; Young & Badyaev, 2007, 2010). Modularity is defined by anatomical areas whose morphological traits co-vary more themselves than with those from other areas. Here, we focus on the functional integration between a set of traits serving a common function.
Few studies have explored the co-variation between skull and mandible (Hautier et al. 2012), despite the fact that these structures form a single functional unit (Dötsch, 1994; Schwenk, 2000) albeit having distinct developmental origins. Given that coordinated jaw movements are important in a wide variety of ecologically pertinent behaviours (Schwenk, 2000), selection likely operates on the co-variance between both structures rather than on each structure in isolation. Consequently, shape variation of the mandible should be translated into complementary shape variation at the level of the skull for those zones involved in biting and mastication. Here, we aim to describe shape co-variation in the skull and mandible using 3D surface geometric morphometric tools using a small insectivorous mammal (Crocidura russula) as a model system. Shrews are an interesting mode because their skull structure is complex due to the loss of the zygomatic arch and the associated muscular rearrangement (Gasc, 1963). Moreover, the form of the condylar process with its double articulation and the non-fused hemi-mandibles allow significant lateral movement during chewing (Dötsch, 1985, 1994). In addition, the mandibles of shrews have a delayed ossification, which allows an extensive reshaping of the bone after birth (Young & Badyaev, 2010). These anatomical features highlight the complexity of the system and beg the question of whether variation in shape in the skull and mandible is associated with variation in function. As such, shrews offer a good model for functional–morphological studies trying to link variation in shape to variation in function.
Whereas most studies on shrews exploring questions of modularity or shape variation have used 2D approaches (Sarà, 1996; Badyaev et al. 2005; Cornette et al. 2012) typically involving only a limited number of landmarks, we here use explicit 3D surface geometric morphometric methods to quantify shape variation. Given the complexity of the skull and mandible and the 3D nature of the structures and associated movements, 2D approaches can only provide a partial description of the existing variation in shape and function. The lack of shape descriptors when using traditional anatomical landmarks is particularly noticeable for the coronoid or angular processes that are typically described by two or a single 2D landmark (Sarà, 1996; Badyaev et al. 2005; Cornette et al. 2012). Yet, these processes most likely show the strongest co-variation between skull and mandible as they are the insertion sites for the adductor muscles physically linking these two structures.
This study aims to explore the functional consequences of shape co-variation in the skull and mandible of continental and insular shrews known to differ in shape (Cornette et al. 2012). To do so we couple 3D surface geometric morphometrics and two-block partial least-squares approach (PLS; Rohlf & Corti, 2000) exploring the co-variation in form between the mandible and the upper part of the skull with 3D biomechanical models to evaluate the functional consequences of the observed co-variation in skull and mandibular shape.
Materials and methods
The greater white-toothed shrew (Fig. 1a), Crocidura russula, is a common shrew occurring in most of Western Europe, the Maghreb and many Atlantic and Mediterranean islands (Wilson & Reeder, 2005). This species is a generalist predator consuming a wide variety of invertebrate prey differing dramatically in size (Churchfield, 1990; Fig. 1b). Twelve specimens of Crocidura russula from five different populations were selected for this study and extracted from Barn Owl (Tyto alba) pellets. These populations were chosen as they represent a wide variety of cranial morphologies and range from continental to insular ecosystems (Cornette et al. 2012). The continental individuals came from Clermont-Ferrand (n = 3); the insular ones from Tomé (n = 4), Groix (n = 1) and Molène (n = 3). The 12th and last individual came from Sardinia and belongs to a closely related species, Crocidura ichnusae. All specimens were μCT-scanned at a resolution of 20 μm, using a GE Locus μCT (voxel size of 0.02005) and segmented using Avizo (VSG, Burlington, MA, USA).
Fig. 1.
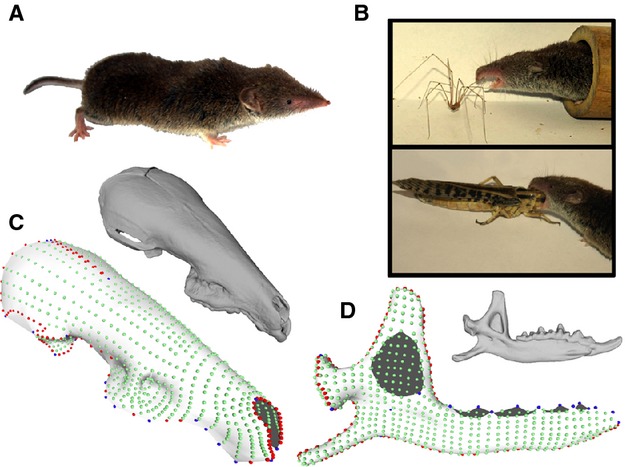
Materials and method. (a) Crocidura russula. (b) Crocidura russula eating two invertebrates differing in size and implying two different gape angles for biting. (c) μCT-scanned skull and template created for the skull. Anatomical landmarks are indicated in blue, sliding-landmarks on 3D curves in red, and sliding-landmarks on 3D surfaces in green. (d) μCT-scanned mandible and template created for the mandible using the same colour code.
Geometric morphometrics
The use of 3D geometric morphometrics using sliding-landmarks presents two distinct advantages. First, it allows the description of the shape of biological objects possessing few or no anatomical landmarks. Second, it allows the use of a high density of landmarks covering a surface, thus providing a precise and quantitative description of the form of an object (Gunz et al. 2005; Mitteroecker & Gunz, 2009). These characteristics of the method make it particularly well adapted for functional approaches that need high-quality and accurate descriptors of anatomical shape to quantify complex structures of biomechanical relevance.
Two different templates were constructed to describe shape variation in the skull and mandible (Fig. 1c,d). The skull template was constructed geometrically using polygonal modelling software (Souter et al. 2010), and is composed of 996 3D landmarks, 39 anatomical landmarks, 157 3D sliding-landmarks on curves and 800 3D sliding-landmarks on the surface of the skull. The hemi-mandible template was constructed differently due to its asymmetry, and consequently 982 3D landmarks were placed directly on a μCT-scan of the left hemi-mandible. This second template is composed of 982 landmarks, 20 anatomical landmarks, 125 3D sliding-landmarks on curves and 837 3D sliding-landmarks on the surface. The description of anatomical landmarks and curves is listed in Table 1.
Table 1.
Location and definitions of anatomical landmarks and curves used for the cranial and mandibular templates
| (A) Skull |
| Anatomical landmarks |
| 1. Junction of the nasal bones |
| 2. Internal junction of the pre-maxillary bone and the incisor (right) |
| 3. External junction of the pre-maxillary bone and the incisor (right) |
| 4. External junction of the pre-maxillary bone and pre-molars 1 and 2 (right) |
| 5. External junction of the pre-maxillary bone and pre-molars 2 and 3 (right) |
| 6. External junction of the pre-maxillary bone and pre-molars 3 and 4 (right) |
| 7. External junction of the maxillary bone, pre-molar 4 and molar 1 (right) |
| 8. Largest width of the maxillary (right) |
| 9. External junction of the maxillary bone, molar 1 and molar 2 (right) |
| 10. External junction of the maxillary bone, molar 2 and molar 3 (right) |
| 11. External junction of the maxillary bone and molar 3 (right) |
| 12. External junction of the maxillary and sphenoid bones (right) |
| 13. Middle of the palate |
| 14. Upper internal point of the glenoid fossa (right) |
| 15. Lower internal point of the glenoid fossa (right) |
| 16. Lower external point of the glenoid fossa (right) |
| 17. Upper external point of the glenoid fossa (right) |
| 18. Lowest point of the parietal bone (right) |
| 19. Junction of the parietal and occipital bones (right) |
| 20. Junction of the parietal and occipital bones (left) |
| 21. Junction of the parietal and occipital bones (left) |
| 22. Lowest point of the parietal bone (left) |
| 23. Upper external point of the glenoid fossa (left) |
| 24. Lower external point of the glenoid fossa (left) |
| 25. Lower internal point of the glenoid fossa (left) |
| 26. Upper internal point of the glenoid fossa (left) |
| 27. External junction of the maxillary and sphenoid bones (left) |
| 28. External junction of the maxillary bone and molar 3 (left) |
| 29. External junction of the maxillary bone, molar 2 and molar 3 (left) |
| 30. External junction of the maxillary bone, molar 1 and molar 2 (left) |
| 31. Largest width of the maxillary (left) |
| 32. External junction of the maxillary bone, pre-molar 4 and molar 1 (left) |
| 33. External junction of the pre-maxillary bone and pre-molars 3 and 4 (left) |
| 34. External junction of the pre-maxillary bone and pre-molars 2 and 3 (left) |
| 35. External junction of the pre-maxillary bone and pre-molars 1 and 2 (left) |
| 36. External junction of the pre-maxillary bone and incisor (left) |
| 37. Internal junction of the pre-maxillary bone and incisor (left) |
| 38. Middle of the pre-maxillary bone |
| 39. Lower middle of the occipital bone |
| Curves |
| Curve 1: from the junction of nasal bones to this same point following the outermost contour of the rostrum posteriorly demarcated by the end of the molar row |
| Curve 2: from the right upper part of the infra-orbital foramen along the right parietal posteriorly following the posterior edge of the parietal to the front, passing to the left parietal along the midline and following the mirror image along the left side to the left upper part of the infra-orbital foramen |
| Curves 3 and 4: the right and left outlines of the glenoid fossa |
| (B) Left hemi-mandible: |
| Anatomical landmarks |
| 1. Posterior middle of molar 3 at its junction with the mandible |
| 2. Junction of molar 3, molar 2 and the mandible (internal) |
| 3. Junction of molar 2, molar 1 and the mandible (internal) |
| 4. Junction of molar 1, pre-molar 2 and the mandible (internal) |
| 5. Junction of pre-molar 2, pre-molar 1 and the mandible (internal) |
| 6. Junction of pre-molar 1, the incisor and the mandible (internal) |
| 7. Anterior junction of the incisor with the mandible (internal) |
| 8. Anterior junction of the incisor with the mandible (external) |
| 9. Junction of molar 3, molar 2 and the mandible (external) |
| 10. Junction of molar 2, molar 1 and the mandible (external) |
| 11. Junction of molar 1, pre-molar 2 and the mandible (external) |
| 12. Junction of pre-molar 2, pre-molar 1 and the mandible (external) |
| 13. Distalmost point of the angular process |
| 14. Maximum inflexion point in between the body of the mandible and the angular process |
| 15–17. Each angle of the triangle formed by the articular condyle |
| 18. Extremity of the tubercule on the external dorsalmost aspect of the coronoid |
| 19. Posterior part of the mandibular foramen |
| 20. Anterior angle of the temporal fossa |
| Curves |
| Curve 1: from the extremity of the mandible in contact with incisor to the articular condyle |
| Curve 2: the outline of the articular condyle |
| Curve 3: from the posteriormost point of the articular condyle to molar 3 along the coronoid process |
All anatomical 3D landmarks and 3D curves were manually registered using Landmark (Wiley et al. 2005). Sliding-landmarks were allowed to slide on 3D curves or surfaces while minimizing the bending energy between the template and the object to measure using thin plate splines implemented in Edgewarp (Bookstein & Green, 2002). Next, warped landmarks were exported to R (R Development Core Team, 2010), and the Rmorph library (Baylac, 2012) was used to perform a general Procrustes analysis (GPA) on the data for both skulls and mandibles (Rohlf & Slice, 1990).
Two-block PLS implemented in the Rmorph library (Baylac, 2012) were used to quantify and visualise shape co-variation between the skull and mandible using pairs of orthogonal vectors of each element (Rohlf & Corti, 2000). Here vectors were calculated on the co-variance matrices of the 3D Procrustes coordinates of the skull and the left hemi-mandible of the same individual. These approaches as well as principal component analyses (PCAs) are insensitive to the number of landmarks used relative to the number of specimens (Gunz & Mitteroecker, 2013), and thus ideally suited in the context of the present study. To visualise shape co-variation between these two functional units, we reconstructed surfaces (Fig. 2) using the ball-pivoting algorithm (Bernardini et al. 1999) implemented in MeshLab (Visual Computing Lab -ISTI-CNR, http://meshlab.source.forge/). These surfaces were reconstructed with both landmark configurations of extreme shapes from PLS axes and the consensus (i.e. average shape). Differences between the extreme shapes and the consensus surface were constructed using surface and vector-based representations in Avizo (VSG).
Fig. 2.
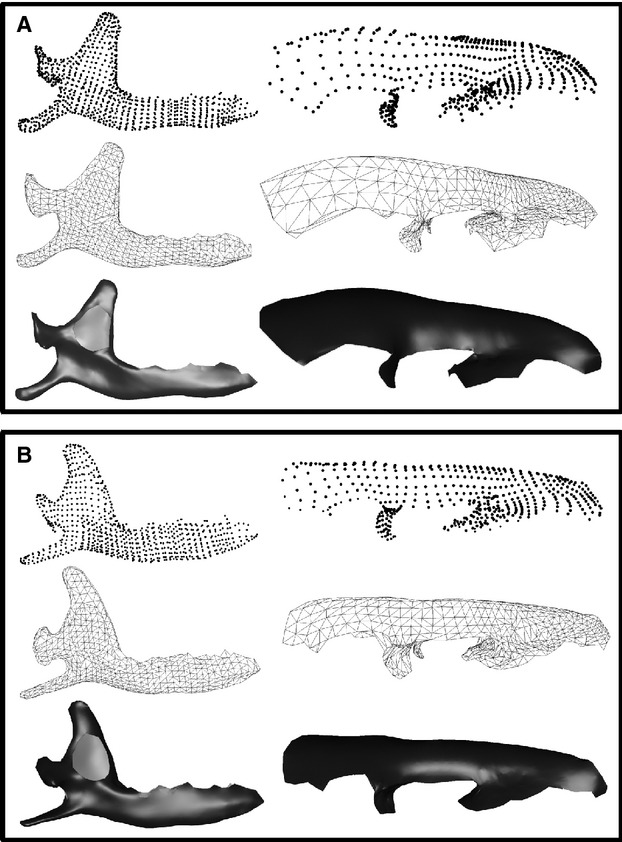
Two extreme shapes of PLS axis. (a) First pattern of shape co-variation between the skull and the mandible corresponding to the positive part of the PLS axis. Three steps have been illustrated, landmarks configurations, triangulation and surface creation. (b) Second pattern of shape co-variation between the skull and the mandible corresponding to the negative part of the PLS axis.
Bite models
To evaluate the functional consequences of the observed shape co-variation in our data set we constructed static bite models (Fig. 3; Herrel et al. 1998, 2008) based on the geometries retrieved from the PLS analyses contrasting the extreme shapes along the first PLS axis (Fig. 2). Input data were based on dissections of a Crocidura russula, and consisted of the 3D coordinates of muscle origins and insertions derived from the different geometries along the first PLS axis, the coordinates of a bite point at the first molar, and muscle cross-sectional areas for all adductor muscles directly derived from the dissection. Cross-sectional areas were based on muscle mass and fibre lengths measured through nitric acid digestion (Loeb & Gans, 1986), and assumed a muscle density of 1.06 g cm−3 (Mendez & Keys, 1960). Size variation was eliminated from the analyses and input forces were identical for each shape such that output data in terms of the magnitude of the bite and joint forces and the orientation of the joint reaction forces are dependent on shape variation only. Finally, models were run at two different gape angles (20 º and 60 °) to explore effects of shape co-variation on the ability of animals to bite at different gape angles (Fig. 1b).
Fig. 3.
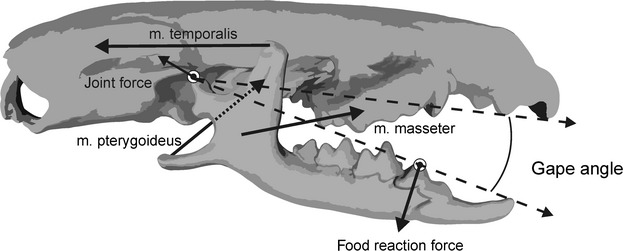
Static bite model. Figure illustrating the static bite model used to calculate bite and joint forces. The model incorporates the 3D vectors and cross-sectional areas of the jaw muscles (m. temporalis, m. masseter, m. pterygoideus) to calculate the food reaction forces at a given gape angle and bite point. Based on the calculated food reaction forces the bone-on-bone joint forces in the jaw articulation and their orientation are calculated as well.
In order to integrate the functional and morphometric data, a PCA was performed on output of the bite models including the fractional participation to biting of the m. temporalis, the m. masseter, the m. temporalis pars suprazygomatica, the m. pterygoideus, bite forces at the first molar, and the joint reaction forces at jaw opening angles of 20 º and 60 °.
Results
PLS
The first PLS axis (52% of total shape co-variation) shows that the most important regions of shape co-variation are situated in the coronoid and angular processes, the ascending branch of the mandible and the parietal bones of the skull (Figs 7). Others zones like the articular condyle, the glenoid fossae, as well as the pre-maxillary or molar and incisor regions also co-vary markedly. On the negative part of the PLS axis (Figs 5 and 7), a slender and backward oriented coronoid process is associated with a small and flattened brain case and a proportionally longer rostrum. At the opposite end of this PLS axis are situated mandibles with a robust and square coronoid process, and a large and rounded brain case (Figs 4 and 6). The angular process is also more robust and the angle of the mandibular notch for specimens falling on the positive side of this axis.
Fig. 7.
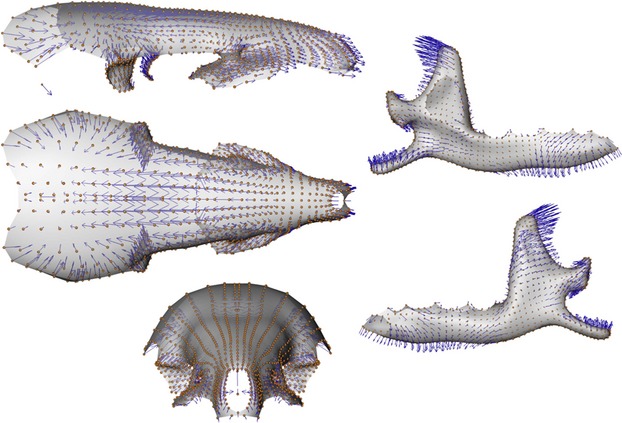
Anatomical description of shape co-variation. Surface consensus with vectors (blue arrows) of shape co-variation between the skull and the mandible corresponding to the negative part of the PLS axis.
Fig. 5.
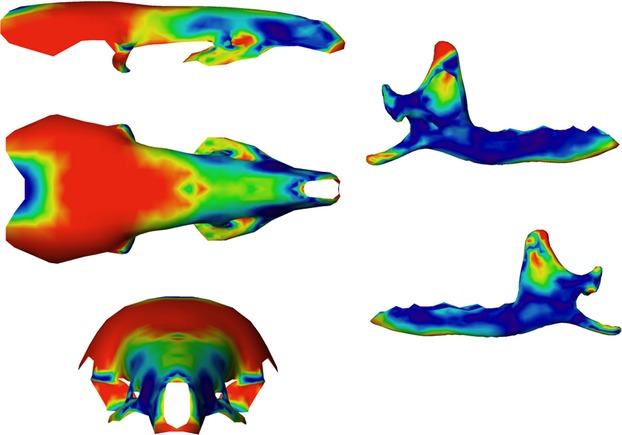
Anatomical location and intensity of shape co-variation. Coloured consensus surface using the intensity of vectors of shape co-variation concerning the shape co-variation between the skull and the mandible corresponding to the negative part of the PLS axis. In red, anatomical regions with the highest shape co-variation, in dark blue anatomical regions with the lowest shape co-variation.
Fig. 4.
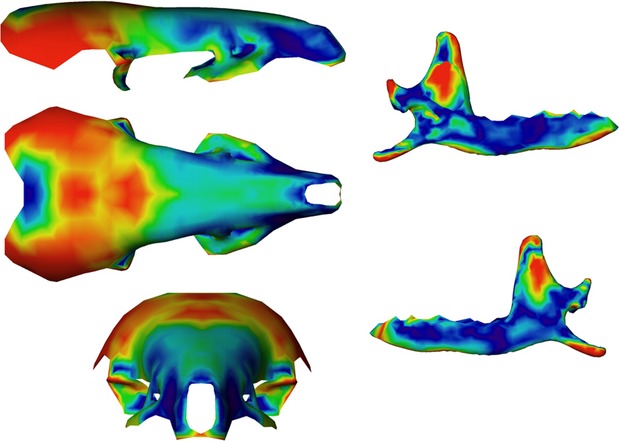
Anatomical location and intensity of shape co-variation. Coloured consensus surface using the intensity of vectors of shape co-variation concerning the shape co-variation between the skull and the mandible corresponding to the positive part of the PLS axis. In red, anatomical regions with the highest shape co-variation, in dark blue anatomical regions with the lowest shape co-variation.
Fig. 6.
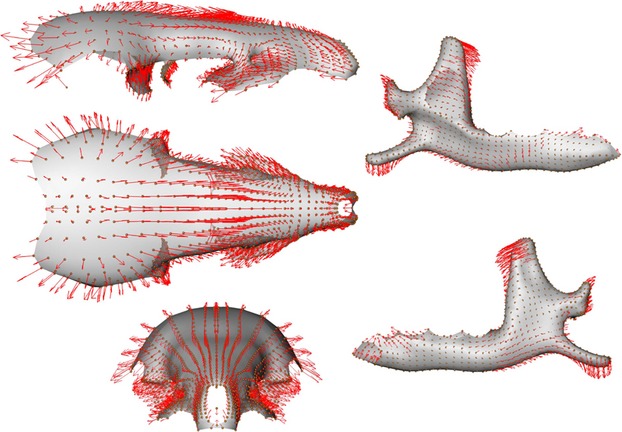
Anatomical description of shape co-variation. Surface consensus with vectors (red arrows) of shape co-variation between the skull and the mandible corresponding to the positive part of the PLS axis.
Functional consequences
To explore the functional consequences of shape co-variation we ran mechanical models (Herrel et al. 2008). The output of the models was summarised using a PCA (Fig. 8; Table 2). The two-first axes of the PCA explain 99% of the total variance. The first axis (91%) is mainly determined by variation in joint force, bite force and the relative participation of the m. temporalis, the m. pterygoideus and the m. masseter in the total bite force. The second axis (8%) is mainly explained by variation in the participation of the pars suprazygomatica of the temporalis muscle and the fractional participation of the m. masseter in the overall bite force.
Fig. 8.
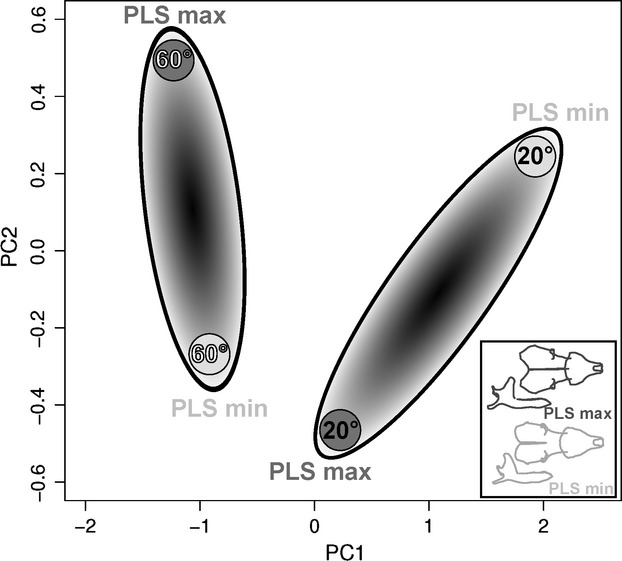
PCA performed on six functional variables. Functional variables were calculated for two different gape angles 20 º and 60 °, black and white characters, respectively. The functional data are calculated using the shapes representing the extremes of the first PLS axes, grey ovals. A graphic representation of the co-variation in shape between skull and mandible has been shown (bottom right) illustrating the consequences of variation in shape on variation in function. In dark grey, the positive part of the PLS axis, in pale grey the negative one.
Table 2.
Loadings of the six functional variables on the two-first PCA axes
| Fractional participation of the m. temporalis | Fractional participation of the m. masseter | Fractional participation of the m. temporalis pars suprazygomatica | Fractional participation of the m. pterygoideus | Bite force | Joint force | |
|---|---|---|---|---|---|---|
| Axis 1 (91%) | −0.94 | 0.74 | 0.27 | 0.91 | −0.93 | −0.96 |
| Axis 2 (8%) | 0.24 | −0.65 | 0.95 | −0.08 | 0.34 | −0.25 |
The PCA distinguishes biting at different gape angles, with bites at a low gape angle being situated towards the positive side of PC1 and bites at a high gape angle situated along the negative side of this axis (Fig. 8). This indicates that bites at a low gape angle are associated with relatively low joint and bite forces, a low contribution of the m. temporalis, and a high contribution of the m. pterygoideus and the m. masseter to bite force. The second axis separates biting at high gape for the shape associated with the positive side of the PLS axis and biting at low gape for shapes situated towards the negative side of the first PLS from biting at low gape of shapes along the positive side of the first PLS axis and biting at high gape for shapes along the negative side of the first PLS axis. Thus, whereas extreme shapes on the positive side of the first PLS are characterised by a low participation of the m. temporalis pars suprazygomatica and high participation of the m. masseter to bite force at low gape, the extreme shapes of the skull and mandible on the negative side of the first PLS are characterised by a greater participation of the m. temporalis pars suprazygomatica, yet a low participation of the m. masseter at low gape (Fig. 8).
Discussion
Methodological advantages
Our approach mixing a 3D accurate shape description combined with a 3D biomechanical model permitted a better understanding of the complexity of the masticatory apparatus of the greater white-toothed shrew. The use of 3D sliding-landmarks on surfaces allowed us to use a large number of landmarks situated in anatomical regions devoid of anatomical landmarks but possessing essential functional information. The reconstruction of surfaces along the extremes of the PLS axis and their use as input for a biomechanical model was only possible because of the high density of 3D landmarks. In addition, this approach is defined within a theoretical framework particularly well adapted for functional–morphological studies due to the use of bending energy as our criterion to obtain spatial homology of our sliding-landmarks on surfaces.
These results should be interpreted with some caution relative to the evolutionary or ecological context of the species given the small number of specimens used. However, the approaches used here (e.g. PLS) are insensitive to the large number of landmarks used relative to the number of specimens (Gunz & Mitteroecker, 2013), and as such the results linking shape variation to function are robust. Although the method is powerful in its ability to describe shape variation, it remains relatively time consuming. Nevertheless, we believe that this analytical framework is promising for future studies aimed at linking variation in shape with variation in function.
Shape co-variation
The surface geometric morphometric analysis allowed us to precisely quantify the extent and nature of the variable regions in the skull and mandible. For the mandible, the coronoid process, which serves as the attachment site of the temporalis muscle, is the most variable. The angular process and the articular condyle also vary significantly, which may be related to the development of the masseter muscle and the complex masticatory movements in shrews involving independent movements of both hemi-mandibles (Gasc, 1963; Badyaev & Foresman, 2004). The alveolar part of the pre-molars is also characterised by a marked variation in our sample. The alveolar region of the molars, in contrast, appears quite constrained and shows less variation. The different functional roles of these teeth may be explained by the different constraints on their form in relation to diet, as has been demonstrated previously for bats (Freeman, 1998) and carnivores (Van Valkenburgh, 2007). For the skull, the braincase appears to be the most variable zone with its shape varying from flat to globular. As observed for the mandible, the most variable zone of the braincase concerns the attachment site of the temporalis muscle. The shapes of the two dental alveolar regions change independently, varying in width, length and thickness. These changes are potentially also driven by functional constraints associated with diet. Across our sample, variation in cranial shape was associated with variation in mandibular shape. Zones co-varying most were restricted largely to muscle insertion areas suggesting a functional origin of this shape co-variation. This result is intuitively appealing given that the muscles form the direct link between these two elements with independent developmental origins.
Functional consequences of shape co-variation
The patterns of shape co-variation representing the two extremes along the first PLS had clear functional consequences. Moreover, these different patterns of shape co-variation had distinct functional implications when simulating biting at different gape angles. The first PC axis summarising our model output clearly represents effects of gape on jaw function independent of shape co-variation. As expected, biting at low gape was associated with lower bite force, yet also lower joint forces. Moreover, the participation of the masseter and pterygoideus muscles to the overall bite force was greater at low gape. The second PC, however, showed clear different functional consequences of the shape co-variation observed in our sample with the pars suprazygomatica of the m. temporalis being proportionally more involved in bite force generation at low gape for shapes associated with the negative side of the first PLS. This suggests that the selective forces operating on the shape and function of the feeding system in shrews living in ecologically distinct conditions (i.e. islands of different size and distance to the mainland) may be different. Yet this needs to be explored further using a larger sample incorporating a wider range of specimens from different populations.
Conclusions
In summary, the co-variation between the skull and mandible in Crocidura russula is dominated by the variation in attachment sites of the temporalis muscle, which has a clear and significant effect on the mechanics of biting. Interestingly, the observed shape co-variation has striking functional consequences at the level of the participation of cranial muscles to bite force as highlighted by our 3D approaches. Future studies including larger numbers of specimens describing shape co-variation would be needed to test the generality of our results. Finally, ecological data are needed to place the observed patterns in an evolutionary context as they allow a better understanding of the selective pressures operating on the feeding system in different populations.
Acknowledgments
This work was supported by ATM-MNHN ‘Formes possibles, formes réalisées’, by ATM-MNHN ‘Biodiversité actuelle et fossile’ and GDR-CNRS 2474 ‘Morphométrie et Evolution des Formes’. We thank Julio Pedraza and Patricia Wils from UMS-CNRS 2700 for their computer help. We also thank Dominique Adriaens for his meaningful suggestions, and Céline Houssin, Sibyle Moulin and Anne-Claire Fabre for their help during the different steps of this work. We thank Michel Pascal for donating the specimens from Tomé and Clermont-Ferrand used in this study, and we would like to pay a tribute to this great scientist endowed with exceptional human qualities and dedicate this article to his memory.
References
- Arnold SJ. Morphology, performance and fitness. Am Zool. 1983;23:347–361. [Google Scholar]
- Badyaev AV, Foresman KR. Evolution of morphological integration. I. Functional units channel stress-induced variation in shrew mandibles. Am Nat. 2004;163:868–879. doi: 10.1086/386551. [DOI] [PubMed] [Google Scholar]
- Badyaev AV, Foresman KR, Young RL. Evolution of morphological integration: developmental accommodation of stress-induced variation. Am Nat. 2005;166:382–395. doi: 10.1086/432559. [DOI] [PubMed] [Google Scholar]
- Baylac M. 2012. Rmorph: a R geometric and multivariate morphometrics library. Available from the author: baylac@mnhn.fr.
- Bernardini F, Mittleman J, Rushmeier H, et al. The ball-pivoting algorithm for surface reconstruction. IEEE Trans Visual Comput Graphics. 1999;5:349–359. [Google Scholar]
- Bookstein FL, Green WDK. 2002. Users Manual, EWSH3.19. http://brainmap.stat.washington.edu/edgewarp/
- Breuker CJ, Debat V, Klingenberg CP. Functional evo-devo. Trends Ecol Evol. 2006;21:488–492. doi: 10.1016/j.tree.2006.06.003. [DOI] [PubMed] [Google Scholar]
- Churchfield S. The Natural History of Shrews. Ithaca, NY: Comstock Publishing; 1990. p. 178. [Google Scholar]
- Cornette R, Herrel A, Cosson JF, et al. Rapid morpho-functional changes among insular populations of the greater white-toothed shrew. Biol J Linn Soc Lond. 2012;107:322–331. [Google Scholar]
- Dötsch C. Masticatory function in shrews (Soricidae) Acta Zool Fennica. 1985;173:231–235. [Google Scholar]
- Dötsch C. Function of the feeding apparatus in red-toothed and white-toothed shrews (Soricidae) using electromyography and cineradiography. In: Merritt JF, Kirkland GL Jr, Rose RK, editors. Advances in the Biology of Shrews. Pittsburgh: Carnegie Museum of Natural History; 1994. pp. 233–239. [Google Scholar]
- Freeman PW. Form, function, and evolution in skulls and teeth of bats. In: Kunz TH, editor. Bat Biology and Conservation. Washington, DC: Smithsonian Institution Press; 1998. pp. 140–156. [Google Scholar]
- Gasc JP. La musculature céphalique chez Suncus Ehr., Crocidura Wag., Sylvisorex Thom., Myosorex Gr. (Insectivores) Mammalia. 1963;27:582–601. [Google Scholar]
- Gunz P, Mitteroecker P. Semilandmarks: a method for quantifying curves and surfaces. Hystrix. 2013;24:103–109. [Google Scholar]
- Gunz P, Mitteroecker P, Bookstein FL. Semi-landmarks in three dimensions. In: Slice D, editor. Modern Morphometrics in Physical Anthropology. New York: Kluwer Academic; 2005. p. 383. [Google Scholar]
- Hautier L, Lebrun R, Cox PG. Patterns of covariation in the masticatory apparatus of Hystricognathous rodents: implications for evolution and diversification. J Morphol. 2012;273:1319–1337. doi: 10.1002/jmor.20061. [DOI] [PubMed] [Google Scholar]
- Herrel A, Aerts P, De Vree F. Static biting in lizards: functional morphology of the temporal ligaments. J Zool (Lond) 1998;244:135–143. [Google Scholar]
- Herrel A, De Smet A, Aguirre LF, et al. Morphological and mechanical determinants of bite force in bats: do muscles matter? J Exp Biol. 2008;211:86–91. doi: 10.1242/jeb.012211. [DOI] [PubMed] [Google Scholar]
- Loeb GE, Gans C. Electromyography for Experimentalists. Chicago, IL: The University of Chicago Press; 1986. p. 373. [Google Scholar]
- Mendez J, Keys A. Density and composition of mammalian muscle. Metabolism. 1960;9:184–188. [Google Scholar]
- Mitteroecker P, Gunz P. Advances in geometric morphometrics. Evol Bio. 2009;36:235–247. [Google Scholar]
- R Development Core Team. 2010. R: A Language and Environment for Statistical Computing. R Foundation for Statistical Computing, Vienna, Austria. ISBN 3-900051-07-0, URL http://www.R-project.org.
- Rohlf FJ, Corti M. Use of two-block partial least-squares to study covariation in shape. Syst Biol. 2000;49:740–753. doi: 10.1080/106351500750049806. [DOI] [PubMed] [Google Scholar]
- Rohlf FJ, Slice DE. Extensions of the Procrustes method for the optimal superimposition of landmarks. Syst Biol. 1990;39:40–59. [Google Scholar]
- Sarà M. A landmark-based morphometrics approach to the systematics of Crocidurinae: case study on endemic shrews Crocidura sicula and C. canariensis (Soricidae, Mammalia) In: Marcus LF, Corti M, Loy A, Naylor GJP, Slice DE, editors. Advances in Morphometrics NATO Science Series A: Life Sciences 284. Hamburg: Springer; 1996. pp. 335–344. [Google Scholar]
- Schwenk K. In: Feeding. Form, Function, and Evolution in Tetrapod Vertebrates. Schwenk K, editor. San Diego, CA: Academic Press; 2000. p. 537. [Google Scholar]
- Souter T, Cornette R, Pedraza J, et al. Two applications of 3D semi-landmark morphometrics implying different template designs: the theropod pelvis and the shrew skull. C R Palevol. 2010;9:411–422. [Google Scholar]
- Van Valkenburgh B. Déjà vu: the evolution of feeding morphologies in the Carnivora. Integr Comp Biol. 2007;47:147–163. doi: 10.1093/icb/icm016. [DOI] [PubMed] [Google Scholar]
- Wagner GP, Pavlicev M, Cheverud JM. The road to modularity. Nat Rev Genet. 2007;8:921–930. doi: 10.1038/nrg2267. [DOI] [PubMed] [Google Scholar]
- Wake DB, Roth G. Complex Organismal Functions: integration and Evolution in Vertebrates. Hoboken: John Wiley; 1989. p. 466. [Google Scholar]
- Wiley DF, Amenta N, Alcantara DA, et al. Proceedings of IEEE Visualization. Minneapolis, MN: IEE Computer Society; 2005. Evolutionary morphing; pp. 431–438. 2005 (VIS'05), 23–28 October 2005. [Google Scholar]
- Wilson D, Reeder D. Mammal Species of the World: A Taxonomic and Geographic Reference. Baltimore: Johns Hopkins University Press; 2005. p. 2000. [Google Scholar]
- Young RL, Badyaev AV. Evolution of ontogeny: linking epigenetic remodeling and genetic adaptation in skeletal structures. Integr Comp Biol. 2007;47:234–244. doi: 10.1093/icb/icm025. [DOI] [PubMed] [Google Scholar]
- Young RL, Badyaev AV. Developmental plasticity links local adaptation and evolutionary diversification in foraging morphology. J Exp Zool B Mol Dev Evol. 2010;314B:434–444. doi: 10.1002/jez.b.21349. [DOI] [PubMed] [Google Scholar]


