

Abstract
Previous studies of upper first molar (M1) crown shape have shown significant differences between Homo sapiens and Homo neanderthalensis that were already present in the European Middle Pleistocene populations, including the large dental sample from Atapuerca-Sima de los Huesos (SH). Analysis of other M1 features such as the total crown base area, cusp proportions, cusp angles and occlusal polygon have confirmed the differences between both lineages, becoming a useful tool for the taxonomic assignment of isolated teeth from Late Pleistocene sites. However, until now the pattern of expression of these variables has not been known for the SH sample. This fossil sample, the largest collection from the European Middle Pleistocene, is generally interpreted as being from the direct ancestors of Neanderthals, and thus is a reference sample for assessing the origin of the Neanderthal morphologies. Surprisingly, our study reveals that SH M1s present a unique mosaic of H. neanderthalensis and H. sapiens features. Regarding the cusp angles and the relative occlusal polygon area, SH matches the H. neanderthalensis pattern. However, regarding the total crown base area and relative cusps size, SH M1s are similar to H. sapiens, with a small crown area, a strong hypocone reduction and a protocone enlargement, although the protocone expansion in SH is significantly larger than in any other group studied. The SH dental sample calls into question the uniqueness of some so-called modern traits. Our study also sounds a note of caution on the use of M1 occlusal morphology for the alpha taxonomy of isolated M1s.
Keywords: Atapuerca, cusp angle, cusp area, dental reduction, metrics, occusal polygon area, Sima de los Huesos, teeth
Introduction
Previous analyses on the shape and metric features of M1s in the genus Homo have revealed significant differences between Homo sapiens and Homo neanderthalensis lineages (Bailey, 2002a, 2004; Bermúdez de Castro et al. 2007; Gómez-Robles et al. 2007, 2011a; Quam et al. 2009). Since M1 is considered to be the least variable and most diagnostic of the upper molars (Dahlberg, 1945; Bailey, 2002b; Hlusko et al. 2004), its anatomical details are expected to reflect the underlying genetic signal more strongly and thus it potentially provides evolutionary information. This circumstance is of particular utility for the taxonomic identification of isolated teeth (e.g. Smith, 1976; Morris, 1986; Wood et al. 1988; Klein, 1999; Tattersall, 1999; Bailey, 2002a, 2004; Harvati et al. 2003). Typical Neanderthal M1s have been described as strongly skewed rhomboids with bulging and protruding hypocones (Bailey, 2004). This morphotype has been also identified in the European Early and Middle Pleistocene populations (Bailey, 2004; Quam et al. 2009), including the large European Middle Pleistocene sample from Atapuerca-Sima de los Huesos (SH) (Gómez-Robles et al. 2007, 2011a), confirming the early appearance of some so-called Neanderthal features in Europe (Gómez-Robles et al. 2007, 2011a; Martinón-Torres et al. 2007, 2012). In addition, the pattern of expression of other typical Neanderthal M1 features such as the relative cusp proportions (e.g. a small metacone and large hypocone) or the small size of the relative occlusal polygon has been also identified in the small Homo heidelbergensis sample analyzed by Bailey (2004) and Quam et al. (2009). However, to date, the pattern of expression of these features was unknown for the SH collection. The SH sample is currently the largest hominin collection worldwide for the Middle Pleistocene and provides an exceptional opportunity to study intra-population variability (e.g. Arsuaga et al. 1997a; Lorenzo et al. 1998; Bermúdez de Castro et al. 2004; Gómez-Olivencia et al. 2007; Gómez-Robles et al. 2008, 2009, 2011b,c; Prado-Simón et al. 2012). This hominin population has been assigned to H. heidelbergensis, assuming the latter to be a chronospecies of the European Neanderthal lineage (Arsuaga et al. 1991, 1993, 1997b). However, the precise relationship of the SH hominins with the Neanderthal lineage is still under debate (e.g. Stringer, 1993; Tattersall & Schwartz, 2006, 2009; Hublin, 2009). On dental grounds, the SH hominins present all of the morphological traits that are usually considered typical of H. neanderthalensis (Bermúdez de Castro, 1988, 1993; Martinón-Torres et al. 2012), although in some features they appear even more derived than classic Neanderthals (Bermúdez de Castro & Nicolás, 1995, 1996; Gómez-Robles et al. 2007, 2008, 2011a,b, 2012; Prado-Simón et al. 2012; Martinón-Torres et al. 2013). In this context, it could be expected that SH M1s would also coincide with H. neanderthalensis in their pattern of cusp proportions, cusp angles, occlusal polygon and crown size. In this study, we aim to contribute to the understanding of the evolution of M1 morphology by studying these features in the SH M1 sample.
Materials and methods
Teeth with a wear degree higher than category 3 (Molnar, 1971) were excluded from the SH M1 sample (n = 29; Martinón-Torres et al. 2012), resulting in a sample of 16 M1s. When antimeres were present, the data from the right side were used, resulting in a minimum number of 12 individuals (AT-20, AT-26, AT-139, AT-196, AT-587, AT-812, AT-959, AT-2076, AT-3177, AT-3178, AT-4317, AT-5899). The SH results were compared with data from other Homo fossil and modern human samples obtained from the published literature. Tables 1 and 2 list the specimens and source of the M1 comparative sample. The H. heidelbergensis sample does not include the SH specimens, which are analyzed and compared separately. Measurements were taken by one of us (P.S.). For that purpose we employed standardized images of the occlusal surface of the molars. Photographs were taken with a Nikon D1H digital camera fitted with an AF Micro-Nikkor 105 mm, f/2.8D attached to a Kaiser Copy Stand kit RS-1 with grid baseboard, column, and adjustable camera arm. For maximum depth of field, we used an aperture of f/32, and the magnification ratio was adjusted to 1 : 1. A scale was placed parallel to and at the same distance from the lens as the occlusal plane. Images were measured with fiji image analysis software (Schindlein et al. 2012). Each picture was calibrated three times and, following Bailey (2004), we used the average of these calibrations as the final calibration, and set a scale bar in the picture.
Table 1.
Comparative sample for the absolute and relative TCBA and cusp areas
| Sample | Label | n | Source |
|---|---|---|---|
| Early Homo | EaHOMO | 18 | Wood & Engleman (1988); Wood (1991); Quam et al. (2009) |
| Homo erectus | ERE | 5 | Wood & Engleman (1988); Quam et al. (2009) |
| Homo antecessor | ANT | 5 | Gómez-Robles (2010) |
| Homo heidelbergensis | HEI | 4 | Bailey (2004); Quam et al. (2009) |
| Sima de los Huesos | SH | 12 | This study |
| Homo neanderthalensis | NEA | 21 | Bailey (2004); Arsuaga et al. (2007); Quam et al. (2009) |
| Middle Paleolithic H. sapiens | MP HSAP | 7 | Quam et al. (2009) |
| European Upper Paleolithic H. sapiens | UP HSAP | 15 | Bailey (2004); Arsuaga et al. (2007); Quam et al. (2009) |
| Contemporary Homo sapiens | HSAP | 59 | Bailey (2004); Quam et al. (2009) |
| Pooled fossil later Homo1 | FLHOMO | 55 | Quam et al. (2009) |
| Pooled later Homo2 | LHOMO | 114 | Quam et al. (2009) |
Includes all late Homo fossils except for Homo sapiens.
Includes all late Homo fossils.
Table 2.
Comparative sample for the cusp angles and occlusal polygon areas
| Sample | Label | Source |
|---|---|---|
| Homo antecessor | ANT | Gómez-Robles (2010) |
| Homo erectus | ERE | Bailey (2004) |
| Homo neanderthalensis | NEA | Bailey et al. (2008) |
| Middle Paleolithic Homo sapiens | MP HSAP | Bailey et al. (2008) |
| Upper Paleolithic Homo sapiens | UP HSAP | Bailey et al. (2008) |
| Contemporary modern human sample | HSAP | Bailey (2004) |
We measured the crown base area, individual cusp base areas, cusp angles and occlusal polygon area. We followed the methodology already employed by other authors in similar studies (Wood & Engleman, 1988; Bailey, 2004; Moggi-Cecchi & Boccone, 2007; Quam et al. 2009; Gómez-Robles et al. 2011a). We first traced the tooth perimeter. Individual cusp base areas were measured by following the primary fissures separating the cusps (Fig. 1). If the fissure was partially obscured, its course was estimated following the direction of the visible part of fissure (Bailey, 2004) and with the help of other dental features as anatomical reference (Biggerstaff, 1969). When necessary, the correction of interproximal wear was made according to Wood & Engleman (1988). When the metaconule or C5 was present, its area was measured and divided evenly between the adjacent main cusps (Quam et al. 2009; Gómez-Robles et al. 2011a). When a crista obliqua was present we followed the recommendations of previous authors and continued the course of the central groove between the protocone and the metacone (Gómez-Robles et al. 2011a). Cusps were considered equal in size if their relative areas did not differ by more than 1.0%. Total crown base area (TCBA) was calculated as the sum of individual cusp areas. Relative areas of each cusp were calculated by dividing the base area of each cusp by the total crown base area.
Fig. 1.
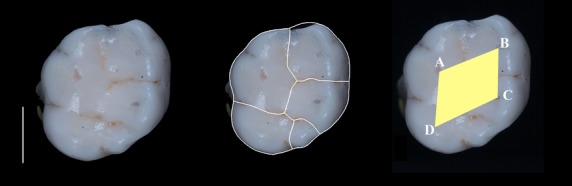
Upper first molar from Sima de los Huesos site (left) showing the separation of the different cusp areas (middle), the occlusal polygon and the cusp angles (right) at the protocone (angle A), paracone (angle B), metacone (angle C) and hypocone (angle D). Mesial: top of the figure; distal: bottom; buccal: right; lingual: left. White bar: 5 mm.
Cusp angles were measured by connecting the cusp apices of major cusps (Bailey, 2004). The position of the cusp apices on the images was estimated by checking their position in the original fossil tooth (Fig. 1). The occlusal polygon area was measured as the area defined by the lines connecting the cusp apices (Bailey, 2004). Relative occlusal polygon area, as an expression of the internal compression of tooth cusps, was calculated by dividing the occlusal polygon area by the total crown base area (Bailey, 2004).
Not all the variables could be scored in all the teeth (e.g. if a cusp is partially broken we cannot calculate the crown base area but we may be still able to measure angles or the occlusal polygon). Each tooth was measured twice and the average was used in the analyses. The differences between the two relative cusp measures were employed to calculate the intraobserver error, which was lower than 1.2% in all cases. For the interobserver error, we recorded the differences between the relative cusp areas of 7 M1s measured by P.S. and J.M.B d C., which was less than 2.2% in all cases. Previous analysis of the M1s morphology demonstrated that the error tied to the location of the cusp tips for the occlusal polygon is very low, with interobserver correlations higher than 0.97 (Gómez-Robles et al. 2007, 2011a). Statistical analyses were computed with past 2.14 (Hammer et al. 2001).
Linear correlations have been calculated by the Pearson coefficient among absolute cusp area values, among relative cusp area values, and between crown base area and each cusp areas. The relationship between crown base area and cusp areas was also analyzed by log-log reduced major axis regression, to consider the allometric patterns. A principal component analysis (PCA) based on correlation coefficients was also computed using the four cusp areas to verify the general contribution of the variables to the whole variation.
To examine the differences among SH and the comparative samples for the cusps and occlusal polygon areas and angles we performed a F-test (to test the equality of the variance) followed by a one-sample t-test from parameters (mean, n and variance) since the individual values of the comparative sample were not available. A two-sample t-test was also employed to determine whether the size difference between relative cusp sizes in SH was significant. Differences were considered significant when P ≤ 0.05.
Results
Intragroup variation
Table 3 provides the mean and the standard deviation (SD) for the TCBA and absolute cusp areas for the M1 samples. The absolute values of the cusp areas are all correlated, with correlation coefficients ranging from 0.61 (protocone vs. hypocone) to 0.90 (metacone vs. paracone; Table 4). On the other hand, correlations between relative values are not significant. Total crown base area is correlated with the absolute cusp areas (with coefficients ranging from 0.80 for hypocone to 0.95 for paracone and metacone), but not with the relative cusp areas (Table 5).
Table 3.
Mean and standard deviation for the absolute and relative total crown base area and cusp areas of M1s. The range of variation is included for the SH sample
| Absolute (mm2) | Relative (%) | ||||||||
|---|---|---|---|---|---|---|---|---|---|
| Sample | TCBA (mm2) | Protocone | Paracone | Metacone | Hypocone | Protocone | Paracone | Metacone | Hypocone |
| SH (12) | 107.7 ± 11.5 (84.1–129.8) | 37.1 ± 4.3 (30.9–46.0) | 26.9 ± 3.1 (20.8–32.0) | 22.4 ± 3.2 (15.8–28.9) | 21.1 ± 2.0 (16.7–24.9) | 34.5 ± 1.6 (32.0–36.7) | 25.0 ± 1.0 (23.6–26.5) | 20.8 ± 1.1 (18.8–22.2) | 19.7 ± 1.2 (17.7–21.3) |
| NEA (21) | 112.3 ± 16.6 | 33.7 ± 6.1 | 28.8 ± 4.2 | 22.9 ± 3.9 | 26.8 ± 5.1 | 29.9 ± 2.4 | 25.8 ± 2.1 | 20.6 ± 1.8 | 23.7 ± 2.1 |
| HEI (4) | 115.5 ± 17 | 34.8 ± 6.8 | 28.3 ± 4.8 | 24.2 ± 4.8 | 28.2 ± 3 | 31.1 ± 3.7 | 24.8 ± 0.9 | 20.1 ± 2.6 | 24 ± 1.6 |
| ANT (5) | 123.8 ± 9 | 37.5 ± 2.6 | 29.4 ± 1.4 | 26.3 ± 2.4 | 30.6 ± 3.1 | 30.3 ± 0.7 | 23.8 ± 0.7 | 21.2 ± 0.7 | 24.7 ± 0.8 |
| ERE (5) | 115.5 ± 6.8 | 34.5 ± 3 | 28.7 ± 2.7 | 26.5 ± 3.2 | 25.8 ± 1.6 | 29.9 ± 2.2 | 24.9 ± 2.3 | 22.9 ± 1.7 | 22.3 ± 0.4 |
| MP HSAP (7) | 111.3 ± 12.7 | 34.7 ± 2 | 27.5 ± 2.4 | 23.7 ± 3.7 | 25.8 ± 7.8 | 31.3 ± 2.3 | 24.8 ± 1.6 | 21.3 ± 2.5 | 22.8 ± 5 |
| UP HSAP (15) | 99.6 ± 10.2 | 31.7 ± 3.6 | 25.2 ± 2.4 | 22.6 ± 3.3 | 20.3 ± 3.7 | 31.8 ± 1.5 | 25.7 ± 2.3 | 22.4 ± 1.7 | 20.1 ± 3 |
| HSAP (59) | 96.6 ± 14.0 | 29.9 ± 4.8 | 24.8 ± 3.7 | 22.1 ± 3.9 | 19.7 ± 3.8 | 31 ± 2 | 25.8 ± 2.1 | 22.9 ± 1.8 | 20.4 ± 2.5 |
| EaHOMO (18) | 134.9 ± 15.3 | 39.5 ± 5.3 | 31.1 ± 3.5 | 33.5 ± 4.6 | 30.8 ± 5.4 | 29.3 ± 2.1 | 23.2 ± 2.2 | 24.8 ± 2 | 22.8 ± 2.4 |
| FLHOMO (55) | 109 ± 14.5 | 33.3 ± 4.7 | 27.5 ± 3.6 | 23.5 ± 3.8 | 24.8 ± 5.5 | 30.6 ± 2.2 | 25.5 ± 2.1 | 21.5 ± 2 | 22.5 ± 3.1 |
| LHOMO (114) | 102.2 ± 15.4 | 31.4 ± 5 | 26 ± 3.8 | 22.7 ± 3.9 | 22 ± 5.3 | 30.8 ± 2.1 | 25.6 ± 2.1 | 22.2 ± 2 | 21.4 ± 3 |
Table 4.
Correlation matrix between cusp values
| Proto | Para | Meta | Hypo | |
|---|---|---|---|---|
| Absolute values | ||||
| Proto | 0.002 | 0.001 | 0.037 | |
| Para | 0.8 | 0 | 0.006 | |
| Meta | 0.82 | 0.9 | 0.01 | |
| Hypo | 0.61 | 0.74 | 0.71 | |
| Relative values | ||||
| Proto | 0.103 | 0.088 | 0.161 | |
| Para | −0.49 | 0.813 | 0.541 | |
| Meta | −0.51 | 0.08 | 0.305 | |
| Hypo | −0.43 | −0.2 | −0.32 | |
Above diagonal: p values; below diagonal: R.
Table 5.
Correlation between TCBA and cusp values
| RMA log-log | ||||
|---|---|---|---|---|
| R | P < | Slope | 95%CI | |
| Absolute | ||||
| Proto | 0.92 | 0 | 1.04 | 0.58–1.30 |
| Para | 0.95 | 0 | 1.1 | 0.76–1.26 |
| Meta | 0.95 | 0 | 1.34 | 1.10–1.68 |
| Hypo | 0.8 | 0.002 | 0.92 | 0.49–1.28 |
| Relative | ||||
| Proto | −0.09 | 0.786 | ||
| Para | 0.11 | 0.734 | ||
| Meta | 0.5 | 0.096 | ||
| Hypo | −0.43 | 0.159 | ||
The allometric analysis of the four absolute cusp areas on the total crown base area cannot reject isometry for the protocone, paracone, and hypocone (Table 5). In these cases the slope of the log-log regression is between 0.92 and 1.10, with a wide confidence interval because of the small sample size. In contrast, the metacone displays a slope of 1.34, with a confidence interval barely excluding isometry (1.10–1.68) and suggesting positive allometry (Table 5).
Principal component analysis (Fig. 2) shows a strongly dominant first component (82% of the total variance) associated with size. A second component (10%) separates two subgroups of six specimens each by the inverse contribution of hypocone and protocone (i.e. large hypocone and small protocone vs. small hypocone and large protocone). However, because of the small sample size this component is not stable according to the Jolliffe cutoff (Jolliffe, 1986) and broken stick (Jackson, 1993) criteria, and must be interpreted with caution. A log-log regression between the absolute values of protocone and hypocone shows a slope with a value of 0.88, but with a confidence interval that cannot discard isometry (0.35–1.39).
Fig. 2.
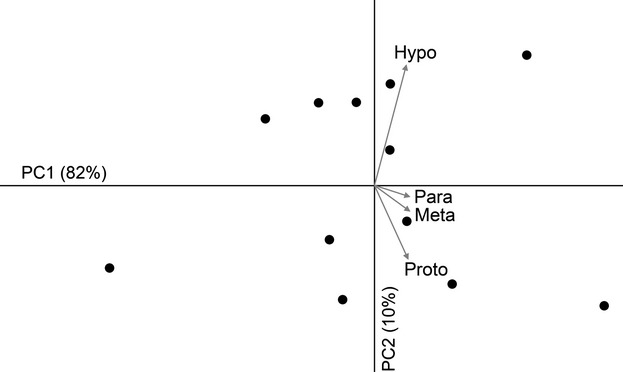
Principal component analysis of the individual absolute cusp areas, showing the first two principal components, the variance explained by each, and the vectors of the variable loadings. The first component (PC1) is associated with increase of all the variables (general size). The second component is mostly associated with the inverse proportions of the hypocone and the protocone.
Total crown base area (TCBA) and absolute and relative cusp size in SH M1s
The TCBA in the SH sample is small and only larger than the contemporary and the Upper Paleolithic H. sapiens samples (Table 3). It is significantly different from the early Homo, Homo antecessor, and contemporary H. sapiens samples (Table 6).
Table 6.
Statistical comparison of absolute and relative cusp areas
| M1 | NEA | HEI | ANT | ERE | MP HSAP | UP HSAP | HSAP | EaHOMO | FLHOMO | LHOMO |
|---|---|---|---|---|---|---|---|---|---|---|
| SH TCBA | NS | NS | ** | NS | NS | NS | ** | ** | NS | NS |
| SH Protocone | NS | NS | NS | NS | NS | ** | ** | NS | ** | ** |
| SH Paracone | NS | NS | NS | NS | NS | NS | NS | ** | NS | NS |
| SH Metacone | NS | NS | * | * | NS | NS | NS | ** | NS | NS |
| SH Hypocone | ** | * | ** | ** | NS | NS | NS | ** | ** | NS |
| SH Protocone rel | ** | ** | ** | ** | ** | ** | ** | ** | ** | ** |
| SH Paracone rel | NS | NS | ** | NS | NS | NS | * | ** | NS | NS |
| SH Metacone rel | NS | NS | NS | ** | NS | ** | ** | ** | * | ** |
| SH Hypocone rel | ** | ** | ** | ** | NS | NS | NS | ** | ** | ** |
The absolute protocone area in SH is large, close to H. antecessor and early Homo values (Table 3). It is significantly different from the Upper Paleolithic and contemporary H. sapiens samples, the pooled later Homo and the pooled fossil later Homo samples. The relative protocone area is significantly larger than that of any of the comparative groups (Table 6).
The mean of the paracone size of SH M1s is, in absolute terms, smaller than that of any other group except for the Upper Paleolithic and the contemporary H. sapiens groups and the pooled later Homo sample (Table 3). The differences are only significant when compared with the early Homo group (Table 6). The SH relative paracone area is significantly larger than that of H. antecessor and the early Homo groups, and significantly smaller than that of the contemporary H. sapiens group.
The SH M1s absolute metacone area is small and only larger than that of the contemporary H. sapiens group (Table 3). The differences are significant when compared with the early Homo group, H. antecessor and H. erectus (Table 6). The relative metacone area is only larger than that of H. heidelbergensis and H. neanderthalensis and it shows significant differences with all groups except for H. antecessor, H. heidelbergensis, H. neanderthalensis and the Middle Paleolithic H. sapiens samples.
Regarding the SH M1s hypocone, its absolute size is smaller than that of any other group except for the Upper Paleolithic and the contemporary H. sapiens samples (Table 3). It has significant differences with all the studied groups except for the pooled later Homo sample and the three H. sapiens samples (Table 6). The relative hypocone area of SH M1s is the smallest of all the studied groups, and it differs significantly from all of them except the three H. sapiens groups.
The relative size sequence of SH M1s is protocone > paracone > metacone > hypocone. This is the same pattern we find in the Upper Paleolithic, contemporary and late Homo samples, and it is different from the pattern found in H. antecessor, H. erectus, H. heidelbergensis (excluding SH), H. neanderthalensis and the Middle Paleolithic H. sapiens sample, in which the hypocone is equal or larger than the metacone (Table 3). Only in the early Homo group is the metacone larger than the paracone.
Cusp angles
The SH protocone angle (A) is the largest in all the groups, followed by Middle Paleolithic H. sapiens and the H. antecessor specimen, and it is significantly different from contemporary H. sapiens, which is the group with the smallest angle (Tables 7 and 8). The mean of the SH paracone angle (B) is only larger than that of H. neanderthalensis (which is the group presenting the lowest value) and the Middle Paleolithic H. sapiens sample, but the differences are not significant with any of the studied groups. Compared with the other groups, the SH metacone angle (C) is large and only smaller than that of H. neanderthalensis, although the differences are not significant. However, the differences with the Middle Paleolithic and the Upper Paleolithic H. sapiens samples are significant (Table 8). Finally, the SH hypocone angle (D) is the smallest of all the groups presented here, followed by Neanderthals, and is significantly different from all groups except for H. neanderthalensis (Tables 7 and 8).
Table 7.
Cusp angles
| A (protocone) | B (paracone) | C (metacone) | D (hypocone) | |
|---|---|---|---|---|
| SH (10) | 109.4 ± 8.2 | 73.0 ± 8.9 | 111.5 ± 6.2 | 66.2 ± 5.9 |
| NEA (17) | 106.1 ± 5.2 | 66.7 ± 6.7 | 118.0 ± 10.0 | 69.0 ± 6.1 |
| HSAP (24) | 101.4 ± 10.1 | 74.3 ± 4 | 106.2 ± 5.5 | 78.6 ± 7.7 |
| MP HSAP (4) | 109 ± 4.5 | 72.5 ± 2.5 | 102.0 ± 1.9 | 79.6 ± 6.1 |
| UP HSAP (5) | 106.3 ± 4.4 | 71.1 ± 2.7 | 110.3 ± 4.9 | 73.3 ± 4.8 |
| ANT (1) | 107.8 | 74.5 | 106 | 71.3 |
| ERE (2) | 105.3 | 75.2 | 96.8 | 82 |
Table 8.
Statistical comparison of angles
| NEA | HSAP | MP HSAP | |
|---|---|---|---|
| SH A | NS | * | NS |
| SH B | NS | NS | NS |
| SH C | NS | ** | ** |
| SH D | NS | ** | ** |
Occlusal polygon
The means of the SH M1s and H. antecessor relative occlusal polygons are the same, and the smallest of all the studied groups (Table 9). SH shows significant differences with all the groups that allow statistical comparison except for H. neanderthalensis (Table 9). Thus, SH M1s share a small relative occlusal polygon with H. neanderthalensis and H. antecessor, whereas H. sapiens and H. erectus share expanded occlusal polygons.
Table 9.
M1 relative occlusal polygon area (OPA)
Discussion
Previous studies have identified species-specific patterns of morphometric variation in upper first molars (M1) across the genus Homo (e.g. Wood & Engleman, 1988; Bailey, 2004; Gómez-Robles et al. 2007, 2011a; Martinón-Torres et al. 2007; Moggi-Cecchi & Boccone, 2007; Quam et al. 2009). These differences were particularly significant between H. sapiens and H. neanderthalensis, suggesting they could be a useful tool for the taxonomic identification of isolated dental remains from Late Pleistocene sites (e.g. Smith, 1976; Morris, 1986; Bailey, 2002b, 2004; Harvati et al. 2003). According to Bailey (2004) and Quam et al. (2009) the typical M1 Neanderthal features were generally absent in the H. sapiens sample and present already in their small European Middle Pleistocene samples, suggesting an early appearance of these features in the Neanderthal evolutionary lineage. A geometric morphometric study (Gómez-Robles et al. 2007, 2011a) confirmed that the large Middle Pleistocene M1 sample from Atapuerca-SH also displays the typical skewed rhomboidal shape with bulging hypocone that characterizes the crown outline in Neanderthals, and that this morphotype was also present in the Early Pleistocene sample from Gran Dolina-TD6, attributed to H. antecessor (Bermudez de Castro et al. 1997). However, to date, there have been no data about cusp proportions and occlusal polygon from SH for comparison. Given the strong degree of Neanderthal affinities seen throughout the skeleton in the Sima de los Huesos hypodigm (e.g. Arsuaga et al. 1997b; Carretero et al. 1997; Martínez & Arsuaga, 1997; Rosas, 2001; Gómez-Olivencia et al. 2007; Bermúdez de Castro et al. 2009; Martinón-Torres et al. 2012), it was expected that SH M1s would also display the typical Neanderthal features for these variables. Surprisingly, this study reveals that SH M1s present a mosaic of typical H. neanderthalensis and typical H. sapiens features. SH M1s displays the same strongly skewed (measured by the angles) and relatively small occlusal polygon as Neanderthals. However, the relative contribution of SH individual cusps to the total crown base area differs from Neanderthals and resembles that of modern humans.
The TCBA of the SH M1s is small and falls within the range of variation of modern humans. The small postcanine size of the SH population was already ascertained in previous studies (Bermúdez de Castro, 1986; Bermúdez de Castro & Nicolás, 1995, 1996; Gómez-Robles et al. 2012). Although the identification of a general dental reduction process that affects late Homo groups is not surprising (Wolpoff, 1971; Brace et al. 1987), the marked degree and pattern of reduction seen in the SH sample, accompanied by the loss of main cusps in lower molars and M2 and M3, is exceptional in a Middle Pleistocene population and even in Neanderthals (Bermúdez de Castro & Nicolás, 1995; Gómez-Robles et al. 2012; Martinón-Torres et al. 2012). SH hominins have mandibular posterior teeth that are smaller in absolute terms than those of other Pleistocene groups (Bermúdez de Castro, 1986) and are comparable to modern humans not only in size but in other traits such as similar intermolar size ratios and frequent absence of a hypoconulid (Bermúdez de Castro & Nicolás, 1995; Gómez-Robles, 2010; Gómez-Robles et al. 2011c). Similarly, our study reveals that SH presents the reduced M1 tooth crown size that, according to Quam et al. 2009, was only attained in Upper Paleolithic times.
Regarding M1 cusp size, the SH absolute cusp areas (except for the protocone) are small within the genus Homo, and close to/within H. sapiens range of variation. In contrast, the relative protocone area is the largest of the entire analyzed sample and significantly different from all the studied groups. The SH does not follow the pattern of relative hypocone enlargement that has been considered typical of H. heidelbergensis/H. neanderthalensis and H. antecessor (Bailey, 2004; Gómez-Robles et al. 2007, 2011a). Instead, the SH population shows a protocone expansion and hypocone reduction that characterizes H. sapiens and, thus, it refutes the hypothesis that modern human M1 cusp proportions emerged late in the human lineage (Quam et al. 2009). However, the protocone expansion is significantly larger in SH than in any of the studied samples, including H. sapiens, and could be distinct from all other groups. Although the SH hypocone has been described as relatively large because of its prominent and bulging aspect, the similarities between SH and H. neanderthalensis M1s rely on the relative position of this cusp with regard to the other cusps and to the tooth contour (Gómez-Robles et al. 2007, 2011a,b) rather than on, actually, a large size.
The small size of the relative metacone area in SH has been considered, together with an expanded hypocone, a derived feature of H. neanderthalensis (Bailey, 2004; Quam et al. 2009) and H. antecessor (Gómez-Robles et al. 2007, 2011a). The absolute metacone area was the only cusp to show some positive allometry in the SH sample (i.e. SH teeth with smaller TCBA would display a proportionally smaller metacone). However, with the available sample, the relative metacone area of SH is not significantly different from the Middle Paleolithic H. sapiens group, so we cannot confirm that this is a trait exclusively derived in the H. neanderthalensis direction. However, the non-significant results could be related to the limited size sample and thus should be interpreted with caution.
Regarding the relative occlusal polygon area, SH M1s display the same pattern of internally compressed apices as H. heidelbergensis/neanderthalensis, a feature that is also present in H. antecessor but absent in H. sapiens.
Finally, this study suggests that the SH sample shares the pattern of relatively small angles at the hypocone (D), together with a relatively large angle at the metacone (C) with H. neanderthalensis, and it is likely to be responsible for the typical buccolingual skew of the rhomboid in the latter (see also Gómez-Robles et al. 2007, 2011a). Homo antecessor would differ from H. erectus in showing a distal movement of the hypocone, as suggested by the smaller angle D (Table 5 Fig. 3). The mesial movement of the metacone in the SH sample would have the effect of decreasing angle D and increasing angle C with respect to the pattern ascertained in H. antecessor (Fig. 3). Finally, the H. neanderthalensis pattern is the result of a mainly lingual shift of the metacone that enlarges the angle of the metacone (C) and reduces the angle of the paracone (B) relative to SH. This evolutionary sequence would match the changes suggested by Bailey (2004) for the Neanderthal lineage with regard to the primitive condition. Although SH could represent an early stage of the derived Neanderthal pattern, it is important to remember that with our sample the differences between the groups are not significant. Homo antecessor, SH hominins and H. neanderthalensis all have large metacone angles and small hypocone and paracone angles compared with the primitive form (H. erectus). Regarding the cusp angles, H. sapiens also presents the primitive pattern.
Fig. 3.
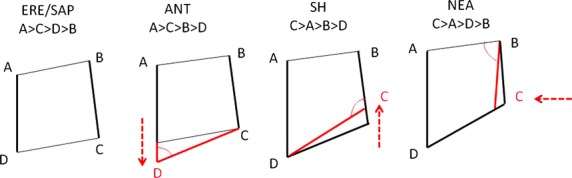
Schematic representation of evolution of the cusp angles. Arrows represent the main cusp shift in each of the represented groups. ERE, Homo erectus; SAP, Homo sapiens; ANT, Homo antecessor; SH, Sima de los Huesos; NEA, Homo neanderthalensis.
Summarizing, SH M1s present a mosaic of H. neanderthalensis and H. sapiens features (Table 10). In 2004, Bailey pointed out that the differences in relative cusp base area were not necessarily responsible for the differences in tooth shape. Indeed, her sample of Middle Paleolithic H. sapiens fell within the Neanderthal variation for the relative cusp size, but was close to contemporary modern humans for cusp angles. Conversely, SH falls close to modern humans with regard to the TCBA and cusp sizes but is close to H. neanderthalensis in the occlusal polygon compression (this study) and general shape (Gómez-Robles et al. 2007, 2011a). Thus, we agree with Bailey (2004) that the Neanderthal tooth shape cannot be attributed solely to the differences in relative size of the main cusps.
Table 10.
Comparative summary of the SH M1 features
| ANT | NEA | HSAP | |
|---|---|---|---|
| SH M1 features | |||
| Strongly skewed crown outline with a rhomboid shape and a bulging and protruding hypocone | x | x | |
| Small relative occlusal polygon | x | x | |
| Cusp angles: small D and large C | x | x | |
| Small TCBA | x | ||
| Relatively large protoconea | x | ||
| Relatively small hypocone | x | ||
| Relatively small metaconeb | x | x | |
ANT, Homo antecessor; NEA, Homo neanderthalensis; HSAP, Homo sapiens.
The relative expansion of the protocone is significantly larger than in any other studied group and could be distinct for SH (see text).
The differences between the Middle Paleolithic H. sapiens and SH were not significant.
The apparently independent evolution of the metric and the morphological variables in the M1s raises different evolutionary interpretations. One possibility is that the pattern of SH cusp proportions is related to the small size of the M1 in this population, explaining in this way the resemblances between SH and H. sapiens in both features. Previous studies on upper molars have shown that differences in molar size affect the relative cusp size (Macho & Moggi-Cecchi, 1992; Moggi-Cecchi & Boccone, 2007; Williams & Corruccini, 2007). Following a patterning cascade model (Jernvall, 2000; Jernvall & Jung, 2000; Jernvall et al. 2000), the delayed onset of dental formation and/or the early termination of cusp morphogenesis in late Homo species would result in a paedomorphic tooth that does not complete its potential cusp pattern and, thus, distal elements are reduced and/or lost. However, this mechanism is particularly evident in M2s and M3s rather than in M1s, and would affect distal rather than mesial cusps (Corruccini, 1979; Kondo & Yamada, 2003; Kondo & Townsend, 2006; Takahashi et al. 2007). This would explain the hypocone reduction in SH and H. sapiens, but not the increase in protocone size, which is particularly pronounced in the SH sample. Thus, another mechanism should be invoked to relate this pattern of cusp proportion to the dental reduction process ascertained in both groups.
Interestingly, the proportional increase of the protocone along the upper molar series was also noted by Macho & Wood (1995) in their H. sapiens sample. In addition, other researchers (Kondo et al. 2005; Takahashi et al. 2007) reported some type of interaction between the upper molar lingual cusps (in M2s and M3s), such that when the hypocone of a tooth tended to be reduced in size, the protocone of that tooth would tend to be larger. Finally, recent studies on molar variation in baboons have provided exciting venues for interpretation in this field (Hlusko et al. 2007; Koh et al. 2010). These authors have found strong genetic correlations between cusps, in particular in maxillary molars between the paracone-metacone and the protocone-hypocone (Koh et al. 2010), which do not conform to expectations from the sequence of cusp formation and/or calcification. According to Koh et al. (2010), the closer anatomical relationship between the mesiodistal length of maxillary molars with the rest of the cranium may serve as a constraint to the mesiodistal axis variation and a key factor to maintain a less variable molar row length.
Our analysis of the SH intragroup variation suggests that there are not obvious patterns of covariation associated with the relative cusp sizes. Although it is not confirmed by the bivariate analysis, the principal component analysis suggests an inverse relationship between the size of the protocone and hypocone within the SH samples, i.e. larger protocones tend to be found with small hypocones and vice versa. The results may be spurious correlations associated with the small sample size. However, at the same time, non-significant results could also be associated with the limited statistical power, and should be interpreted with caution. However, and as was mentioned above, it has been statistically demonstrated for other hominid samples that the protocone may increase at the expense of the hypocone (e.g. Takahashi et al. 2007; Koh et al. 2010). We could hypothesize that the hypocone reduction ascertained in SH and H. sapiens could be explained by an early termination of a small crown, which would affect the development of the last developing cusp. As a consequence, selective pressures would have favoured a protocone increase to compensate for mesiodistal length loss (see Koh et al. 2010). The need for the relative stability in these two cusps would be enhanced because of their role as ‘functional’ or ‘occluding’ cusps (Hiiemae & Kay, 1972; Molnar & Gantt, 1977; Molnar & Ward, 1977) and particularly the protocone, to guarantee optimal mastication (Macho & Wood, 1995). Cusp position and size depends on the combined effects of the secondary enamel knot spacing, the rates of cell proliferation and the onset and speed of the mineralization process halting the proliferation phase (Harris & Dinh, 2006). We suggest that, together with changes in the proliferation rates and/or the onset and speed of mineralization, the delayed onset of the hypocone formation would have reduced the effects of the hypocone inhibitory field, favouring a protocone enlargement.
Summarizing, we propose that as a response to the hypocone reduction caused by the strong overall dental reduction in SH and H. sapiens, selection favoured a mechanism to ensure the stability of the protocone and/or the protocone-hypocone axis, as they are the ones bearing the higher functional demands in mastication (see Macho & Wood, 1995; Koh et al. 2010).
How do we explain the expression of H. sapiens features in the SH sample? Assuming that H. neanderthalensis and H. sapiens are sister clades, this cusp proportion could be indeed a synapomorphy inherited from a hypothetical last common ancestor, and those traits would be eventually lost in H. neanderthalensis, whereas they would become typical of H. sapiens. This would explain why pre-Neanderthal and pre-sapiens groups, close to the node of divergence, present variable degrees of ‘sapiens’ and ‘Neanderthal’ features, respectively (Bermúdez de Castro et al. 2012; Martinón-Torres et al. 2012). For example, the departure of the Qafzeh sample from the typical H. sapiens pattern of cusp proportions was already noticed by Bailey (2004). This departure would be in line with other dental features such as the pronounced labial convexity (Martinón-Torres et al. 2012) or the perikymata distribution pattern (Guatelli-Steinberg & Reid, 2010) on upper incisors, which are closer to the typical patterns of Neanderthal than of H. sapiens. However, it is important to note that the ‘sapiens’ cusp pattern expressed by the SH M1s has not been identified in any earlier hominin group, including the small H. antecessor sample, which was first interpreted as the last common ancestor of Neanderthal and modern lineages (Bermudez de Castro et al. 1997; but see also Martinón-Torres et al. 2010; Bermúdez de Castro & Martinón-Torres, 2012). The small sample size of this species might preclude a real assessment of H. antecessor intragroup variability and the possibility of a polymorphic expression of this pattern in this group.
However, if the small TCBA and ‘modern’ pattern of SH cusp proportions is not a synapomorphy, then these features would have evolved separately in SH and H. sapiens and it would represent a case of parallelism. The small size and relative cusp proportions of SH M1s could be a particularity of the SH group and thus could not be extrapolated to the rest of the European Middle Pleistocene groups. Indeed, the relative protocone expansion ascertained in SH is significantly larger than that of H. sapiens, and could be distinct for the Atapuerca sample. Previous dental analyses have already pointed out the highly derived state of the Sima de los Huesos hominins, particularly in the small size of the postcanine dentition and the qualitative traits derived from this metric reduction, even more marked than in Neanderthals and some modern humans (Bermúdez de Castro & Nicolás, 1995, 1996; Gómez-Robles et al. 2012; Martinón-Torres et al. 2012). The derived traits in SH (even more derived than Neanderthals themselves; see also Prado-Simón et al. 2012) are combined with other dental and skeletal features that do not display such derived character states, such as cranial, facial and postcranial features, which show intermediate or primitive conditions with respect to classic Neanderthals (e.g. Arsuaga et al. 1997b; Carretero et al. 1997; Martínez & Arsuaga, 1997; Gómez-Olivencia et al. 2007). However, the mosaic of primitive and derived features displayed by the M1 would enlarge the list of dental features (Bermúdez de Castro & Nicolás, 1995; Gómez-Robles et al. 2007, 2008, 2011a,b, 2012; Martinón-Torres et al. 2012; Prado-Simón et al. 2012) that do not follow the gradual and anagenetic model suggested by other researchers to explain the origins of the Neanderthal lineage, where chronologically earlier populations are expected to be less Neanderthal than later groups (Dean et al. 1998; Hublin, 1998; Hublin & Roebroeks, 2009). However, to better understand the biological processes that conclude with the appearance of H. neanderthalensis it is important to take into account as many skeletal features as possible. The M1 is only an isolated piece which by itself can hardly provide a general picture. Indeed, this study sounds a note of caution in the use of isolated remains and/or features for taxonomical assignments, and strongly urges consideration of the variability of expression and the polarity of the traits under study.
Concluding remarks
The aim of this study was to contribute to the understanding of the M1 evolution in H. sapiens and H. neanderthalensis by providing the TCBA, cusp angles, cusp proportions and relative occlusal polygon area of the largest European Middle Pleistocene sample to date, the Atapuerca-Sima de los Huesos population. The combination of Neanderthal and ‘modern’ features of SH highlights the importance of understanding the variability and the polarity of the traits under study before making taxonomical assignments. Interestingly, the Middle Paleolithic H. sapiens sample from Qafzeh also presents contradicting taxonomic signals, being similar in shape to H. sapiens but similar to Neanderthals in the pattern of cusp proportions (Bailey, 2004). The analysis of the Early and Middle Pleistocene dental samples from Atapuerca have obliged to reconsider the uniqueness of traits that have been classically interpreted as typical of Neanderthals or typical of H. sapiens. Finally, our results ratify the highly derived state of the Atapuerca-SH population, and questions whether the SH sample is representative of all the European Middle Pleistocene populations or presents some distinct or exclusive features. Future findings and studies may contribute to this question by providing more information on the intra and inter-population variability of the Middle Pleistocene hominins.
Acknowledgments
The authors acknowledge all members of the Atapuerca Research Team, particularly those who excavate the Sima de los Huesos site, for their dedication and arduous work. We are grateful to Elena Lacasa-Marquina and Pilar Fernández-Colón, from the CENIEH Conservation and Restoration Department and Maicu Ortega from the Restoration and Conservation Department of the Centro de Evolución y Comportamiento Humanos (Centro Mixto UCM-ISCIII, Madrid) for their excellent assistance. We thank Ana Muela and Susana Sarmiento for their assistance in photographing the specimens. We thank the editors and two anonymous reviewers for their helpful comments. This research was supported with funding from the Dirección General de Investigación of the Spanish Ministerio de Educación y Ciencia (MEC), Projects No. CGL2009-12703-C03-01, CGL2009-12703-C03-02 and CGL2009-12703-C03-03 and from the Junta de Castilla y León Projects No. BU005A09 and GR249. Fieldwork at Atapuerca is supported by the Consejería de Cultura y Turismo of the Junta de Castilla y León and the Fundación Atapuerca. Petra Spěváčková had the benefit of a European Leonardo da Vinci Program CZ/11/LLP-LdV/PLM/134178. Ana Gracia-Téllez has a Contract-Grant from the Ramón y Cajal Program, RYC-2010-06152. The Authors declare they do not have any conflict of interest related to this manuscript.
References
- Arsuaga JL, Carretero JM, Martínez I, et al. Cranial remains and long bones from Atapuerca/Ibeas (Spain) J Hum Evol. 1991;20:191–230. [Google Scholar]
- Arsuaga JL, Martínez I, Gracia A, et al. Three new human skulls from the Sima de los Huesos Middle Pleistocene site in Sierra de Atapuerca, Spain. Nature. 1993;362:534–537. doi: 10.1038/362534a0. [DOI] [PubMed] [Google Scholar]
- Arsuaga JL, Carretero JM, Lorenzo C, et al. Size variation in middle Pleistocene humans. Science. 1997a;277:1086–1088. doi: 10.1126/science.277.5329.1086. [DOI] [PubMed] [Google Scholar]
- Arsuaga JL, Martínez I, Gracia A, et al. The Sima de los Huesos crania (Sierra de Atapuerca, Spain). A comparative study. J Hum Evol. 1997b;33:219–281. doi: 10.1006/jhev.1997.0133. [DOI] [PubMed] [Google Scholar]
- Arsuaga JL, Villaverde V, Quam R, et al. New Neandertal remains from Cova Negra (Valencia, Spain) J Hum Evol. 2007;52:31–58. doi: 10.1016/j.jhevol.2006.07.011. [DOI] [PubMed] [Google Scholar]
- Bailey SE. A closer look at Neanderthal postcanine dental morphology: the mandibular dentition. Anat Rec. 2002a;269:148–156. doi: 10.1002/ar.10116. [DOI] [PubMed] [Google Scholar]
- Bailey SE. Neandertal Dental Morphology: Implications for Modern Human Origins. Ph.D. Dissertation: Arizona State University; 2002b. [Google Scholar]
- Bailey SE. A morphometric analysis of maxillary molar crowns of Middle-Late Pleistocene hominins. J Hum Evol. 2004;47:183–198. doi: 10.1016/j.jhevol.2004.07.001. [DOI] [PubMed] [Google Scholar]
- Bailey SE, Glantz M, Weaver TD, et al. The affinity of the dental remains from Obi-Rakhmat Grotto, Uzbekistan. J Hum Evol. 2008;55:238–248. doi: 10.1016/j.jhevol.2008.03.004. [DOI] [PubMed] [Google Scholar]
- Bermúdez de Castro JM. Dental remains from Atapuerca (Spain) I. Metrics. J Hum Evol. 1986;15:265–287. [Google Scholar]
- Bermúdez de Castro JM. Dental remains from Atapuerca/Ibeas (Spain) II. Morphology. J Hum Evol. 1988;17:279–304. [Google Scholar]
- Bermúdez de Castro JM. The Atapuerca dental remains: new evidence (1987–1991 excavations) and interpretations. J Hum Evol. 1993;24:339–371. [Google Scholar]
- Bermúdez de Castro JM, Martinón-Torres M. A new model for the evolution of the human Pleistocene populations of Europe. Quatern Int. 2012;295:102–112. [Google Scholar]
- Bermúdez de Castro JM, Nicolás ME. Posterior dental size reduction in hominids: the Atapuerca evidence. Am J Phys Anthropol. 1995;96:335–356. doi: 10.1002/ajpa.1330960403. [DOI] [PubMed] [Google Scholar]
- Bermúdez de Castro JM, Nicolás ME. Changes in the lower premolar-size sequence during hominid evolution. Phylogenetic implications. Hum Evol. 1996;11:205–215. [Google Scholar]
- Bermudez de Castro JM, Arsuaga JL, Carbonell E, et al. A Hominid from the lower Pleistocene of Atapuerca, Spain: possible ancestor to Neandertals and modern humans. Science. 1997;276:1392–1395. doi: 10.1126/science.276.5317.1392. [DOI] [PubMed] [Google Scholar]
- Bermúdez de Castro JM, Martinón-Torres M, Lozano M, et al. Paleodemography of the Atapuerca-Sima de los Huesos hominin sample: a revision and new approaches to the paleodemography of the European Middle Pleistocene population. J Anthropol Res. 2004;60:5–26. [Google Scholar]
- Bermúdez de Castro JM, Martinón-Torres M, Gómez-Robles A, et al. Comparative analysis of the Gran Dolina TD6 (Spain) and Tighennif (Algeria) hominin mandibles. Bull Mem Soc Anthropol Paris. 2007;19:149–167. [Google Scholar]
- Bermúdez de Castro JM, Martinón-Torres M, Gómez-Robles A. Gli omini di Atapuerca-Sima de los Huesos e le origini dei Neandertaliani. In: Facchini F, Belcastro MG, et al., editors. La lunga storia di Neandertal. Biologia e comportamento. Milano: Jaca Book; 2009. pp. 61–75. [Google Scholar]
- Bermúdez de Castro JM, Carretero JM, García-González R, et al. Early pleistocene human humeri from the Gran Dolina-TD6 site (Sierra de Atapuerca, Spain) Am J Phys Anthropol. 2012;147:604–617. doi: 10.1002/ajpa.22020. [DOI] [PubMed] [Google Scholar]
- Biggerstaff RH. The basal area of posterior tooth crown components: the assessment of within tooth variation of premolars and molars. Am J Phys Anthropol. 1969;31:163–170. doi: 10.1002/ajpa.1330310204. [DOI] [PubMed] [Google Scholar]
- Brace C, Rosenberg R, Hunt KD. Gradual changes in human tooth size in the late Pleistocene and Post-Pleistocene. Evolution. 1987;41:705–720. doi: 10.1111/j.1558-5646.1987.tb05847.x. [DOI] [PubMed] [Google Scholar]
- Carretero JM, Arsuaga JL, Lorenzo C. Clavicles, scapulae and humeri from the Sima de los Huesos Site (Sierra de Atapuerca, Spain) J Hum Evol. 1997;33:357–408. doi: 10.1006/jhev.1997.0128. [DOI] [PubMed] [Google Scholar]
- Corruccini RS. Molar cusp-size variability in relation to ontogenesis in hominoid primates. Arch Oral Biol. 1979;24:633–634. doi: 10.1016/0003-9969(79)90026-8. [DOI] [PubMed] [Google Scholar]
- Dahlberg AA. The changing dentition of man. J Am Dent Assoc. 1945;34:676–690. [Google Scholar]
- Dean D, Hublin J-J, Holloway R, et al. On the phylogenetic position of the pre-Neandertal specimen from Reilingen, Germany. J Hum Evol. 1998;34:485–508. doi: 10.1006/jhev.1998.0214. [DOI] [PubMed] [Google Scholar]
- Gómez-Olivencia A, Carretero JM, Arsuaga JL, et al. Metric and morphological study of the upper cervical spine from the Sima de los Huesos site (Sierra de Atapuerca, Burgos, Spain) J Hum Evol. 2007;53:6–25. doi: 10.1016/j.jhevol.2006.12.006. [DOI] [PubMed] [Google Scholar]
- Gómez-Robles A. Análisis de la forma dental en la filogenia humana. Tendencias y modelos evolutivos basados en métodos de morfometría geométrica. Ph.D. Dissertation: Universidad de Granada; 2010. [Google Scholar]
- Gómez-Robles A, Martinon-Torres M, Bermudez de Castro JM, et al. A geometric morphometric analysis of hominin upper first molar shape. J Hum Evol. 2007;53:272–285. doi: 10.1016/j.jhevol.2007.02.002. [DOI] [PubMed] [Google Scholar]
- Gómez-Robles A, Martinón-Torres M, Bermúdez de Castro JM, et al. Geometric morphometric analysis of the crown morphology of the lower first premolar of hominins, with special attention to Pleistocene Homo. J Hum Evol. 2008;55:627–638. doi: 10.1016/j.jhevol.2008.03.011. [DOI] [PubMed] [Google Scholar]
- Gómez-Robles A, Martinón-Torres M, Bermúdez de Castro JM, et al. Proceedings of the Congress “The transition from archaic to modern: quantitative approaches”. Leipzig: Max Planck Institute for Evolutionary Anthropology; 2009. Intra- and interspecific variation of dental morphology. A quantitative approach to Neandertal and modern human divergence. [Google Scholar]
- Gómez-Robles A, Bermúdez de Castro JM, Martinón-Torres M, et al. Crown size and cusp proportions in Homo antecessor upper first molars. A comment on Quam et al., 2009. J Anat. 2011a;218:258–262. doi: 10.1111/j.1469-7580.2010.01324.x. [DOI] [PMC free article] [PubMed] [Google Scholar]
- Gómez-Robles A, Martinón-Torres M, Bermúdez de Castro JM, et al. A geometric morphometric analysis of hominin upper premolars. Shape variation and morphological integration. J Hum Evol. 2011b;61:688–702. doi: 10.1016/j.jhevol.2011.09.004. [DOI] [PubMed] [Google Scholar]
- Gómez-Robles A, Olejniczak AJ, Martinón-Torres M, et al. Evolutionary novelties and lossess in geometric morphometrics: a practical approach through hominin molar morhpology. Evolution. 2011c;65:1772–1790. doi: 10.1111/j.1558-5646.2011.01244.x. [DOI] [PubMed] [Google Scholar]
- Gómez-Robles A, Bermúdez de Castro JM, Martinón-Torres M, et al. A geometric morphometric analysis of hominin upper second and third molars with particular emphasis on European Pleistocene populations. J Hum Evol. 2012;63:512–526. doi: 10.1016/j.jhevol.2012.06.002. [DOI] [PubMed] [Google Scholar]
- Guatelli-Steinberg D, Reid DJ. The distribution of perikymata on Qafzeh anterior teeth. Am J Phys Anthropol. 2010;141:152–157. doi: 10.1002/ajpa.21158. [DOI] [PubMed] [Google Scholar]
- Hammer Ø, Harper DAT, Ryan PD. PAST: Paleontological statistics software package for education and data analysis. Palaentol Electronica. 2001;4:1–9. [Google Scholar]
- Harris EF, Dinh DP. Intercusp relationships of the permanent maxillary first and second molars in American whites. Am J Phys Anthropol. 2006;130:514–528. doi: 10.1002/ajpa.20389. [DOI] [PubMed] [Google Scholar]
- Harvati K, Panagopoulou E, Karkanas P. First Neanderthal remains from Greece: the evidence from Lakonis. J Hum Evol. 2003;45:465–473. doi: 10.1016/j.jhevol.2003.09.005. [DOI] [PubMed] [Google Scholar]
- Hiiemae K, Kay RF. Trends in the volution of primate mastication. Nature. 1972;240:486–487. doi: 10.1038/240486a0. [DOI] [PubMed] [Google Scholar]
- Hlusko LJ, Maas ML, Mahaney MC. Statistical genetics of molar cusp patterning in pedigreed baboons: implications for primate dental development and evolution. J Exp Zool B Mol Dev Evol. 2004;302B:268–283. doi: 10.1002/jez.b.21. [DOI] [PubMed] [Google Scholar]
- Hlusko LJ, Do N, Mahaney MC. Genetic correlations between mandibular molar cusp areas in baboons. Am J Phys Anthropol. 2007;132:445–454. doi: 10.1002/ajpa.20528. [DOI] [PubMed] [Google Scholar]
- Hublin JJ. Climate change, paleogeography and the evolution of the Neandertals. In: Akazawa T, Aoki K, Bar-Yosef O, editors. Neandertals and Modern Humans in Western Asia. New York: Plenum Publishing; 1998. pp. 295–310. [Google Scholar]
- Hublin JJ. The origin of Neandertals. Proc Natl Acad Sci U S A. 2009;106:16022–16027. doi: 10.1073/pnas.0904119106. [DOI] [PMC free article] [PubMed] [Google Scholar]
- Hublin J-J, Roebroeks W. Ebb and flow or regional extinctions? On the character of Neandertal occupation of northern environments. CR Palevol. 2009;8:503–509. [Google Scholar]
- Jackson DA. Stopping rules in principal components analysis: a comparison of heuristical and statistical approaches. Ecology. 1993;74:2204–2214. [Google Scholar]
- Jernvall J. Linking development with generation of novelty in mammalian teeth. Proc Natl Acad Sci U S A. 2000;97:2641–2645. doi: 10.1073/pnas.050586297. [DOI] [PMC free article] [PubMed] [Google Scholar]
- Jernvall J, Jung H-S. Genotype, phenotype, and developmental biology of molar tooth characters. Yearb Phys Anthropol. 2000;43:171–190. doi: 10.1002/1096-8644(2000)43:31+<171::aid-ajpa6>3.0.co;2-3. [DOI] [PubMed] [Google Scholar]
- Jernvall J, Keränen SVE, Thesleff I. Evolutionary modification of development in mammalian teeth: quantifying gene expression patterns and topography. Proc Natl Acad Sci U S A. 2000;97:14444–14448. doi: 10.1073/pnas.97.26.14444. [DOI] [PMC free article] [PubMed] [Google Scholar]
- Jolliffe IT. Principal Component Analysis. New York: Springer Verlag; 1986. [Google Scholar]
- Klein RG. The Human Career. Chicago: University of Chicago Press; 1999. [Google Scholar]
- Koh C, Bates E, Broughton E, et al. Genetic integration of molar cusp size variation in baboons. Am J Phys Anthropol. 2010;142:246–260. doi: 10.1002/ajpa.21221. [DOI] [PMC free article] [PubMed] [Google Scholar]
- Kondo S, Townsend GC. Associations between Carabelli trait and cusp areas in human permanent maxillary first molars. Am J Phys Anthropol. 2006;129:196–203. doi: 10.1002/ajpa.20271. [DOI] [PubMed] [Google Scholar]
- Kondo S, Yamada H. Cusp size variability of the maxillary molariform teeth. Anthropol Sci. 2003;111:255–263. [Google Scholar]
- Kondo S, Townsend GC, Yamada H. Sexual dimorphism of cusp dimensions in human maxillary molars. Am J Phys Anthropol. 2005;128:870–877. doi: 10.1002/ajpa.20084. [DOI] [PubMed] [Google Scholar]
- Lorenzo C, Carretero JM, Arsuaga JL, et al. Intrapopulational body size variation and cranial capacity variation in middle Pleistocene humans: the Sima de los Huesos sample (Sierra de Atapuerca, Spain) Am J Phys Anthropol. 1998;106:19–33. doi: 10.1002/(SICI)1096-8644(199805)106:1<19::AID-AJPA2>3.0.CO;2-8. [DOI] [PubMed] [Google Scholar]
- Macho GA, Moggi-Cecchi J. Reduction of maxillary molars in Homo sapiens spaiens: a different perspective. Am J Phys Anthropol. 1992;87:151–159. doi: 10.1002/ajpa.1330870203. [DOI] [PubMed] [Google Scholar]
- Macho GA, Wood BA. The role of time and timing in hominid dental evolution. Evol Anthropol. 1995;4:17–31. [Google Scholar]
- Martínez I, Arsuaga JL. The temporal bones from Sima de los Huesos Middle Pleistocene site (Sierra de Atapuerca, Spain). A phylogenetic approach. J Hum Evol. 1997;33:283–318. doi: 10.1006/jhev.1997.0155. [DOI] [PubMed] [Google Scholar]
- Martinón-Torres M, Bermúdez de Castro JM, Gómez-Robles A, et al. Dental evidence on the hominin dispersals during the Pleistocene. Proc Natl Acad Sci U S A. 2007;104:13279–13282. doi: 10.1073/pnas.0706152104. [DOI] [PMC free article] [PubMed] [Google Scholar]
- Martinón-Torres M, Dennell R, Bermúdez de Castro JM. The Denisova hominin need not be an out of Africa story. J Hum Evol. 2010;60:251–255. doi: 10.1016/j.jhevol.2010.10.005. [DOI] [PubMed] [Google Scholar]
- Martinón-Torres M, Bermúdez de Castro JM, Gómez-Robles A, et al. Morphological description and comparison of the dental remains from Atapuerca-Sima de los Huesos site (Spain) J Hum Evol. 2012;62:7–58. doi: 10.1016/j.jhevol.2011.08.007. [DOI] [PubMed] [Google Scholar]
- Martinón-Torres M, Bermúdez de Castro JM, Martín-Francés L. Dental morphology of European Middle Pleistocene populations. In: Irish JD, Scott GR, et al., editors. Anthropological Perspectives on Tooth Morphology. Genetics, Evolution, Variation. New York: Cambridge University Press; 2013. pp. 201–221. [Google Scholar]
- Moggi-Cecchi J, Boccone S. Maxillary molars cusp morphology of South African Australopithecines. In: Bailey SE, Hublin J-J, editors. Dental Perspectives on Human Evolution: State of the Art Research in Dental Paleoanthropology. New York: Springer; 2007. [Google Scholar]
- Molnar S. Human tooth wear, tooth function and cultural variability. Am J Phys Anthropol. 1971;34:175–190. doi: 10.1002/ajpa.1330340204. [DOI] [PubMed] [Google Scholar]
- Molnar S, Gantt DG. Functional implications of primate enamel thickness. Am J Phys Anthropol. 1977;46:447–454. doi: 10.1002/ajpa.1330460310. [DOI] [PubMed] [Google Scholar]
- Molnar IM, Ward S. On the hominid masticatory complex: biomechanical and evolutionary perspectives. J Hum Evol. 1977;6:557–568. [Google Scholar]
- Morris DH. Maxillary molar occlusal polygons in five human samples. Am J Phys Anthropol. 1986;70:333–338. doi: 10.1002/ajpa.1330700308. [DOI] [PubMed] [Google Scholar]
- Prado-Simón L, Martinón-Torres M, Baca P, et al. Three-dimensional evaluation of root canal morphology in lower second premolars of early and middle pleistocene human populations from Atapuerca (Burgos, Spain) Am J Phys Anthropol. 2012;147:452–461. doi: 10.1002/ajpa.22015. [DOI] [PubMed] [Google Scholar]
- Quam R, Bailey S, Wood B. Evolution of M1 crown size and cusp proportions in the genus Homo. J Anat. 2009;214:655–670. doi: 10.1111/j.1469-7580.2009.01064.x. [DOI] [PMC free article] [PubMed] [Google Scholar]
- Rosas A. Occurrence of Neanderthal features in mandibles from the Atapuerca-SH site. Am J Phys Anthropol. 2001;114:74–91. doi: 10.1002/1096-8644(200101)114:1<74::AID-AJPA1007>3.0.CO;2-U. [DOI] [PubMed] [Google Scholar]
- Schindlein JE, Arganda-Carreras I, Frise E, et al. Fiji - an open source platform for biological image. Nat Methods. 2012;9:676–682. doi: 10.1038/nmeth.2019. [DOI] [PMC free article] [PubMed] [Google Scholar]
- Smith F. The Neandertal remains from Krapina. Univ Tenn Dept Anthropol Rep Invest. 1976;15:1–359. [Google Scholar]
- Stringer CB. Secrets of the pit of the bones. Nature. 1993;362:501–502. doi: 10.1038/362501a0. [DOI] [PubMed] [Google Scholar]
- Takahashi M, Kondo S, Townsend GC, et al. Variability in cusp size of human maxillary molars, with particular reference to the hypocone. Arch Oral Biol. 2007;52:1146–1154. doi: 10.1016/j.archoralbio.2007.06.005. [DOI] [PubMed] [Google Scholar]
- Tattersall I. Rethinking human evolution. Archaeology. 1999;52:22–25. [Google Scholar]
- Tattersall I, Schwartz JH. The distinctiveness and systematic context of Homo neanderthalensis. In: Harvati K, Harrison T, editors. Neanderthals Revisited: New Approaches and perspectives. Springer: Dordrecht; 2006. pp. 9–22. [Google Scholar]
- Tattersall I, Schwartz JH. Evolution of the genus Homo. Annu Rev Earth Planet Sci. 2009;37:67–92. [Google Scholar]
- Williams BA, Corruccini RS. The relationship between crown size and complexity in two collections. Dental Anthropol. 2007;20:29–32. [Google Scholar]
- Wolpoff MH. Metric Trends in Hominid Dental Evolution. Cleveland: Press of Case Western Reserve University; 1971. [Google Scholar]
- Wood B. Koobi Fora Research Project, Vol. 4. Hominid Cranial Remains. Clarendon Press: Oxford; 1991. [Google Scholar]
- Wood BA, Engleman CA. Analysis of the dental morphology of Plio-Pleistocene hominids: V. Maxillary postcanine tooth morphology. J Anat. 1988;161:1–35. [PMC free article] [PubMed] [Google Scholar]
- Wood B, Abbott SA, Uytterschaut HT. Analysis of the dental morphology of Plio-Pleistocene hominids IV. Mandibular postcanine root morphology. J Anat. 1988;156:107–139. [PMC free article] [PubMed] [Google Scholar]