

Abstract
The most conspicuous event in the cell cycle is the alignment of chromosomes in metaphase. Chromosome alignment fosters faithful segregation through the formation of bi-oriented attachments of kinetochores to spindle microtubules. Strikingly, numerous kinetochore-microtubule (k-MT) attachment errors are present in early mitosis (prometaphase)1, and the persistence of those errors is the leading cause of chromosome mis-segregation in aneuploid human tumor cells that continually mis-segregate whole chromosomes (e.g. chromosomal instability)2–7. How robust error correction is achieved in prometaphase to ensure error-free mitosis remains unknown. Here we show that k-MT attachments in prometaphase cells are significantly less stable than in metaphase cells. The switch to more stable k-MT attachments in metaphase requires the proteasome-dependent destruction of cyclin A in prometaphase. Persistent cyclin A expression prevents k-MT stabilization even in cells with aligned chromosomes. In contrast, k-MTs are prematurely stabilized in cyclin A-deficient cells. Consequently, cells lacking cyclin A display higher rates of chromosome mis-segregation. Thus, the stability of k-MT attachments increases decisively in a coordinated fashion among all chromosomes as cells transit from prometaphase to metaphase. Cyclin A creates a cellular environment that promotes microtubule detachment from kinetochores in prometaphase to ensure efficient error correction and faithful chromosome segregation.
The correction of k-MT attachment errors relies on the detachment of microtubules from kinetochores8, and current models for k-MT regulation involve either chromosome autonomous9 or coordinated processes (E.D. Fig. 1). We measured k-MT attachment stability using fluorescence dissipation after photoactivation in three vertebrate cell lines (Fig. 1; E.D. Fig. 2). Cells were defined in prometaphase and metaphase based upon chromosome alignment using DIC optics. In each cell line the average stability of the stable MT population (e.g. k-MTs) in prometaphase was significantly less than in metaphase (p ≤ 0.01, Students t-test; Fig. 1a, b, c), and the k-MT half-lives in prometaphase and metaphase cells distributed into non-overlapping populations. The difference cannot be accounted for by differences in the initial intensity of GFP fluorescence after photoactivation (E.D. Fig. 3a), the fraction of microtubules in the slowly decaying population (E.D. Fig. 3b), or poleward microtubule flux (E.D. Fig. 4). Importantly, fluorescence decay of the activated region in both metaphase and prometaphase cells fit to a double exponential curve (r2>0.99) indicating that only two populations of microtubules are identified by this method: non-k-MTs and k-MTs10.
Figure 1. The stability of k-MT attachments in prometaphase and metaphase.
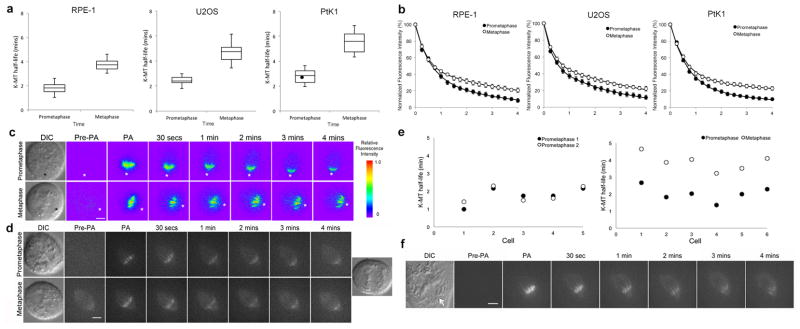
a, Box and whisker plot of k-MT half-lives of RPE-1, U2OS, and PtK1 cells in prometaphase and metaphase calculated from the fluorescence intensity decay curves (r2 > 0.99); n = 40 cells for RPE-1 and U2OS, and 20 cells for PTK1 per condition. Black circle represents the cell from panel f. b, Normalized fluorescence intensity of prometaphase (filled circles) and metaphase (white circles) spindles. c, DIC and background subtracted fluorescence images (pseudo-colored heatmaps) of U2OS cells in prometaphase and metaphase. Asterisks mark spindle poles. Scale bar, 5 μm. d, DIC and fluorescence images of an RPE-1 cell in prometaphase and metaphase. Scale bar, 5 μm. e, k-MT half-life of individual RPE-1 cells photoactivated serially in prometaphase (left) or in prometaphase and then in metaphase (right). f, DIC and fluorescence images of a PtK1 in prometaphase. Arrow indicates unaligned chromosome. Scale bar, 5 μm.
To test if k-MT attachments become progressively stabilized during prometaphase we measured k-MT stability serially in the same cell (Fig. 1d, e). Repeated photoactivation did not compromise cell viability as judged by successful progression to anaphase (Fig. 1d and E.D. Fig. 5a). Photoactivation of RPE-1 cells twice in prometaphase yielded equivalent k-MT half lives for each trial in each cell. In contrast, k-MT stability sharply increased between prometaphase and metaphase when measured in the same cell (Fig. 1e). The switch in k-MT stability was remarkably consistent at 1.9±0.2 min. Similar results were obtained in U2OS cells (E.D. Fig. 5b). The percent of microtubules in the slowly decaying fraction did not change at different times in prometaphase cells (E.D. Fig. 5c) as would be predicted by the chromosome autonomous model (E.D. Fig. 1). We also photoactivated the spindle microtubules of aligned chromosomes in a prometaphase PtK1 cell containing one unaligned chromosomes (Fig. 1f). The half-life of k-MTs on these aligned chromosomes in this cell was 2.5 min (single data point identified in Fig. 1a) and within the population of other prometaphase cells. These data demonstrate a coordinated switch in k-MT attachment stability between prometaphase and metaphase cells (E.D. Fig. 1).
Next, we tested if the switch in k-MT attachment stability relies on protein turnover (Fig. 2a). Proteasome inhibitors did not alter k-MT attachment stability during prometaphase. However, when cells transited from prometaphase to metaphase in the presence of the inhibitors the switch to stable k-MT attachments was prevented (Fig. 2a). The inhibitors had no effect if they were added after chromosome alignment in metaphase. Cells failed to progress to anaphase in all these conditions verifying the effective inhibition of the proteasome. Thus, the proteasome-dependent destruction of protein substrates during prometaphase is required for the coordinated switch in k-MT stability in metaphase.
Figure 2. K-MT stability relies on cyclin A.
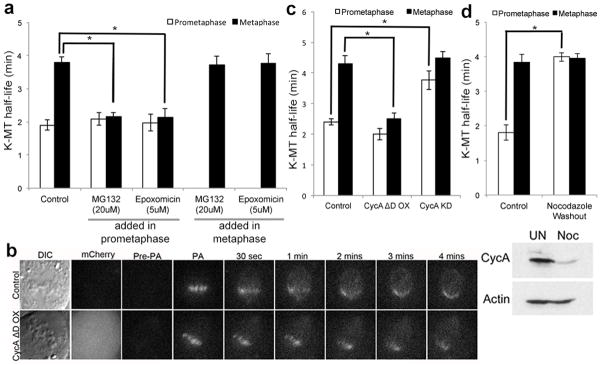
a, k-MT half-life of RPE-1 cells treated with 20μM MG132 or 5μM Epoxomicin in prometaphase and metaphase; n = 10 cells per condition. b, DIC and fluorescence images of metaphase spindles in untreated (control) and cyclin A overexpressing (CycA ΔD OX) U2OS cells with cyclin A ΔD visualized by mCherry fluorescence. Scale bar, 5 μm. c, k-MT half-life of untreated (control), cyclin A overexpressing (CycA ΔD OX), and cyclin A depleted (CycA KD) U2OS cells; n = 13 cells for control, n = 10 cells for CycA ΔD OX and CycA KD per condition. d, top: k-MT half-life of RPE-1 cells untreated (control) or released from 12 hour nocodazole treatment (Nocodazole Washout); n = 10 cells per condition. Bottom: cyclin A and actin immunoblot of untreated (control) or Nocodazole arrested (Noc) cells. Graphs show mean ± s.e.m. *P ≤ 0.01, two-tailed t-test.
Cyclin A is degraded in prometaphase11,12, and we tested if cyclin A influenced the switch in k-MT attachment stability (Fig. 2b–d). Expression of an mCherry-tagged mutant version of cyclin A that lacks the degradation box was confirmed by immunoblot (E.D. Fig. 6a) and shown to persist in mitotic cells by fluorescence microscopy (Fig. 2b). Expression of this mutant cyclin A did not change k-MT attachment stability in prometaphase (Fig. 2c), but prevented the switch to stable attachments in metaphase (Fig. 2b & c and E.D. Fig. 6c). This mutant version of cyclin A did not impair chromosome bi-orientation as judged by the displacement of BubR1 from kinetochores13, the recruitment of astrin to kinetochores14, or the relative inter-kinetochore distance (E.D. Fig. 7). The quantity and activity of Aurora B kinase15,16 was slightly increased in cells overexpressing this mutant of cyclin A during metaphase (E.D. Fig 7). There was no significant linear correlation between k-MT attachment stability and expression level of this protein (E.D. Fig. 6b) indicating that the persistent expression of cyclin A is sufficient to exceed a threshold that prevents a switch from unstable to stable k-MT attachments.
Vertebrate cells can enter mitosis in the absence of cyclin A17,18, and we depleted cyclin A expression using RNA interference (E.D. Fig. 6a). Prometaphase cells lacking cyclin A displayed k-MT attachment stability equivalent to untreated metaphase cells (Fig. 2c and E.D. Fig. 6c). K-MT attachment stability in metaphase cells lacking cyclin A was not different from control cells. There was a slight decrease in the quantity and activity of aurora B kinase during prometaphase (E.D. Fig. 7). We also prolonged mitosis with nocodazole to allow the destruction of endogenous cyclin A (Fig. 2d) since cyclin A destruction is not prevented by the spindle assembly checkpoint19. K-MT attachments are significantly more stable in prometaphase cells recovering from nocodazole treatment than untreated control cells (Fig. 2d). Nocodazole recovery did not alter k-MT attachment stability once cells reached metaphase. Manipulation of cyclin A (either depletion or expression of the non-degradable mutant) had no effect on the stability of non-k-MT (E.D. Fig. 8a) or MT stability in Nuf2-deficient cells that lack k-MT (E.D. Fig. 8b, c) showing that cyclin A specifically influences k-MT. Poleward microtubule flux did not account for the difference in k-MT stability between control cells and cells overexpressing non-degradable cyclin A (E.D. Fig. 9). Thus, cyclin A destabilizes k-MT to regulate the switch from unstable k-MT in prometaphase to stable k-MT in metaphase.
There is a direct relationship between k-MT attachment stability and chromosome segregation fidelity2, and cyclin A-deficiency led to a significant increase in the fraction of cells displaying lagging chromosomes in anaphase (Fig 3b). The lagging chromosomes are caused by persistent merotelic kinetochore attachments as judged by k-MT attachments oriented toward both spindle poles (Fig. 3a). These segregation errors were not caused by alterations in chromosome compaction (E.D. Fig. 10a, b) or DNA double strand breaks (E.D. Fig. 10c). Furthermore, cells arrested in mitosis with monastrol for 6 hours display a 60% reduction in cyclin A levels and have significantly more stable k-MT attachments relative to cells arrested for only 1 hour (Fig. 3c,d). Accordingly, cells recovering from 6 hours of monastrol treatment displayed significantly higher percentages of anaphase cells with lagging chromosomes compared to cells recovering from only 1 hour of monastrol treatment (Fig. 3e). Thus, by destabilizing k-MTs, cyclin A promotes faithful chromosome segregation although disruption of the canonical functions of cyclin A during S phase (via siRNA or protein overexpression) could also contribute to the observed chromosome mis-segregation.
Figure 3. Cyclin A deficiency increases chromosome mis-segregation.
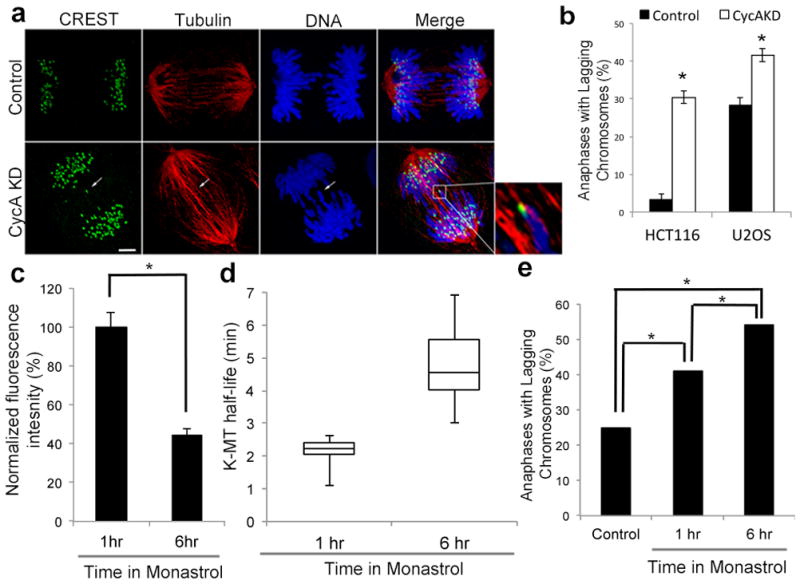
a, anaphase spindles of untreated (control) or cyclin A depleted (CycA KD) U2OS cells. White arrow highlights merotelic kinetochore. Scale bar, 5 μm. b, percent of anaphase cells with lagging chromosomes; n = 300 cells per condition from three independent experiments. c, fluorescence intensities of U2OS cells stained for cyclin A; n = 100 cells per condition from three independent experiments. d, Box and whisker plot of k-MT half-lives of U2OS cells incubated in monastrol for 1 hour (1hr) and 6 hours (6hr); n = 10 cells per condition. e, percent of anaphase cells with lagging chromosomes that were untreated (control), or after recovery from monastrol incubation for 1 hour (1hr) or 6 hours (6hr); n = 100 cells for 1hr and 123 cells for 6 hr. Graphs show mean ± s.e.m. *P ≤ 0.01, two-tailed t-test.
Quantitative fluorescence imaging indicates that endogenous cyclin A levels drop to 40% and 20% in metaphase and anaphase, respectively, relative to prometaphase cells (Fig. 4a, b). Thus, the cyclin A level in the prometaphase cell shown in Figure 1f has yet to dip below that threshold. Expression of wild type cyclin A tagged with mCherry destabilizes k-MT in metaphase akin to the non-degradable mutant cyclin A (Fig. 4c), but it does not prohibit anaphase entry12 and we observe anaphase cells with cyclin A levels approximately four-fold higher than untreated cells in anaphase (Fig. 4e). Consequently, chromosome segregation fidelity is increased in cells expressing wild type cyclin A (Fig. 4f) consistent with previous data showing that the destabilization of k-MT restores faithful chromosome segregation to chromosomally unstable cancer cells2.
Figure 4. Cyclin A promotes faithful chromosome segregation.

a, Immunofluorescence of endogenous cyclin A, tubulin, centromeres (ACA) and DNA of U2OS cells in prometaphase, metaphase, and anaphase. Scale bar, 5 μm. b, fluorescence intensities of U2OS cells stained for cyclin A; n = 150 cells per condition from three independent experiments. c, k-MT half-life of untreated (control) and cyclin A WT overexpressing (CycA WT OX) U2OS cells; n = 10 cells per condition. d, immunofluorescence of endogenous cyclin A, tubulin, centromeres (ACA) and DNA of control or Cyclin A WT overexpressing (CycA WT OX) U2OS cells. Scale bar, 5 μm. e, fluorescence intensities of cyclin A of control U2OS cells or cells expressing cyclin A WT. f, number of anaphases in U2OS cells with lagging chromosomes; n=150 for control cells and 37 for cyclin A WT cells. g, Cells enter prometaphase with high cyclin A and cyclin B. The proteosome-dependent reduction of cyclin A levels below a critical threshold induces a coordinated increase in k-MT attachment stability at the prometaphase to metaphase transition. Graphs show mean ± s.e.m. *P ≤ 0.01, two-tailed t-test.
The stability of k-MT attachments must fall within a narrow permissible range to both satisfy the spindle assembly checkpoint and promote faithful chromosome segregation2,20,21. Our data shows that initial k-MT attachments in prometaphase are unstable, yet sufficiently robust to promote chromosome alignment. By maintaining unstable k-MT attachments on bi-oriented chromosomes in prometaphase the system exploits the back-to-back geometry of sister kinetochores22,23 to create optimal conditions for error correction needed to promote faithful chromosome segregation. The coordinated and decisive switch in k-MT stability that we show at the prometaphase to metaphase transition resembles the decisive switch in k-MT stability previously described during the metaphase to anaphase transition10 (Fig. 4g). These switches in k-MT attachment stability occur as cyclin proteins drop below threshold levels, with the prometaphase to metaphase transition being regulated by cyclin A and the metaphase to anaphase transition being regulated by cyclin B24,25. Unlike cyclin B, there is no established feedback mechanism to prevent cyclin A destruction in the absence of k-MT attachment19. This indicates that cyclin A functions as a timer in prometaphase to ensure efficient error correction, consistent with previous data showing a linear relationship between the duration of prometaphase and the level of cyclin A12. These data define prometaphase and metaphase as biochemically distinct cellular states and show that the prometaphase to metaphase transition is a decisive, unidirectional biochemical event like other phase transitions in the cell cycle26,27,28.
Methods
Cell culture
RPE-1 (ATCC, CRL-4000), PA-RPE1 (ATCC, CRL-4000), U2OS (ATCC, HTB-96), PA-U2OS(ATCC, HTB-96) cells, and PA-PtK1 (ATCC, CCL-35) were grown in Dulbecco’s modified Eagle’s medium, (DMEM; Invitrogen) supplemented with 10% fetal bovine serum (Mediatech), 50 IU/ml penicillin 50ug/ml streptomycin (Mediatech) at 37°C in a humidified atmosphere with 5% CO2. All cell lines are validated as mycoplasma free. Media for cells expressing PA-GFP-tubulin was supplemented with G418 (Mediatech). Cells were incubated with 150μg/mL of Nocodazole (Millipore) for 12 hours and then either released into 5uM MG132 and analyzed through live cell imaging, or collected through mitotic shake-off and prepared for immunoblots. Cells were incubated with 100μM monastrol (TOCRIS Bioscience) for 1 hour or 6 hours and then either analyzed through live cell imaging, prepared for immunofluorescence or released into DMEM or 40 minutes and prepared for immunofluorescence.
Cell transfection
Plasmid transfections were done with FuGENE 6 (Roche Diagnostics), and cells analyzed 12 hours later by live cell imaging, immunofluorescence, or preparation for immunoblots. siRNA transfections were conducted using Oligofectamine (Invitrogen), and cells analyzed 48 hours later. RNA duplexes for Cyclin A2 (CTATGGACATGTCAATTGT) and Nuf2 (5′-GCAUGCCGUGAAACGUAUA) were purchased from Applied Biotechnologies.
Antibodies
Antibodies used for this study were: ACA (CREST; Geisel School of Medicine, Dartmouth College, Hanover NH), actin (Seven Hills Bioreagents, LMAB-C4), astrin13, aurora B (Novus Biologicals, NB100-294), BubR1 (Abcam, ab4637), Hec1 (Novus Biologicals, NB100-338), pHec1 (provided by Jennifer DeLuca), cyclin A (Santa Cruz Antibodies, sc-751), tubulin (Sigma-Aldrich, T9026), pH3 (Cell Signaling Technologies, 3377S), and γH2AX (Novus Biologicals, NB100-384). Secondary antibodies were conjugated to fluorescein isothyocyante (FITC) (Jackson ImmunoResearch, anti-mouse: 715-096-151, anti-rabbit: 111-005-003), Texas Red (Jackson ImmuunoResearch anti-mouse: 715-076-020, anti-rabbit: 111-605-045), Cy5 (Invitrogen, anti-human: A-11013), and HRP (Jackson ImmunoResearch, anti-mouse: 715-036-151, anti-rabbit: 211-002-171). Immunoblots were detected using Lumiglow (KPL).
Photoactivation
Images were acquired using Quorum WaveFX-X1 spinning disk confocal system (Quorum Technologies Inc., Guelph, Canada) equipped with Mosaic digital mirror for photoactivation (Andor Technology, South Windsor, Connecticut) and Hamamatsu ImageEM camera (Bridgewater, New Jersey). Differential interference contract (DIC) microscopy was used to identify prometaphase and metaphase cells with bipolar spindles. Microtubules were locally activated in one half spindle. Fluorescence images were captured every 15s for 4min with a 100X oil-immersion 1.4 numerical aperture objective. For measurement of unstable MTs, fluorescence images were captured every 5s for 1min. DIC microscopy was then used to verify that a bipolar spindle was maintained throughout image acquisition and that cells had not entered anaphase.
For double photoactivation experiments, prometaphase cells were identified using DIC. Microtubules were locally activated in one half spindle, and DIC was then used to verify that the cell was still in prometaphase. After which, microtubules were again locally activated in either prometaphase or metaphase (identified through DIC). Using DIC cells were observed continuing through anaphase to ensure cell survival.
To quantify fluorescence dissipation after photoactivation, pixel intensities were measured within a 1μm rectangular area surrounding the region of highest fluorescence intensity and background subtracted using an equal area from the non-activated half spindle. The values were corrected for photobleaching by treating cells with 10μM Taxol and determining the percentage of fluorescence loss during 4mins of image acquisition after photoactivation. Fluorescence values were normalized to the first time-point after photoactivation for each cell and the average intensity at each time point was fit to a double exponential curve A1 × exp(−k1t)+A2 × exp(−k2t) using MatLab (Mathworks) where A1 represents the less stable non kinetochore microtubule population and A2 the more stable kinetochore-microtubule population with decay rates of k1 and k2, respectively. The turnover half-life for each process was calculated as ln2/k for each population of microtubules.
Immunofluorescence Microscopy
Cells were fixed with 3.5% paraformaldehyde for 15 minutes, washed with Tris-buffered saline with 5% bovine serum albumin (TBS-BSA) and 0.5% Triton X-100 for 5 minutes, and TBS-BSA for 5 minutes. Antibodies were diluted in TBS-BSA + 0.1% Triton X-100 and coverslips incubated for 12 hours at 4°C. After which, cells were washed with TBS-BSA for 5 minutes with shaking. Secondary antibodies were diluted in TBS-BSA + 0.1% Triton X-100 and coverslips incubated for 1 hour at room temperature. For pHec1, all wash buffers were supplemented with 80nM okadaic Acid and 40nM microcystin. Images were acquired with Orca-ER Hamamatsu cooled CCD camera mounted on an Eclipse TE 2000-E Nikon microscope. 0.2μm optical sections in the z-axis were collected with a plan Apo 60X 1.4 NA oil immersion objective at room temperature. Iterative restoration was performed using Phylum Live software (Improvision). Anaphase chromatids were counted as lagging if they contained centromere staining (using CREST antibody) in the spindle midzone separated from centromeres at the poles. The scoring of lagging chromosomes in anaphase was performed blinded. The investigator was not aware of which sample they were counting until all samples were completed and subsequently unblended.
For quantitative assessments, cells were fixed and stained for AuroraB/pHec1, CREST and DNA. Pixel intensities for CREST and AuroraB/pHec1 staining were measured in approximately 15 regions over the entire cell. Background fluorescence was subtracted and the ratio of intensities were calculated and averaged over multiple kinetochores from multiple mitotic cells (n ≥ 10 cells). To quantify DNA condensation, DAPI fluorescence was measured in approximately 5 regions over the entire cell. Background fluorescence was subtracted, and the ration was averaged over multiple cells (n ≥ 10 cells per condition).
Measurements of intercentromere distances were made with Huygens Essential software. All measurements were performed for three independent experiments. Error bars represent standard errors (SEM). The Student’s t-test was used to calculate the significance of differences between samples.
For endogenous cyclin A staining and quantification, Cells were fixed with PBS with 3.5% Paraformaldehyde and 2% sucrose for 10 minutes. After which, cells were permeabilized with ice-cold methanol for 5 minutes and subsequently washed with 500mM Ammonium Chloride in PBS for 20 minutes twice. Cells were then incubated with PBS with 2% donkey serum for 1 hour. After which, cells were incubated with primary and secondary. Quantification of cyclin A levels were done using ImageJ (National Institute of Health). The cytoplasm of a G1 cell (identified by the lack of cyclin A in the nucleus) was used to measure fluorescence intensity and was then used for background subtraction.
Statistical Analysis
For photoactivation, no fewer than 10 cells were used for each condition, which is sufficient to detect significant differences when the effect size is 2-fold or more. For scoring lagging chromosomes and measuring differences in fluorescence intensity, no fewer than 20 cells per condition, which is sufficient to detect significant differences between samples. Data analysis was performed blind. The investigator was not aware of which sample they were counting until all samples were completed and subsequently unblinded. All data had a normal distribution, with similar variance between all conditions tested. Two-tailed t-test were conducted where indicated in the figure legends.
Supplementary Material
Unstable (dotted lines) and stable (solid lines) k-MT depict the differences in the chromosome autonomous and coordinated models of regulating k-MT attachment stability.
Relative Fluorescence (RF) is calculated by subtracting fluorescence of an equal size region on the non-photoactivated half-spindle (background) from the fluorescence intensity of the photoactivated half-spindle (Fluorescence). Bleaching coefficient is determined for each time point using taxol-treated cells. Normalized Relative Fluorescence is then calculated by multiplying the RF of individual timepoints by the bleaching coefficient, divided by the RF of the first photoactivated timepoint (RFPA). The data fits into a double exponential curve.
a, box and whisker plots of fluorescence intensity of PA-GFP tubulin after photoactivation. b, Percentage of MTs in the stable population (e.g. k-MTs) calculated from the exponential decay curve of photoactivated fluorescence (r2 > 0.99); n= 40 cells for RPE-1 and U2OS, and 20 cells for PTK1 per condition.
a, DIC and time-lapse fluorescence images of an individual U2OS cell in prometaphase (top) and metaphase (bottom). Scale bar, 5 μm. b, fluorescence intensity linescan of spindles shown in a.
a, DIC and time-lapse fluorescence images of an individual U2OS cell in prometaphase and then in metaphase. Scale bar, 5 μm. b, k-MT half-life of individual U2OS cells photoactivated serially in prometaphase (left) or in prometaphase and then again in metaphase (right). c, Percentage of MTs in the stable population (e.g. k-MTs) calculated from the exponential decay curve of serially photoactivated prometaphase fluorescence (r2 > 0.99).
a, Western blots of cyclin A overexpressing (left) and cyclin A depleted (right) U2OS cells compared to control. b, cyclin A ΔD mCherry fluorescence intensity and respective k-MT half-life of U2OS cells photoactivated in prometaphase (top) and metaphase (bottom). Linear fit with r2 value. c, Normalized fluorescence over time after photoactivation of untreated U2OS (control), U2OS cells overexpressing cyclin A ΔD mCherry (CycA ΔD OX) and depleted of cyclin A (CycA KD); n = 13 cells for control and 10 cells for (CycA ΔD OX) and (CycA KD) per condition.
Immunofluorescence of prometaphase and metaphase untreated U2OS (control) and cyclin A ΔD overexpressing U2OS cells (CycA ΔD OX). a, Fluorescence intensities of centromeres stained for Aurora B in U2OS cells normalized using CREST in both prometaphase and metaphase. b, Fluorescence intensities of centromeres stained for phosphor-Hec1 in U2OS cells normalized using CREST in both prometaphase and metaphase. c, Immunofluorescence of untreated metaphase U2OS (control), U2OS cells overexpressing cyclin A ΔD mCherry (CycA ΔD OX) and depleted of cyclin A (CycA KD). Scale bar, 5 μm. Graphs show mean ± s.e.m from 20 cells per condition from three independent experiments. *P ≤ 0.01, two-tailed t-test. d, Localization of BubR1 in prometaphase and metaphase cells with (CycA ΔD OX) and without (control) expression of cyclin A ΔD. e, Localization of astrin in metaphase cells with (CycA ΔD OX) and without (control) expression of cyclin A ΔD; n = 30 cells per condition from three independent experiments. Scale bar, 5 μm. f, Intercentromere distances of untreated and cyclin A ΔD overexpressing U2OS cells; n = 30 cells per condition from three independent experiments. Graphs show mean ± s.e.m. *P ≤ 0.01, two-tailed t-test.
a, MT half-life of untreated (control), cyclin A overexpressing (CycA ΔD OX), and cyclin A depleted (CycA KD) of prometaphase and metaphase U2OS cells measured at 5s intervals for 1 minute; n = 10 cells per condition. b, Western blots of Nuf2-depleted (left) and Nuf2- and cyclin A-depleted (right) U2OS cells compared to control U2OS cells. c, MT half-life of Nuf2 depleted and Nuf2 and CycA depleted U2OS cells; n = 10 cells per condition. Graphs show mean ± s.e.m.
Linescan analysis measuring fluorescence intensity of metaphase spindles in untreated (control) and cyclin A overexpression (CycA ΔD OX) in PA-GFP tubulin expressing U2OS.
Immunofluorescence of untreated metaphase U2OS (control), U2OS cells overexpressing cyclin A ΔD mCherry (CycA ΔD OX) and depleted of cyclin A (CycA KD). Scale bar, 5 μm. b, Fluorescence intensities of DNA stained with DAPI in U2OS cells in both prometaphase and metaphase. Scale bar, 5 μm; n = 60 cells per condition from three independent experiments. Graphs show mean ± s.e.m.
Acknowledgments
This work was supported by National Institutes of Health grants GM51542 (D.A.C) and GM008704 (L.K.) and the John H. Copenhaver Jr. and William H. Thomas, MD 1952 Junior Fellowship (L.K.). We thank Jonathan Pines and Jennifer DeLuca for providing reagents.
Abbreviations
- k-MT
kinetochore-microtubule
Footnotes
Supplementary Information is linked to the online version of the paper at www.nature.com/nature
Author Contributions
LK and DAC were responsible for exeperimental design, data interpretation, and writing the manuscript. LK conducted the experiments.
Reprints and permissions information is available at www.nature.com/reprints
The authors declare no competing financial interests.
References
- 1.Cimini D, Moree B, Canman JC, Salmon ED. Merotelic kinetochore orientation occurs frequently during early mitosis in mammalian tissue cells and error correction is achieved by two different mechanisms. J Cell Sci. 2003;116:4213–4255. doi: 10.1242/jcs.00716. [DOI] [PubMed] [Google Scholar]
- 2.Bakhoum SF, Thompson SL, Manning A, Compton DA. Genome stability is ensured by temporal control of kinetochore-microtubule dynamics. Nature Cell Biol. 2009;11:27–35. doi: 10.1038/ncb1809. [DOI] [PMC free article] [PubMed] [Google Scholar]
- 3.Lengauer C, Kinzler KW, Vogelstein B. Genetic instabilitites in human cancers. Nature. 1998;396:643–649. doi: 10.1038/25292. [DOI] [PubMed] [Google Scholar]
- 4.Thompson SL, Compton DA. Examining the link between chromosomal instability and aneuploidy in human cells. J Cell Biol. 2008;180:665–672. doi: 10.1083/jcb.200712029. [DOI] [PMC free article] [PubMed] [Google Scholar]
- 5.Cimini D, Howell BJ, Maddox P, Kodjakov A, Degrassi F, Salmon ED. Merotelic kinetochore orientation is a major mechanism of aneuploidy in mitotic mammalian tissue cells. J Cell Biol. 2001;153:517–528. doi: 10.1083/jcb.153.3.517. [DOI] [PMC free article] [PubMed] [Google Scholar]
- 6.Bakhoum SF, Genovese G, Compton DA. Deviant kinetochore microtubule dynamics underlie chromosomal instability. Curr Biol. 2009;22:1937–1942. doi: 10.1016/j.cub.2009.09.055. [DOI] [PMC free article] [PubMed] [Google Scholar]
- 7.Thompson SL, Compton DA. Chromosome missegregation in human cells arises through specific types of kinetochore-microtubule attachment errors. Proc Natl Acad Sci. 2011;108:17974–17978. doi: 10.1073/pnas.1109720108. [DOI] [PMC free article] [PubMed] [Google Scholar]
- 8.Liu D, Vader G, Vromas MJ, Lampson MA, Lens SM. Sensing chromosome bi-orientation by spatial separation of aurora B kinase from kinetochore substrates. Science. 2009;323:1350–1353. doi: 10.1126/science.1167000. [DOI] [PMC free article] [PubMed] [Google Scholar]
- 9.Nicklas RB, Ward SC. Elements of error correction in mitosis: microtubule capture, release, and tension. J Cell Biol. 1994;126:1241–1253. doi: 10.1083/jcb.126.5.1241. [DOI] [PMC free article] [PubMed] [Google Scholar]
- 10.Zhai Y, Kronebusch PJ, Borisy GG. Kinetochore microtubule dynamics and the metaphase-anaphase transition. J Cell Biol. 1995;131:721–734. doi: 10.1083/jcb.131.3.721. [DOI] [PMC free article] [PubMed] [Google Scholar]
- 11.Pines J. Mitosis: a matter of getting rid of the right protein at the right time. Trends in Cell Biol. 2006;16:55–63. doi: 10.1016/j.tcb.2005.11.006. [DOI] [PubMed] [Google Scholar]
- 12.den Elzen N, Pines J. Cyclin A is destroyed in prometaphase and can delay chromosome alignment and anaphase. J Cell Biol. 2001;153:121–136. doi: 10.1083/jcb.153.1.121. [DOI] [PMC free article] [PubMed] [Google Scholar]
- 13.Skoudias DA, Andreassen PR, Lacroix FB, Wilson L, Margolis RL. Mammalian mad2 and bub1/bubr1 recognize distinct spindle-attachment and kinetochore-tension checkpoints. PNAS. 2001;98:4492–4497. doi: 10.1073/pnas.081076898. [DOI] [PMC free article] [PubMed] [Google Scholar]
- 14.Manning AL, Bakhoum SF, Maffini S, Correia-Melo C, Maiato H, Compton DA. CLASP1, astrin and Kif2b form a molecular switch that regulates kinetochore-microtubule dynamics to promote mitotic progression and fidelity. EMBO J. 2010;29:3531–3543. doi: 10.1038/emboj.2010.230. [DOI] [PMC free article] [PubMed] [Google Scholar]
- 15.Kelly AE, Funabiki H. Correcting aberrant kinetochore microtubule attachments: an Aurora B-centric view. Curr Opinion Cell Biol. 2009;21:51–58. doi: 10.1016/j.ceb.2009.01.004. [DOI] [PMC free article] [PubMed] [Google Scholar]
- 16.DeLuca K, Lens SM, DeLuca JG. Temporal changes in Hec1 phosphorylation control kinetochore-microtubule attachment stability during mitosis. J Cell Sci. 2011;124:622–634. doi: 10.1242/jcs.072629. [DOI] [PMC free article] [PubMed] [Google Scholar]
- 17.Gong D, Ferrell JE. The roles of cyclin A2, B1, and B2 in early and late mitotic events. Mol Biol Cell. 2010;21:3149–3161. doi: 10.1091/mbc.E10-05-0393. [DOI] [PMC free article] [PubMed] [Google Scholar]
- 18.Mihaylov IS, Kondo T, Jones L, Ryzhikov S, Tanaka J, Zheng J, Higa LA, Minamino N, Cooley L, Zhang H. Control of DNA replication and chromosome ploidy by Germinin and Cyclin A. Mol Cell Biol. 2002;22:1868–1880. doi: 10.1128/MCB.22.6.1868-1880.2002. [DOI] [PMC free article] [PubMed] [Google Scholar]
- 19.Di Fiore B, Pines J. How cyclin A destruction escapes the spindle assembly checkpoint. J Cell Biol. 2010;190:501–509. doi: 10.1083/jcb.201001083. [DOI] [PMC free article] [PubMed] [Google Scholar]
- 20.Musacchio A, Salmon ED. The spindle-assembly checkpoint in space and time. Nat Rev Mol Cell Biol. 2007;8:379–383. doi: 10.1038/nrm2163. [DOI] [PubMed] [Google Scholar]
- 21.Bakhoum SF, Compton DA. Kinetochore and disease: keeping microtubule dynamics in check! Curr Opin Cell Biol. 2012;24 doi: 10.1016/j.ceb.2011.11.012. [DOI] [PMC free article] [PubMed] [Google Scholar]
- 22.Indjeian VB, Murray AW. Budding yeast mitotic chromosomes have an intrinsic bias to biorient on the spindle. Curr Biol. 2007;21:1837–46. doi: 10.1016/j.cub.2007.09.056. [DOI] [PubMed] [Google Scholar]
- 23.Loncarek J, Kisurina-Evgenieva O, Vinogradova T, Hergert P, La Terra S, Kapoor TM, Khodjakov A. The centromere geometry essential for keeping mitosis error free is controlled by spindle forces. Nature. 2007;7170:745–9. doi: 10.1038/nature06344. [DOI] [PMC free article] [PubMed] [Google Scholar]
- 24.Holloway SK, Glotzer M, King RW, Myrray AW. Anaphase is initiated by proteolysis rather than by the inactivation of maturation-promoting factor. Cell. 1993;73:1393–1402. doi: 10.1016/0092-8674(93)90364-v. [DOI] [PubMed] [Google Scholar]
- 25.Surana U, et al. Destruction of the CDC28/CLB mitotic kinase is not required for the metaphase to anaphase transition in budding yeast. EMBO J. 1993;12:1969–1978. doi: 10.1002/j.1460-2075.1993.tb05846.x. [DOI] [PMC free article] [PubMed] [Google Scholar]
- 26.Pagiluca FW, Collins MO, Lichawska A, Zegerman P, Choudhary JS, Pines J. Quantitiative proteonomics reveals the basis for biochemical specificity of cell-cycle machinery. Molecular Cell. 2011;43:406–417. doi: 10.1016/j.molcel.2011.05.031. [DOI] [PMC free article] [PubMed] [Google Scholar]
- 27.Reed SI. Ratchets and clocks: the cell cycle, ubiquitylation and protein turnover. Nature Rev Mol Cell Biol. 2003;4:855–864. doi: 10.1038/nrm1246. [DOI] [PubMed] [Google Scholar]
- 28.Trunnell NB, Poon AC, Kim SY, Ferrell JE. Ultrasensitivity in the regulation of Cdc25 and Cdk1. Mol Cell. 2011;41:263–274. doi: 10.1016/j.molcel.2011.01.012. [DOI] [PMC free article] [PubMed] [Google Scholar]
Associated Data
This section collects any data citations, data availability statements, or supplementary materials included in this article.
Supplementary Materials
Unstable (dotted lines) and stable (solid lines) k-MT depict the differences in the chromosome autonomous and coordinated models of regulating k-MT attachment stability.
Relative Fluorescence (RF) is calculated by subtracting fluorescence of an equal size region on the non-photoactivated half-spindle (background) from the fluorescence intensity of the photoactivated half-spindle (Fluorescence). Bleaching coefficient is determined for each time point using taxol-treated cells. Normalized Relative Fluorescence is then calculated by multiplying the RF of individual timepoints by the bleaching coefficient, divided by the RF of the first photoactivated timepoint (RFPA). The data fits into a double exponential curve.
a, box and whisker plots of fluorescence intensity of PA-GFP tubulin after photoactivation. b, Percentage of MTs in the stable population (e.g. k-MTs) calculated from the exponential decay curve of photoactivated fluorescence (r2 > 0.99); n= 40 cells for RPE-1 and U2OS, and 20 cells for PTK1 per condition.
a, DIC and time-lapse fluorescence images of an individual U2OS cell in prometaphase (top) and metaphase (bottom). Scale bar, 5 μm. b, fluorescence intensity linescan of spindles shown in a.
a, DIC and time-lapse fluorescence images of an individual U2OS cell in prometaphase and then in metaphase. Scale bar, 5 μm. b, k-MT half-life of individual U2OS cells photoactivated serially in prometaphase (left) or in prometaphase and then again in metaphase (right). c, Percentage of MTs in the stable population (e.g. k-MTs) calculated from the exponential decay curve of serially photoactivated prometaphase fluorescence (r2 > 0.99).
a, Western blots of cyclin A overexpressing (left) and cyclin A depleted (right) U2OS cells compared to control. b, cyclin A ΔD mCherry fluorescence intensity and respective k-MT half-life of U2OS cells photoactivated in prometaphase (top) and metaphase (bottom). Linear fit with r2 value. c, Normalized fluorescence over time after photoactivation of untreated U2OS (control), U2OS cells overexpressing cyclin A ΔD mCherry (CycA ΔD OX) and depleted of cyclin A (CycA KD); n = 13 cells for control and 10 cells for (CycA ΔD OX) and (CycA KD) per condition.
Immunofluorescence of prometaphase and metaphase untreated U2OS (control) and cyclin A ΔD overexpressing U2OS cells (CycA ΔD OX). a, Fluorescence intensities of centromeres stained for Aurora B in U2OS cells normalized using CREST in both prometaphase and metaphase. b, Fluorescence intensities of centromeres stained for phosphor-Hec1 in U2OS cells normalized using CREST in both prometaphase and metaphase. c, Immunofluorescence of untreated metaphase U2OS (control), U2OS cells overexpressing cyclin A ΔD mCherry (CycA ΔD OX) and depleted of cyclin A (CycA KD). Scale bar, 5 μm. Graphs show mean ± s.e.m from 20 cells per condition from three independent experiments. *P ≤ 0.01, two-tailed t-test. d, Localization of BubR1 in prometaphase and metaphase cells with (CycA ΔD OX) and without (control) expression of cyclin A ΔD. e, Localization of astrin in metaphase cells with (CycA ΔD OX) and without (control) expression of cyclin A ΔD; n = 30 cells per condition from three independent experiments. Scale bar, 5 μm. f, Intercentromere distances of untreated and cyclin A ΔD overexpressing U2OS cells; n = 30 cells per condition from three independent experiments. Graphs show mean ± s.e.m. *P ≤ 0.01, two-tailed t-test.
a, MT half-life of untreated (control), cyclin A overexpressing (CycA ΔD OX), and cyclin A depleted (CycA KD) of prometaphase and metaphase U2OS cells measured at 5s intervals for 1 minute; n = 10 cells per condition. b, Western blots of Nuf2-depleted (left) and Nuf2- and cyclin A-depleted (right) U2OS cells compared to control U2OS cells. c, MT half-life of Nuf2 depleted and Nuf2 and CycA depleted U2OS cells; n = 10 cells per condition. Graphs show mean ± s.e.m.
Linescan analysis measuring fluorescence intensity of metaphase spindles in untreated (control) and cyclin A overexpression (CycA ΔD OX) in PA-GFP tubulin expressing U2OS.
Immunofluorescence of untreated metaphase U2OS (control), U2OS cells overexpressing cyclin A ΔD mCherry (CycA ΔD OX) and depleted of cyclin A (CycA KD). Scale bar, 5 μm. b, Fluorescence intensities of DNA stained with DAPI in U2OS cells in both prometaphase and metaphase. Scale bar, 5 μm; n = 60 cells per condition from three independent experiments. Graphs show mean ± s.e.m.