

Abstract
We present methods for linkage and association mapping of quantitative traits for a founder population with a large, known genealogy. We detect linkage to quantitative-trait loci (QTLs) through a multipoint homozygosity-mapping method. We propose two association methods, one of which is single point and uses a general two-allele model and the other of which is multipoint and uses homozygosity by descent for a particular allele. In all three methods, we make extensive use of the pedigree and genotype information, while keeping the computations simple and efficient. To assess significance, we have developed a permutation-based test that takes into account the covariance structure due to relatedness of individuals and can be used to determine empirical genomewide and locus-specific P values. In the case of multivariate-normally distributed trait data, the permutation-based test is asymptotically exact. The test is broadly applicable to a variety of mapping methods that fall within the class of linear statistical models (e.g., variance-component methods), under the assumption of random ascertainment with respect to the phenotype. For obtaining genomewide P values, our proposed method is appropriate when positions of markers are independent of the observed linkage signal, under the null hypothesis. We apply our methods to a genome screen for fasting insulin level in the Hutterites. We detect significant genomewide linkage on chromosome 19 and suggestive evidence of QTLs on chromosomes 1 and 16.
Introduction
Although there have recently been a few exceptions (e.g., Horikawa et al. 2000; Hugot et al. 2001; Tavtigian et al. 2001), most attempts to map complex genetic traits in humans have had limited success. The difficulties stem, in part, from genetic heterogeneity, trait-influencing alleles of small effect, and the confounding effects of environmental components. These factors have led some (Lander and Schork 1994; Wright et al. 1999; Shifman and Darvasi 2001) to suggest that isolated founder populations may be efficacious for complex-trait mapping, although there has been some recent debate about this issue (Boehnke 2000; Eaves et al. 2000; Taillon-Miller et al. 2000). The focus of these discussions has been primarily on linkage-disequilibrium (LD)–mapping methods, but the possible advantages of these populations are present for linkage studies as well. Most current methods, however, have been designed for use primarily in heterogeneous, outbred populations, with attendant study designs, and may not exploit the advantageous characteristics of isolated, founder populations, particularly ones with a large, known pedigree. Here, we present methods, for linkage and LD mapping for quantitative traits, that capitalize on these advantages and address the difficulties associated with complex, inbred genealogies. Furthermore, we propose a novel permutation-based test that is simple, yet can provide empirical, asymptotically exact, genomewide P values for all loci in an initial genome screen, when used with multivariate-normal phenotype data collected on individuals from a complex, inbred pedigree.
Founder populations with large, known pedigrees both present potential advantages and pose computational challenges for linkage and LD mapping (Ober and Cox 1998). Because linkage mapping relies on establishing an association between the trait and the inheritance pattern deduced from genotypes, the ability to calculate identity-by-descent (IBD) information for the observed alleles is crucial. Exact multipoint calculations, however, are limited to moderate-sized pedigrees, in spite of recent advances in efficiency (Kruglyak and Lander 1998; Gudbjartsson et al. 2000; Markianos et al. 2001). Instead, approximate methods, such as correlation-based (Almasy and Blangero 1998) or Markov-chain Monte Carlo (Thompson and Heath 1999) algorithms, have proven very useful. However, in extremely large and complex pedigrees, these methods are computationally challenging as well, especially in the context of genome screens. Another, computationally simpler, option is to ignore portions of the genealogy and treat the resultant pedigrees—or individuals, in the case of LD mapping—as independent. However, this can reduce the power to detect linkage (Dyer et al. 2001) and, particularly in the case of LD mapping, increase the false-positive rate (Newman et al. 2001).
We take a hybrid approach of trying to use as much of the pedigree information as we can, while keeping the computations simple and rapid enough to use for a genome screen. We have developed methods for linkage and association mapping of quantitative-trait loci (QTLs) in complex, inbred pedigrees in which we make extensive use of the pedigree information to try to take into account the relatedness of the individuals. The linkage method we present is a homozygosity-mapping method, which relies on the existence of regions that are homozygous by descent (HBD) in inbred individuals, to detect QTLs that act recessively. We use a given individual’s multilocus genotype information and the complete pedigree information to estimate the individual’s conditional probability of HBD at arbitrary loci in the genome, via a hidden Markov model (HMM) method. The first of our association-mapping methods uses an extension of our HBD calculation to determine the probability of an individual being HBD for specific marker alleles, and it tests for association of the marker alleles with deviations from the mean of the quantitative trait. In addition, we use a single-point method to detect association under a general two-allele model (GTAM) (of which additive, dominant, and recessive are all special cases). In all methods, the effect of an allele or locus is represented as a main effect, rather than as a variance component, in a linear model, which should provide us with increased power and robustness to nonnormality (Lehmann 1986, sec. 5.4). Influences due to the polygenic background are taken into account by means of additive and dominance variance components.
Each of the three mapping methods that we develop produces a test statistic for which significance must be assessed. For linkage tests, when complete IBD information is assumed, it is, in principle, possible to perform straightforward simulation to assess either locus-specific or genomewide significance in arbitrary pedigrees. However, for association tests or for linkage tests with incomplete IBD information, the situation is far from straightforward. In some cases, when the sampling distribution of the test statistic is known or can be approximated, one can use this distribution to assess locus-specific P values. Then, to assess genomewide significance for linkage, researchers have typically used locus-specific significance thresholds suggested by Lander and Kruglyak (1995), although these thresholds were calculated for very specific types of study designs. There is no reason to expect such thresholds to be relevant to data from a single large pedigree or a few large pedigrees, as is the case we consider. For a linkage test with incomplete IBD information, one could assess locus-specific and genomewide significance by simulation under the assumption of complete IBD information. However, this is time consuming, would typically be overly conservative, and is not sufficient to assess significance for association studies. The use of a chromosome-dropping simulation approach to assess significance for linkage studies under incomplete IBD information or for association studies is difficult and problematic. For instance, assumptions about founder allele and haplotype frequencies are needed. Furthermore, when one drops chromosomes down a large, complex pedigree, such as the Hutterites, marker characteristics (e.g., frequency spectrum and informativeness) tend to differ noticeably between the bottom of the pedigree and the top, with rare alleles often lost by drift. Because marker characteristics are assumed to be ancillary, it is desirable to condition on them. However, it is usually not clear on what characteristics one should condition, and even if it were clear, it would generally be a difficult technical challenge to design a simulation that did condition on them.
Recent proposals for alternative methods that identify genomewide significant markers include a sequential analysis approach (Province 2000) and a confidence-set approach (Lin et al. 2001). The procedure of Province (2000) requires many independent sampling units (e.g., sib pairs or pedigrees), and it is not clear how one could apply this method to the case of a single large pedigree or a few large pedigrees. The confidence-set approach of Lin et al. (2001) requires that the mapping method be able to yield a hypothesis test of the form H0:θ⩽θ0 versus Ha:θ>θ0, where θ is the recombination fraction between the locus being tested and the trait locus, and 0<θ0<1/2 is some fixed value. In the mapping methods that we propose, θ is confounded with the effect size of the trait locus, so the method of Lin et al. (2001) is not applicable.
Instead, we assess empirical genomewide significance for each locus using a novel permutation-based test. Determining significance by means of a permutation test has been done for QTLs in experimental populations (Churchill and Doerge 1994), the Haseman-Elston method with sib pairs (Wan et al. 1997), and an association test for QTLs in nuclear families (Abecasis et al. 2000). A difficulty with permutation tests in general family structures is the lack of exchangeability that results from correlations due to familial relatedness and the estimation of covariates. Iturria et al. (1999) proposed a permutation-type test that attempts to approximately maintain the familial correlation structure when mapping QTLs via variance components. Our test is appropriate for the generalized multiple regression problem for which, although there are approximate tests, there is, in general, no exact test (Anderson and Robinson 2001). The test we propose here is exact when the distribution of the phenotype data is multivariate normal with a known covariance matrix and precisely preserves the correlation structure in that case.
In the “Methods” section, we first describe our likelihood model and derive the efficient score statistic for detection of linkage. We then demonstrate how the HMM is used to approximate the probabilities of HBD, which are subsequently used for homozygosity mapping. The LD-mapping methods are described, and we show that all the methods can be placed within the framework of a generalized regression problem. The “Methods” section concludes with a derivation of the permutation-based test. In the “Results” section, we demonstrate the utility of our methods by analyzing fasting insulin level in the Hutterites.
Methods
Below, we detail the statistical development of our mapping methods. In the “Genetic Model for Linkage Detection by Homozygosity Mapping” subsection, we describe our mathematical model for a trait that is influenced by a recessive-acting QTL. That is, we consider a collection of individuals where the phenotype of the kth individual, yk, is determined by a set of covariates (e.g., age and sex), the genetic effect of being HBD at the QTL, and the effects of (possibly) many other loci (i.e., a polygenic background). Because the individuals are, in general, related, we account for correlation in the polygenic background through a covariance matrix. We assume the trait has a multivariate-normal distribution, allowing us to specify a likelihood function. However, because a full maximum-likelihood analysis would be very time consuming, we instead base our inference on the efficient score statistic. We develop this statistic and demonstrate its asymptotic equivalence to the t statistic of generalized linear regression in the “Efficient Score Statistic” subsection. This statistic requires calculation of the probability of each individual being HBD, given the genotype data. Our approximation of this probability is accomplished using an HMM and is fully described in the “Probability of HBD” subsection. The method, which is a test for linkage, can also be reformulated to be a test of association, which, in addition to a single-point test for association under a general genetic model, we describe in the “LD-Mapping Methods” subsection. Finally, we present a new permutation-based test that allows us to calculate empirical locus-specific and genomewide significance. The test hinges on finding a linear transformation that, when applied to the phenotypic residuals, results in independent random variables, in the case of a multivariate-normal phenotype. In the “Assessment of Significance” subsection, we derive this transformation and explain its application to obtain P values.
Genetic Model for Linkage Detection by Homozygosity Mapping
We first consider a genetic model, for linkage mapping, in which having two copies of the same founder allele at a QTL (i.e., being HBD) influences the expected value of the trait. Defining yk as the phenotypic value of the kth individual and y as the vector of phenotype values for the study sample, we consider the model for the quantitative trait as
where X is the matrix of covariate values; β is a vector of fixed effects; 1h is the indicator vector of HBD at the QTL (i.e., the kth element is equal to one if the kth individual is HBD at the QTL and is equal to zero otherwise); γ measures the QTL effect size; g is the random polygenic background effect; and the environmental effects e are assumed to be independent and identically distributed normal (0,σ2e) random variables. The random effects e and g are independent and do not depend on X or 1h. We furthermore assume the distribution of g to be multivariate normal, with mean zero and covariance matrix Ω=2Φσ2a+Δ7σ2d. Here, Φ is the matrix of kinship coefficients, Δ7 is the matrix whose i,jth element is the probability that individual i shares two alleles IBD with j with neither individual being autozygous, and σ2a and σ2d are the additive and dominance variances, respectively. Fisher (1918) suggested this as an approximation to the case of a large number of loci with small genetic effects and additivity across loci, assuming that conditions of a central-limit theorem are met. Some sufficient conditions for a central-limit theorem have been derived by Lange (1978) and extended to include both inbreeding and dominance variance by Abney et al. (2000). The trait models require the assumption of either (a) unlinked QTLs or (b) linked QTLs with the constraint that, on each chromosome, at most one locus has nonzero inbreeding depression.
Efficient Score Statistic
To derive the score statistic to test the null hypothesis of no linkage between a locus and a QTL, we must specify a likelihood model that accurately reflects the ascertainment of the data. Here, we assume the individuals are a random sample of the population and are all related through a known pedigree. That is, they have not been selected for study on the basis of their phenotypes. Given phenotypes and genotypes of these randomly ascertained individuals, we write the joint probability of the data as P(genotype and phenotype data) = P(phenotype data|genotype data)P(genotype data). We assume that P(genotype data) is determined by the inheritance process and depends only on founder haplotype frequencies, not on any genetic model parameters.
Therefore, the genotype data are ancillary, and it is desirable to base inference on the conditional likelihood, given the genotype data. (The same reasoning applies to X, Φ, and Δ7, and so, in what follows, we treat these as fixed.) First, we consider the likelihood when the genotype data are fully informative. That is, we know the complete inheritance information and, hence, the HBD state of every individual. For a known pedigree structure, the conditional log-likelihood for the model specified in equation (1) is
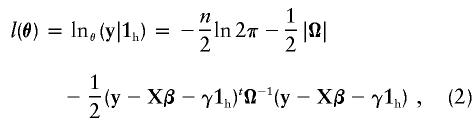 |
where θ=(βt,γ,σ2a,σ2d,σ2e)t is the vector of parameter values and n is the number of individuals in the study sample.
To write the probability of the phenotype data conditional on the observed (i.e., incomplete) genotype data, we form a sum over all 1h. Because the conditional probability of the phenotype data given the indicator of HBD is independent of the observed genotype data, the resulting incomplete data likelihood is
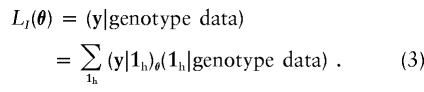 |
The first term in the summand is determined by equation (2). When calculating the score statistic below, we assume θ(1h|genotypedata)=(1h|genotypedata), where θ0 denotes the vector of parameter values under the null model. This is reasonable because there is no phenotype information on either side of the equation.
We wish to devise a test of the null hypothesis (γ=0) versus the alternative hypothesis (γ≠0) at a locus. One possibility would be to maximize the likelihood (eq. [3]) under both the null and the alternative hypotheses and to use the likelihood-ratio test. However, calculating the distribution θ(1h|genotypedata) can be computationally intractable for large pedigrees. Also, when genotyping error is included in the model (see below), the number of terms in the sum in equation (3) grows as 2N, where N is the number of individuals in the study with a nonzero inbreeding coefficient. For large N values, the number of terms in the sum can be computationally overwhelming. Instead, we develop a test that is based on the score statistic (Cox and Hinkley 1974). The score statistic has the property that, under the null hypothesis, it is asymptotically equivalent to the likelihood-ratio statistic and is locally most powerful. That is, it is most powerful for alternatives “close” to the null hypothesis. Furthermore, the statistic depends only on the null parameter values and, thus, does not require estimation of all the parameters under the alternative hypothesis, although these estimates may be of general interest. In defining the score statistic, we write the vector of parameters θ as (γ,ψt)t, where γ is the parameter of interest and ψ=(βt,σ2a,σ2d,σ2e)t is the vector of nuisance parameters. Define  by
by  , the value of the vector of nuisance parameters that maximizes the null likelihood. Writing lI(θ)=lnLI(θ), the score statistic is
  , where
  and Fij is the submatrix of the Fisher information matrix corresponding to vectors i and j (e.g., when β has length k, Fγψ is 1×(k+3) with first k elements given by Fγβi=-Eθ(∂2l/∂γ∂βi),i=1,…,k and so on). Using the form of the likelihood in equation (3), we obtain
  , where
  , h=E(1h|genotypedata) and
  , the estimate of Ω obtained by maximizing the likelihood under the null hypothesis.
A more intuitive understanding arises when we consider the linear model
where Var(ε)=Ψ, W=(Xh) and η=(β γ)t. Now, we restrict  and consider the estimate obtained from generalized linear regression,
  . Taking the last component gives
  . Furthermore, noting that
  gives
gives  . The t statistic would then be calculated as
  , where
  , n is the sample size, and k is the dimension of β. From this, we can see that the score statistic is related to the square of the t statistic by
  . Note that, under the null hypothesis,
  . Thus, the t statistic obtained from generalized regression of the phenotype against the probability of HBD can be considered a version of the efficient score statistic. This t-test formulation provides us with a computationally feasible test that is asymptotically locally most powerful.
Probability of HBD
Our score-statistic approach requires that, at a given locus, we calculate h=E(1h|genotypedata), or, equivalently, the marginal probability that each individual is HBD, given all the genotype data. For moderately sized pedigrees, an exact calculation is feasible using methods based on the Lander-Green-Kruglyak algorithm (Lander and Green 1987; Kruglyak and Lander 1998; Gudbjartsson et al. 2000; Markianos et al. 2001). For large pedigrees, approximate methods must be used. A number of strategies have been used to calculate probabilities of IBD in large pedigrees in which exact calculations are not feasible. One option is to do a “local” calculation where only a subset of the entire genealogy is used, resulting in smaller, and simpler, subpedigrees (Ginns et al. 1998; Ober et al. 2000; Hsueh et al. 2001). Doing so, however, may deprive the method of valuable information regarding the relationships among the individuals, with results dependent on precisely how the subpedigrees were chosen. The use of Markov-chain Monte Carlo methods is another strategy that has been implemented in some cases (Thompson and Heath 1999). These methods can also be very computationally rigorous and pose their own challenges regarding the choice of an effective sampler, ensuring the irreducibility of the Markov chain, and providing favorable convergence properties.
Calculation of h, however, does not require calculation of the conditional probability of IBD sharing states among arbitrary sets of relatives, but rather just the conditional probability of the two alleles of any individual being IBD. Although a simpler problem, it is still a computationally burdensome task to calculate exactly. In approaching the problem, we use the entire pedigree but only a portion of the genotype data. We use the entire pedigree to obtain exact one-locus inbreeding coefficients, and we simulate from the pedigree to obtain two-locus inbreeding coefficients for each individual, where the two-locus inbreeding coefficients can be summarized by the following two functions of genetic distance x: P(HBD at both of two loci separated by distance x) and P(HBD at exactly one of two loci separated by distance x). The one-locus inbreeding coefficients provide an unconditional estimate of the probability of HBD, which is then modified by the multilocus genotype data by use of the two-locus inbreeding coefficients. We restrict our calculations to use only the multilocus genotypes of the single individual for whom we are approximating the conditional probability of HBD at a locus. In fact, for low levels of inbreeding (i.e., parents are distantly related), incorporation of genotype data on additional close relatives is likely to have little impact on the calculation, unless some genotype data are missing for the individual. With highly informative and reasonably dense markers, extended regions of homozygosity are strongly indicative of HBD, regardless of the genotypes of other individuals.
We further simplify the calculations by assuming the binary process representing HBD/non-HBD along an individual’s genome to be Markov. In fact, under the assumption of a Poisson recombination model, the inheritance vector process along the genome is Markov (Donnelly 1983), but collapsing the inheritance vectors into two groups according to whether they result in HBD or not for the individual, does not, in general, give rise to another Markov process. Nevertheless, the Markov approximation provides a good estimate for pedigrees of at least moderate size and complexity (Thompson 1994; McPeek and Sun 2000), with small errors for most cases. Exceptions occur only for those situations whose probability is very small.
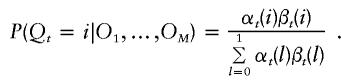
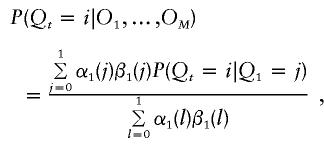
Because the HBD/non-HBD process is unobserved, we use an HMM method to calculate the probability of HBD at a given point, conditional on the individual’s multilocus genotype data. We now summarize the calculation, which implements Baum’s (1972) forward and backward probabilities and is reviewed in Rabiner (1989). Define αk(i)=P(O1,…,Ok,Qk=i) and βk(i)=P(Ok+1,…,OM|Qk=i), where M is the number of genotyped markers, Ok is the observed genotype at the kth marker, Qk is the state of the Markov chain at position k, and i is 0 or 1, representing the Markov states non-HBD or HBD, respectively. The variables α and β are the forward and backward probabilities and are initialized as follows: α1=P(O1|Q1=i)P(Q1=i) and βM(i)=1. The recursion formulas are  and
and  where Tji=P(Qk+1=i|Qk=j) are the transition probabilities. We can now write down the probability of a particular HBD state given all the genotype data for that individual. Let t be a position between markers k and k+1; then
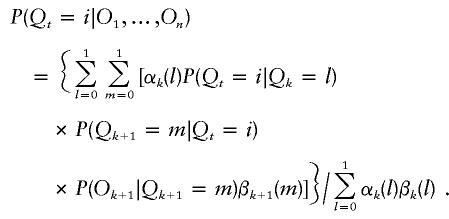 |
If t is at a marker,
 |
For t previous to the first marker,
 |
and similarly for t after the last marker.
To complete the above calculations, we still must determine the Markov-chain transition probabilities Tji=P(Qk+1=i|Qk=j), as well as the conditional observation probabilities P(Ok|Qk=i). Estimated values for Tji as a function of genetic distance can be obtained, through simulation, for each individual, as follows. Given our assumption of a binary, continuous-time Markov chain, the transition probabilities as a function of genetic distance x are given by
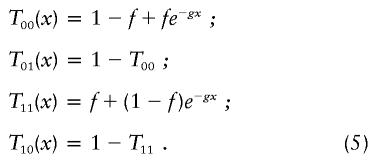 |
Note that the values for f and g will, in general, differ for each individual. Furthermore, in the limit x→∞ in the expression for T11(x) we must end up with the unconditional probability of being in the HBD state; hence, f must be the inbreeding coefficient of the individual. Estimates for g for each individual were obtained by dropping a two-locus chromosome down the pedigree and counting the number of times that both loci were, exactly one was, or neither was HBD. This was done for 100,000 replicates of each distance from 1 to 20 cM in increments of 1 cM with  chosen as the maximum-likelihood estimate of g obtained from the simulated data and the model of equation (5), under the restriction that f equals the inbreeding coefficient for that individual. The estimates of g gave exponential curves for the transition probabilities that matched the simulated data extremely well.
To complete the HMM, we must specify the probability of observing a particular genotype at a marker given the HBD state at that marker, P(Ok|Qk=i). In our model, we allow for genotyping error and mutation by introducing an error parameter ɛ and setting P[Ok=(a,b)|Qk=1]=2ɛpapb if a≠b and (1-ɛ)pa+ɛp2a if a=b, where pa and pb are the allele frequencies and 1 and 0 represent HBD and not HBD, respectively.  is given by the standard Hardy-Weinberg values. When the genotype is missing, we use P(Ok|Qk)=1, which amounts to assuming that the missing value mechanism is independent of Qk.
LD-Mapping Methods
In addition to the linkage test described above, we have also developed two association-based QTL-mapping methods. These LD-mapping methods use the same basic framework as the HBD test and model the effect of an allele, rather than a locus, as a main effect, while accounting for the relationships among the individuals by means of additive and dominance variance components of random polygenic effects. The two approaches we use are a multipoint method to detect association under a recessive model (called “the allele-specific HBD [ASHBD] method”) and a single-point method to detect association under a GTAM. In both cases, tests are performed only for alleles at genotyped markers, rather than for arbitrary loci in the genome.
The ASHBD method uses both the inbreeding and the LD in a founder population to find association between a quantitative trait and HBD for a marker allele. If a recessive QTL allele was introduced by a single founder, then that QTL allele should remain associated with the nearby alleles on the original founder haplotype. Individuals in the current population who, as a result of inbreeding, receive two copies of a marker allele that was on the founder haplotype, should show, on average, a different value for the trait from the rest of the population. We consider the same model as in equation (1), but with 1h replaced by 1ha, the indicator that the individual is HBD for a particular allele. As before, the efficient score statistic for testing the null hypothesis (γ=0) is asymptotically equivalent to the generalized regression t statistic for γ in the model of equation (4), but with h replaced by E(1ha|genotypedata), where E(1ha|genotypedata)i=hi if the ith individual is homozygous for the given allele and 0 otherwise, and h is calculated as in the “Probability of HBD” subsection, above.
The GTAM method for association with a particular allele follows a similar framework to that of the HBD and ASHBD methods. Now, however, we wish to allow for a more general model than just recessive. This is described by the linear model y=Xβ+Gγ+g+e, where the first column of G is the number of copies of the given allele in the individual’s genotype, the second column is an indicator of homozygosity for the given allele, and γ=(γ1,γ2)t measures the strength of the genetic effect at the locus. The quantities X, β, g, and e are as described in equation (1). Within this parameterization, γ1 is a measure of the additive effect of the allele and γ2 is a measure of the dominance effect (i.e., the deviation from additivity). The expected phenotypic effect, then, of one copy of the allele is γ1 and of two copies of the allele is 2γ1+γ2. We test the null hypothesis γ1=γ2=0. Through the same argument as used for the HBD linkage test, the F test can be shown to be a version of the efficient score statistic. Hence, we perform a generalized regression for each allele at each marker and use an F test to determine the significance of γ in each case. The relationship between estimates of heritability and the most significant P values of ASHBD and GTAM analyses on 20 QTLs are reported by Ober et al. (2001).
Assessment of Significance
Appropriate assessment of genomewide significance for results in a large, complex pedigree can be a major challenge. Standard Gaussian theory can be used to obtain a locus-specific P value from the either the t or F statistic calculated from the generalized regression, with Bonferroni correction used to adjust for multiple tests in the ASHBD and GTAM methods when several alleles are present at a marker. Because the methods model the locus-specific effect as a main effect rather than a random effect, these P values are fairly robust to deviations of the residuals from multivariate normality (Lehmann 1986, sec. 5.4). A greater issue in the interpretation of the results is correction of the P value as a result of multiple tests throughout the genome. Although Bonferroni correction works well for a single marker with multiple alleles, in spite of a tendency for positive correlation among the statistics for alleles at the same locus, such a strategy is far too conservative when testing at multiple, linked loci. Here, we develop a novel permutation-based test, which is applicable at the genome-screen stage, when the positions of markers could reasonably be assumed to be independent of linkage/LD results under the null hypothesis. The permutation-based test allows us to assess significance in the presence of multiple, dependent tests and to guard against deviations from normality in the data, while preserving the covariance structure due to relatedness among individuals. When the data follow a multivariate-normal distribution, this test is, asymptotically, a true permutation test.
The validity of a permutation test relies on the exchangeability of the elements to be permuted. In the case of testing that the slope is zero in simple linear regression (i.e., a single predictor) there is an accepted method of permutation for exact tests of the hypothesis (Anderson and Robinson 2001). This, however, is not true for multiple regression, which is a special case of the statistical framework we use. The lack of exchangeability is a result of correlations among the variables to be permuted; here, either the phenotypes or genotypes. In the multiple-linear-regression model Y=β1+β2X+β3Z+e, where one wishes to test the dependence of Y on Z (i.e., the null hypothesis H0: β3=0), neither the Z nor the Y variables are exchangeable with respect to the other, because the βi are unknown parameters and must be estimated (Good 2000; Anderson and Robinson 2001). Instead, when they are independent and identically distributed (IID), it is the true error terms e that are exchangeable random variables. However, it is not the e values that are observed but rather their estimates  , the residuals, upon which a correlation is induced by the estimation process, rendering them nonexchangeable. Nevertheless, a number of approximate, yet asymptotically exact, permutation methods have been proposed and are reviewed and evaluated by Anderson and Robinson (2001). In pedigree analysis, the situation is further complicated because the e are not IID but have a covariance structure due to relatedness of the individuals. We overcome these difficulties for multivariate-normal data by finding a linear transformation that, when applied to
  , the estimate of e under the null hypothesis, results in the new vector ξ, whose elements are uncorrelated. Because the multivariate-normal distribution is completely specified by its first two moments (the mean vector and covariance matrix), these transformed residuals are independent and, hence, exchangeable. We then permute the elements of ξ to obtain ξπ. The process is completed by untransforming ξπ and obtaining shuffled data
  , where β0 is the estimate of β under the null model. (We use the convention of Anderson and Robinson [2001], which specifies that “π” used as a superscript denotes that the appended variable is permuted, whereas “π” used as a subscript denotes that the appended variable is derived from permuted and unpermuted variables.) In principle, data sets resulting from all permutations π can then be analyzed to obtain an empirical P value. In practice, we take a random sample of permutations. We now describe, in detail, our permutation method.
We consider linear models whose form, under the null hypothesis, is y=Xβ+e, where y is the phenotype vector; X is the matrix of covariates, including an intercept; β is the vector of regression coefficients; and e is the vector of error terms with covariance matrix Ω. Assume, for the moment, that Ω is known. To calculate an empirical P value from a permutation test, we need to generate values of yπ under the null hypothesis through a permutation of a transformation of the original data. By generating many yπ and performing the same analysis as was done with the original data, we find the empirical P value. As mentioned above, it is not the elements of y that are exchangeable, but rather the error terms e (when IID). Our error terms, however, have covariance matrix Ω, giving rise to residuals, under the null model, of  , where
  is the least-squares estimate of β under the null model. Under the null hypothesis, the covariance matrix of
  is Σ*=Ω-X(XtΩ-1X)-1Xt, and, thus, its elements are not exchangeable.
To find exchangeable elements we first transform the linear model by decomposing the covariance matrix, Ω=CtC and, assuming C is invertible, premultiplying the regression equation by C-t to obtain z=Wβ+ɛ, where z=C-ty, W=C-tX, and ɛ=C-te. The covariance matrix of the residuals  is Σ=I-W(WtW)-1Wt. Assuming X is of full rank, then the n×n matrix Σ is symmetric of rank n-k, and idempotent (i.e., Σ2=Σ), where n is the number of individuals and k is the number of covariates (i.e., columns of X). The spectral theorem tells us we can make the decomposition Σ=VΛVt, where Λ is a diagonal matrix with the first n-k elements equal to the eigenvalue 1 and the last k elements equal to the eigenvalue 0, and V is an orthogonal matrix whose first n-k columns are eigenvectors associated with eigenvalue 1 and whose last k columns are eigenvectors associated with eigenvalue 0. Writing V=(V1V0), where V1=(v1…vn-k) is the matrix of eigenvectors with eigenvalue 1, we obtain Σ=V1Vt1 with Vt1V1=In-k. The vector
  has covariance matrix Vt1ΣV1=In-k and its elements, under the assumption of multivariate normality, are IID and, hence, exchangeable. The elements of ξ are now permuted to obtain ξπ=Πξ, where Π is a permutation matrix, with the result transformed by V1 to get
  . Note that under the identity permutation
  , as expected. The shuffled data obtained from the permutation are
 |
Note that when Ω is known, this method allows one to perform an exact permutation test under the assumption of multivariate normality. For our application, Ω is not known, and we approximate C by  , where
  . Thus, our test is only asymptotically exact for multivariate-normal data.
We can now calculate empirical locus-specific and genomewide P values. For a given simulated data set yπ, compute the standard t statistic (or F statistic for the GTAM) for each  , and obtain for each the corresponding P value calculated according to Gaussian theory. For the HBD-mapping test, we define this to be the nominal locus-specific P value. Note that for the ASHBD and GTAM tests, there will typically be more than one such P value at each locus, corresponding to different alleles. In that case, we take the minimum P value at each locus and Bonferroni-correct to obtain the nominal locus-specific P value. To obtain the empirical locus-specific P value, calculate the minimum P value at the locus for each simulated realization as well as for the real data. The proportion of simulated results for which the minimum P value at the locus was smaller than that in the real data is the empirical locus-specific P value. In addition, an empirical genomewide P value for each locus is calculated as follows. For each simulated realization, find the smallest P value of all tests performed across the genome. The proportion of these that are smaller than the smallest P value at a given locus in the real data set is defined to be the empirical genomewide P value for that locus. In addition, the level for suggestive significance can be set so that it is exceeded, on average, once per simulated realization.
The permutation-based assessment of significance we describe relies on an assumption of independence between the marker positions and the values of the test statistic under the null hypothesis. Thus, it is applicable to situations where the individual markers were not selected according to earlier results for linkage or LD in the same data set. In a genome scan, the markers used are typically from a previously chosen framework set that provides ∼5–10 cM average intermarker distance. Our permutation-based procedure is applicable when framework markers are used. Similarly, if additional markers have been typed, for instance, to shorten certain gaps in the framework set, but were not chosen on the basis of results of a previous analysis of the same data set, the permutation procedure may, again, be used to determine genomewide significance. However, if additional markers are added to follow-up on a potentially interesting signal, the genomewide significance of these additional markers cannot be determined via our test, because their positions are selected on the basis of the signal. For the permutation test to be valid in this case, the positions of the additional markers would have to change with each permutation, based on the initial mapping results of that permutation. On the other hand, the test is valid for candidate gene studies, where several markers have been placed around a previously determined candidate gene, as a way to correct for multiple comparisons across linked markers.
Results
We apply the methods described above to a sample of individuals who are members of a large, complex Hutterite pedigree. The Hutterites are a religious sect that originated in the Tyrolean Alps in the 1500s. Between the mid-1700s and mid-1800s, while in Russia, the population grew in size from ∼120 to >1,000 members (Hostetler 1974). In the 1870s, ∼900 of these members migrated to what is now South Dakota, and approximately half settled on three communal farms. The population has since expanded dramatically, with >35,000 Hutterites living in >350 communal farms (i.e., colonies) in the northern United States and western Canada. The Hutterites’ communal lifestyle ensures that all members are exposed to a relatively uniform environment. Genealogical records trace all extant Hutterites to <90 ancestors who lived in the early 1700s to early 1800s (Martin 1970). The relationships among these ancestors are unknown, and some of them may have been related. The three original South Dakota colonies have given rise to the three major subdivisions of the modern Hutterite population, the Schmiedeleut (S-leut), Dariusleut, and Leherleut. Members of each subdivision have remained reproductively isolated from each other since 1910 (Bleibtreu 1964). The subjects of our study, the S-leut Hutterites of South Dakota, are descendants of 64 Hutterite ancestors and represent the four S-leut–colony lineages defined by Mange (1964). Information on the relationships among members of our sample are in the form of a 13-generation 1,623-member genealogy.
Our study includes Hutterites from nine communal farms in South Dakota. Subjects were evaluated for a variety of qualitative and quantitative phenotypes, during trips to Hutterite colonies in 1994 and in 1997–98. All Hutterites of >5 years of age who were in the colonies on the days of our visits were included in the studies. Individuals who were ⩾14 years of age donated one blood sample after an overnight fast, from which insulin levels were determined as described by Ober et al. (2001). A total of 497 individuals were included in subsequent analyses of fasting insulin level, among whom the mean insulin level was 101.56 pmol/liter with an SD of 61.32 pmol/liter. To account for skewness in the phenotype distribution, the fasting insulin levels were transformed to approximate multivariate normality by taking the log of the log of the measured levels. Age was found to be the only significant covariate, and estimates of the additive and dominance variances were obtained using the maximum-likelihood method of Abney et al. (2000). There was no detectable dominance variance, and we estimated the narrow and broad heritability to be 0.32 (Ober et al. 2001).
Genotype data were collected on 386 microsatellite markers (screening set 9) by the National Heart, Lung and Blood Institute–funded Mammalian Genotyping Service, yielding a 9.1-cM map (Center for Medical Genetics, Marshfield Medical Research Foundation). Subjects were genotyped for >200 additional markers in selected regions of the genome, as described elsewhere (Ober et al. 2000). These additional markers were selected on the basis of results of analyses of asthma, and it seems reasonable to assume that, under the null hypothesis, their positions are independent of the linkage and LD signals for the analysis of insulin levels. Hence, these markers meet our criteria for validity of the empirical genomewide P values. From the genotype data we calculated the probability of HBD for each individual at all genetic markers as well as at three loci between markers. The calculations were performed assuming a genotype error plus mutation rate of 1%, and 1,000 data sets were simulated for purposes of assessing significance.
The results of our multipoint genome scan by use of the HBD linkage method are shown in figure 1. The locus-specific P values calculated empirically and from Gaussian theory were very similar, with large relative differences only for those loci whose nominal P values were too small to accurately compute empirically on the basis of 1,000 simulations. We observed an ∼4-cM-wide region comprising loci with empirical genomewide significance of <0.02 at ∼6 cM from the p-ter of chromosome 19. The peak of this region has a genomewide significance of 0.011, which corresponds to a nominal locus-specific P value of 1.3×10⁻⁵. This locus was associated with decreased levels of insulin. In addition, a region near the p-ter of chromosome 16 had locus-specific P values <.001 (genomewide P values ∼.2) and was associated with decreased levels of insulin. Plots of chromosomes 19 and 16 are shown in greater detail in figures 2 and 3, respectively. No other regions reached levels of suggestive or better evidence for linkage.

Figure 1.

Results of multipoint HBD analysis. P values and equivalent LOD scores with 1 df are plotted with respect to chromosomal position for the genome. The solid line plots the locus-specific value, and the dotted line plots the genomewide value.
Figure 2.

Results of the multipoint HBD analysis for chromosome 19. The solid line plots the locus-specific value, and the dotted line plots the genomewide value. The position of D19S591, which showed suggestive evidence of association under the ASHBD and GTAM analyses, is indicated on the X-axis.
Figure 3.

Results of the multipoint HBD analysis for chromosome 16. The solid line plots the locus-specific value, and the dotted line plots the genomewide value. The positions of D16S2622 and ATA41E04, which showed suggestive evidence of association under the ASHBD analysis, are indicated on the X-axis.
Genome scans were also performed using the ASHBD and GTAM methods. Although there were no loci that met genomewide significance, there were several loci that had suggestive associations. Under the ASHBD model, four loci had locus-specific P values <.002. These included D16S2622 (8 cM from p-ter) and ATA41E04 (11 cM from p-ter), which are neighboring loci in the same region of 16p that was identified by the HBD-mapping method; D19S591 (10 cM from p-ter), which is in the same region of 19p that was identified by HBD mapping; and D1S2644 (44 cM from p-ter). The most significant alleles at these markers were all associated with a decrease in insulin levels. Under the GTAM method, one locus, D19S591 (10 cM from p-ter), which was also identified by ASHBD, had a locus-specific P value <.001. The effect of this allele was approximately recessive (γ2=-4.8γ1), with the presence of two copies of the associated allele conferring lower insulin levels. The positions of these chromosome 19 and 16 markers are shown in figures 2 and 3, and P values by all three methods are shown in table 1.
Table 1.
Nominal Locus-Specific and Genomewide P Values
|
P Values under |
|||||||
| HBD |
ASHBD |
GTAM |
|||||
| Location | Distancefrom p-ter(cM) | Locus Specific | Genomewide | Locus Specific | Genomewide | Locus Specific | Genomewide |
| Chromosome 1: | |||||||
| D1S2644 | 44 | .039 | 1.0 | .0013 | .46 | .0023 | .76 |
| Chromosome 16: | |||||||
| D16S2622 | 8 | .00048 | .20 | .0015 | .66 | .016 | 1.0 |
| ATA41E04 | 11 | .0010 | .36 | .00091 | .34 | .0049 | .90 |
| Chromosome 19: | |||||||
| D19S591 | 10 | 3.8×10⁻⁵ | .02 | .0016 | .43 | .00091 | .45 |
There are no obvious insulin-related genes within the region of chromosome 16 that was suggestively linked to and associated with insulin levels according to the HBD and ASHBD analyses, respectively. On chromosome 19, however, the insulin-receptor gene INSR is located ∼25 cM from the p-ter. It is impossible to determine with certainty whether INSR is responsible for the signal that we observe on chromosome 19, but given both the lack of significant P values at ∼25 cM from the p-ter and the distance between the peak and INSR (≈13 cM), this seems unlikely. The results of the ASHBD and GTAM analyses generally matched those of the HBD linkage analysis. Finally, the marker alleles associated with insulin levels at the chromosome 19 marker were different under the ASHBD and GTAM analyses. This would be consistent with allelic heterogeneity at a QTL, although we cannot exclude other possible explanations.
Discussion
We have introduced three new QTL-mapping methods, a homozygosity linkage-mapping method and two LD-mapping methods, and a novel permutation-based test for assessing locus-specific and genomewide significance. The mapping methods were designed for randomly ascertained phenotypes in isolated founder populations with complex, inbred pedigrees. The HBD and ASHBD methods, in particular, use the presence of inbreeding to search for QTLs that, when homozygous, have a discernible effect on the trait. The GTAM method, on the other hand, does not require inbreeding, but does use the extensive LD expected in such populations to detect QTLs that follow a more general genetic model. Linkage and LD analyses have traditionally been difficult in groups with large, complex pedigrees, such as the Hutterites, because of the computational burden of doing likelihood and IBD calculations. Our HBD linkage-mapping method avoids the burden of calculating likelihoods by using the efficient score statistic, which is locally most powerful in the neighborhood of the null hypothesis. Furthermore, by focusing on homozygosity mapping, we need to calculate the IBD probabilities of the two alleles within each individual, rather than more-general IBD probabilities among the study sample. By making a Markov approximation of the HBD/non-HBD process along the genome for each individual, we are able to use an HMM method to efficiently compute the probability of HBD at any locus, conditional on all the genotype data for that individual and the known pedigree specifying the relationship of the parents. The Markov approximation that we use appears to be very reliable on the basis of our simulations (data not shown).
LD-mapping methods may be useful to find genes of moderate effect in isolated founder populations (Risch and Merikangas 1996; Tu and Whittemore 1999). Even though LD-mapping methods do not typically require the difficult IBD calculations used in linkage analyses, there are still problematic methodological issues that must be solved. Isolated founder populations may be useful for LD-mapping studies, in part because QTL alleles may be introduced into the population on a single founder haplotype or a few founder haplotypes. Hence, there may be a greater probability of finding the QTL by detecting an association of the trait with a marker allele on the same founder haplotype. However, if the marker allele is common and was introduced into the population on multiple haplotypes, any association between the trait and the marker allele may be difficult, or impossible, to detect. The ASHBD method that we introduced can help circumvent this problem by combining multipoint HBD information with a means of testing for alleles in LD with a QTL allele. Another difficulty arises because in isolated founder populations many of the study individuals may be closely related, depending on the current size of the population and how many generations back it was founded. In this case, background polygenic effects that are shared among the individuals may significantly contribute to the trait, and, if uncontrolled for, give rise to an artificially inflated signal and attendant type I error rate (Newman et al. 2001). Given genealogical information, our methods correct for this effect by modeling the polygenic background with additive and dominance variance components.
The results of our analysis of fasting insulin level indicate that we do have power to detect at least one locus linked to insulin levels and others that are suggestively linked or associated. Although, in this example, the three different methods tended to choose from among the same set of best loci, one would not necessarily expect this to be the case. The utility of the three methods depends on the circumstances of the introduction of the QTL alleles into the population, and, consequently, one can expect the results of analyses of a data set by these methods to differ, in general. The HBD linkage method, for instance, associates deviations in the trait value with general autozygosity for founder alleles at a locus (i.e., the two alleles in an individual are IBD, but it is not necessarily the same allele from individual to individual). We expect this method will be able to detect a specific QTL allele that acts recessively but that may occur on different haplotypes, or multiple recessive QTL alleles that cause a similar type of deviation. The ASHBD method looks for deviations in trait values that are associated with HBD for a particular allele at a marker. This method would be useful when a recessive QTL allele was introduced on a single founder haplotype. It may appear that both the HBD and ASHBD methods should give approximately equivalent results when applied to a single data set. However, this is not necessarily the case. For instance, the ASHBD method may have a positive—and the HBD method a negative—result when other founder haplotypes have recessive alleles at this QTL that have an effect opposite to that of the recessive QTL allele detected by ASHBD.
Although the HBD and ASHBD methods require inbreeding to be effective, the GTAM method does not. Instead, it looks for deviations in trait values that are associated with a particular marker allele, where the mode of inheritance is given by a GTAM. This method has the advantage of a more general genetic model than that for HBD or ASHBD, but it is single point, whereas the others are multipoint. Thus, in some situations it may have more power and in others less. We note that a single-point method can often be advantageous in regions with substantial map error.
Although we have discussed the HBD linkage-mapping method as a separate test from the association methods (i.e., ASHBD and GTAM), it is possible to combine linkage and association in a single method. The linear-model framework, which we use to construct our tests, can easily accommodate multiple predictors. In a combined analysis, predictors for both linkage and association could be included. For instance, in the HBD analysis, an indicator for homozygosity for a particular allele could be included. This could allow one, for example, to test whether homozygosity for a given allele could fully explain the evidence for linkage to the region. The linear-model framework can also be useful for incorporating multiple linked or unlinked QTLs into the model. For instance, a combined analysis could allow one to test for linkage to a QTL that is not in LD with the associated marker allele.
Assessment of significance is essential to the interpretation of the genome-scan results. For certain select study designs and analysis methods, it is possible to use guidelines that have been suggested elsewhere (Lander and Kruglyak 1995). For quantitative-trait analyses in large, complex pedigrees, however, these guidelines are not appropriate, and an empirical method may be preferable. We have developed a novel permutation-based test for both locus-specific and genomewide significance. Our method has the advantages of giving asymptotically exact P values when the data are multivariate normal and preserving the correlation structure resulting from the pedigree. The permutation procedure that we describe is also applicable to a wider set of methods than the three we present here. For instance, variance-component linkage methods (Amos 1994; Almasy and Blangero 1998) use the same linear model under the null hypothesis as that in the methods introduced here and could obtain empirical genomewide P values by use of this permutation-based method.
By taking advantage of the relatively simple form of the score statistic, we have developed an efficient means of performing linkage and association mapping for quantitative traits in a population that poses significant analytical challenges. We demonstrated the utility of the methods by applying them to fasting insulin levels in the Hutterites. The Hutterites are an extreme example of a population with a large, complex pedigree, but these methods can also be applied to other populations with an arbitrary genealogical structure.
Figure 1.

Results of multipoint HBD analysis. P values and equivalent LOD scores with 1 df are plotted with respect to chromosomal position for the genome. The solid line plots the locus-specific value, and the dotted line plots the genomewide value.
Acknowledgments
We acknowledge Dr. Rodney Parry, for help in the planning and execution of field trips to Hutterite colonies, Mr. Harvey Dytch, for assistance with computer programming and data management, and Drs. Edwin Cook, Steven Graves, Kenneth Polonsky, Angelo Scanu, Dale Schoeller, and Gordon Williams, for consultation on and measurement of the clinical phenotypes. We gratefully acknowledge the Hutterites for their participation in this study. This study was supported by National Institutes of Health grants HL49596, HL56399, HG01645, and DK55889; the National Heart, Lung and Blood Institute–funded Mammalian Genotyping Service; the National Science Foundation Group Infrastructure Grant Postdoctoral Fellowship (to M.A.); and a grant from Hoffmann–La Roche.
Electronic-Database Information
The URL for data in this article is as follows:
- Center for Medical Genetics, Marshfield Medical Research Foundation, http://research.marshfieldclinic.org/genetics/ (for microsatellite map)
References
- Abecasis GR, Cardon LR, Cookson WOC (2000) A general test for association for quantitative traits in nuclear families. Am J Hum Genet 66:279–292 [DOI] [PMC free article] [PubMed] [Google Scholar]
- Abney M, McPeek MS, Ober C (2000) Estimation of variance components of quantitative traits in inbred populations. Am J Hum Genet 66:629–650 [DOI] [PMC free article] [PubMed] [Google Scholar]
- Almasy L, Blangero J (1998) Multipoint quantitative-trait linkage analysis in general pedigrees. Am J Hum Genet 62:1198–1211 [DOI] [PMC free article] [PubMed] [Google Scholar]
- Amos CI (1994) Robust variance-components approach for assessing genetic linkage in pedigrees. Am J Hum Genet 54:535–543 [PMC free article] [PubMed] [Google Scholar]
- Anderson MJ, Robinson J (2001) Permutation tests for linear models. Aust NZ J Stat 43:75–88 [Google Scholar]
- Baum LE (1972) An inequality and associated maximization technique in statistical estimation for probabilistic functions of Markov processes. Inequalities 3:1–8 [Google Scholar]
- Bleibtreu HK (1964) Marriage and residence patterns in a genetic isolate. PhD thesis, Harvard University, Cambridge, MA [Google Scholar]
- Boehnke M (2000) A look at linkage disequilibrium. Nat Genet 25:246–247 [DOI] [PubMed] [Google Scholar]
- Churchill GA, Doerge RW (1994) Empirical threshold values for quantitative trait mapping. Genetics 138:963–971 [DOI] [PMC free article] [PubMed] [Google Scholar]
- Cox DR, Hinkley DV (1974) Theoretical statistics. Chapman & Hall, London [Google Scholar]
- Donnelly KP (1983) The probability that related individuals share some section of genome identical by descent. Theor Popul Biol 23:34–63 [DOI] [PubMed] [Google Scholar]
- Dyer TD, Williams JT, Göring HHH, Blangero JT (2001) The effect of pedigree complexity on quantitative trait linkage analysis. Genet Epidemiol 21 Suppl 1:S236–S243 [DOI] [PubMed] [Google Scholar]
- Eaves IA, Merriman TR, Barber RA, Nutland S, Tuomilehto-Wolf E, Tuomilehto J, Cucca F, Todd JA (2000) The genetically isolated populations of Finland and Sardinia may not be a panacea for linkage disequilibrium mapping of common disease genes. Nat Genet 25:320–323 [DOI] [PubMed] [Google Scholar]
- Fisher RA (1918) The correlation between relatives on the supposition of Mendelian inheritance. Trans R Soc Edinburgh 52:399–433 [Google Scholar]
- Ginns EI, St Jean P, Philibert RA, Galdzicka M, Damschroder-Williams P, Thiel B, Long RT, et al (1998) A genome-wide search for chromosomal loci linked to mental health wellness in relatives at high risk for bipolar affective disorder among the Old Order Amish. Proc Natl Acad Sci USA 95:15531–15536 [DOI] [PMC free article] [PubMed] [Google Scholar]
- Good P (2000) Permutation tests, 2d ed. Springer-Verlag, New York [Google Scholar]
- Gudbjartsson DF, Jonasson K, Frigge ML, Kong A (2000) Allegro, a new computer program for multipoint linkage analysis. Nat Genet 25:12–13 [DOI] [PubMed] [Google Scholar]
- Horikawa Y, Oda N, Cox NJ, Li X, Orho-Melander M, Hara M, Hinokio Y, et al (2000) Genetic variation in the gene encoding calpain-10 is associated with type 2 diabetes mellitus. Nat Genet 26:163–175 (erratum: Nat Genet 26:502) [DOI] [PubMed] [Google Scholar]
- Hostetler JA (1974) Hutterite society. Johns Hopkins University Press, Baltimore [Google Scholar]
- Hsueh WC, Mitchell BD, Schneider JL, St Jean PL, Pollin TI, Ehm MG, Wagner MJ, Burns DK, Sakul H, Bell CJ, Shuldiner AR (2001) Genome-wide scan of obesity in the Old Order Amish. J Clin Endocrinol Metab 86:1199–1205 [DOI] [PubMed] [Google Scholar]
- Hugot JP, Chamaillard M, Zouali H, Lesage S, Cézard JP, Belaiche J, Almer S, Tysk C, O’Morain CA, Gassull M, Binder V, Finkel Y, Cortot A, Modigliani R, Laurent-Puig P, Gower-Rousseau C, Macry J, Colombel JF, Sahbatou M, Thomas G (2001) Association of NOD2 leucine-rich repeat variants with susceptibility to Crohn’s disease. Nature 31:599–603 [DOI] [PubMed] [Google Scholar]
- Iturria SJ, Williams JT, Almasy L, Dyer TD, Blangero J (1999) An empirical test of the significance of an observed quantitative trait locus effect that preserves additive genetic variation. Genet Epidemiol 17:S169–S173 [DOI] [PubMed] [Google Scholar]
- Kruglyak L, Lander ES (1998) Faster multipoint linkage analysis using Fourier transforms. J Comput Biol 5:1–7 [DOI] [PubMed] [Google Scholar]
- Lander ES, Green P (1987) Construction of multilocus genetic maps in humans. Proc Natl Acad Sci USA 84:2363–2367 [DOI] [PMC free article] [PubMed] [Google Scholar]
- Lander ES, Kruglyak L (1995) Genetic dissection of complex traits: guidelines for interpreting and reporting linkage results. Nat Genet 11:241–247 [DOI] [PubMed] [Google Scholar]
- Lander ES, Schork NJ (1994) Genetic dissection of complex traits. Science 265:2037–2048 [DOI] [PubMed] [Google Scholar]
- Lange K (1978) Central limit theorems for pedigrees. J Math Biol 6:59–66 [Google Scholar]
- Lehmann EL (1986) Testing statistical hypotheses, 2d ed. Springer-Verlag, New York [Google Scholar]
- Lin S, Rogers JA, Hsu JC (2001) A confidence-set approach for finding tightly linked genomic regions. Am J Hum Genet 68:1219–1228 [DOI] [PMC free article] [PubMed] [Google Scholar]
- Mange AP (1964) Growth and inbreeding of a human isolate. Hum Biol 36:104–133 [PubMed] [Google Scholar]
- Markianos K, Daly MJ, Kruglyak L (2001) Efficient multipoint linkage analysis through reduction of inheritance space. Am J Hum Genet 68:963–977 [DOI] [PMC free article] [PubMed] [Google Scholar]
- Martin AO (1970) The founder effect in a human isolate: evolutionary implications. Am J Phys Anthropol 32:351–368 [DOI] [PubMed] [Google Scholar]
- McPeek MS, Sun L (2000) Statistical tests for detection of misspecified relationships by use of genome-screen data. Am J Hum Genet 66:1076–1094 [DOI] [PMC free article] [PubMed] [Google Scholar]
- Newman DL, Abney M, McPeek MS, Ober C, Cox NJ (2001) The importance of genealogy in determining genetic associations with complex traits. Am J Hum Genet 69:1146–1148 [DOI] [PMC free article] [PubMed] [Google Scholar]
- Ober C, Abney M, McPeek MS (2001) The genetic dissection of complex traits in a founder population. Am J Hum Genet 69:1068–1079 [DOI] [PMC free article] [PubMed] [Google Scholar]
- Ober C, Cox NJ (1998) Mapping genes for complex traits in founder populations. Clin Exp Allergy 28 Suppl 1:101–105 [DOI] [PubMed] [Google Scholar]
- Ober C, Tsalenko A, Parry R, Cox NJ (2000) A second-generation genomewide screen for asthma-susceptibility alleles in a founder population. Am J Hum Genet 67:1154–1162 [DOI] [PMC free article] [PubMed] [Google Scholar]
- Province MA (2000) A single, sequential, genome-wide test to identify simultaneously all promising areas in a linkage scan. Genet Epidemiol 19:301–322 [DOI] [PubMed] [Google Scholar]
- Rabiner LR (1989) A tutorial on hidden Markov models and selected applications in speech recognition. Proc IEEE 77:257–285 [Google Scholar]
- Risch N, Merikangas K (1996) The future of genetic studies of complex human diseases. Science 273:1516–1517 [DOI] [PubMed] [Google Scholar]
- Shifman S, Darvasi A (2001) The value of isolated populations. Nat Genet 28:309–310 [DOI] [PubMed] [Google Scholar]
- Taillon-Miller P, Bauer-Sardiña I, Saccone NL, Putzel J, Laitinen T, Cao A, Kere J, Pilia G, Rice JP, Kwok P-Y (2000) Juxtaposed regions of extensive and minimal linkage disequilibrium in human Xq25 and Xq28. Nat Genet 25:324–328 [DOI] [PubMed] [Google Scholar]
- Tavtigian SV, Simard J, Teng DH, Abtin V, Baumgard M, Beck A, Camp NJ, et al (2001) A candidate prostate cancer susceptibility gene at chromosome 17p. Nat Genet 27:172–180 [DOI] [PubMed] [Google Scholar]
- Thompson EA (1994) Monte Carlo estimation of multilocus autozygosity probabilities. Paper presented at the 26th Symposium on the Interface. Research Triangle Park, NC, June 15–18 [Google Scholar]
- Thompson EA, Heath SC (1999) Estimation of conditional multilocus gene identity among relatives. In: Seillier-Moiseiwitsch F (ed) Lecture notes—monograph series, vol 33: Statistics in molecular biology. Institute of Mathematical Statistics, Hayward, CA [Google Scholar]
- Tu P-I, Whittemore AS (1999) Power of association and linkage tests when the disease alleles are unobserved. Am J Hum Genet 64:641–649 [DOI] [PMC free article] [PubMed] [Google Scholar]
- Wan Y, Cohen J, Guerra R (1997) A permutation test for the robust sib-pair linkage method. Ann Hum Genet 61:79–87 [DOI] [PubMed] [Google Scholar]
- Wright AF, Carothers AD, Pirastu M (1999) Population choice in mapping genes for complex disease. Nat Genet 23:397–404 [DOI] [PubMed] [Google Scholar]