

Abstract
We aimed to develop a new method to convert T1-weighted brain MRIs to feature vectors, which could be used for content-based image retrieval (CBIR). To overcome the wide range of anatomical variability in clinical cases and the inconsistency of imaging protocols, we introduced the Gross feature recognition of Anatomical Images based on Atlas grid (GAIA), in which the local intensity alteration, caused by pathological (e.g., ischemia) or physiological (development and aging) intensity changes, as well as by atlas–image misregistration, is used to capture the anatomical features of target images.
As a proof-of-concept, the GAIA was applied for pattern recognition of the neuroanatomical features of multiple stages of Alzheimer's disease, Huntington's disease, spinocerebellar ataxia type 6, and four subtypes of primary progressive aphasia. For each of these diseases, feature vectors based on a training dataset were applied to a test dataset to evaluate the accuracy of pattern recognition. The feature vectors extracted from the training dataset agreed well with the known pathological hallmarks of the selected neurodegenerative diseases. Overall, discriminant scores of the test images accurately categorized these test images to the correct disease categories. Images without typical disease-related anatomical features were misclassified. The proposed method is a promising method for image feature extraction based on disease-related anatomical features, which should enable users to submit a patient image and search past clinical cases with similar anatomical phenotypes.
Keywords: Atlas, Feature recognition, Alzheimer's disease, Huntington's disease, Primary progressive aphasia, Spinocerebellar ataxia
Highlights
-
•
A novel method to convert anatomical brain MRIs to feature vectors is introduced.
-
•
Degree of local atlas–image disagreement is used to capture the anatomical features.
-
•
The method was applied for pattern recognition of various neurodegenerative diseases.
-
•
The feature vectors agreed well with the known pathological hallmarks of diseases.
-
•
The method accurately categorized test images to the correct disease categories.
1. Introduction
Conventional structural MRI still plays a leading part in clinical diagnostic radiology, providing vast amounts of anatomical information. There are numerous clinical hallmarks and signs that can be depicted by structural MRI, which are well established after more than 30 years of clinical application. Currently, clinical MR images are interpreted by radiologists and stored electronically in the picture archiving and communication system (PACS) with the radiology reports. A text-based image searching of PACS enables the retrieval of stored images with the clinical information and radiology report. This searching capability dramatically improved daily clinical practice by saving time and effort to collect images from a patient to evaluate disease progression and the efficacy of treatments, and to collect images from a specific clinical condition to investigate the common anatomical phenotype depicted by MRI. However, to further aid in clinical use, an image-based search, in which the patient's image is submitted to PACS as a “keyword,” and past images with similar anatomical phenotypes are identified, and a statistical report about the diagnosis and prognosis is provided, would be far more informative. This type of image searching is called content-based image retrieval (CBIR), which is an anticipated technology in medical imaging (El-Kwae et al., 2000; Greenspan and Pinhas, 2007; Muller et al., 2005; Orphanoudakis et al., 1996; Rahman et al., 2007; Robinson et al., 1996; Sinha et al., 2001; Unay et al., 2010). Although the CBIR is a promising technology, to date, the application to PACS is limited (Muller et al., 2004; Sinha and Kangarloo, 2002), because of the difficulty of extracting features from the stored images, especially for brain MRI, which consists of numerous anatomical structures with highly varying intensity, volume, and shape among diseases and even among normal individuals. One of the solutions is to apply image quantification technologies, which has been the subject of extensive research in the last two decades (Ashburner and Friston, 1999; Chiang et al., 2008; Good et al., 2001; Mazziotta et al., 2001; Smith et al., 2006; Verma et al., 2005; Wright et al., 1995; Yushkevich et al., 2008; Zhang et al., 2006). These analyses have been mostly designed for traditional group-based studies, in which strict inclusion criteria and age-matched controls were essential, but often incompatible, with clinical practice where an individual image, not a group of diseases, is the target of the analysis. The concept of group analysis assumes consistent locations of abnormalities, which does not hold for clinical situations with heterogeneous patient populations and image quality. There are diseases with lesions that are not seen in the normal brain, such as stroke and brain tumors, and diseases with atrophy in a specific set of anatomical structures, such as Alzheimer's disease. To localize the disease-related pathological changes seen in brain MRI, transformation-based image analysis methods are often employed. However, the lesions with abnormal intensity or the space-occupying lesions often cause significant misregistration of brain structures after image transformation. The brain with severe atrophy, such as that seen in Alzheimer's disease, is also problematic in terms of the transformation accuracy. There are methods to overcome such inaccuracy by using specific approaches, such as lesion-masking (Andersen et al., 2010; Ripolles et al., 2012) or a disease-specific template (Liao et al., 2012; Mandal et al., 2012; Wang et al., 2012) (e.g., http://www.loni.ucla.edu/Atlases/), but it is still difficult to quantify various types of diseases in the same methodological framework. In addition, most of these methods use image contrast to guide the transformation, and therefore, are sensitive to the variation in contrast not only due to the anatomical abnormalities, but also to the differences in scanner and image parameters.
In this study, we attempt to solve this widely known problem in transformation-based analysis by introducing an approach named the “Gross feature recognition of Anatomical Images based on Atlas grid (GAIA),” for image feature extraction (Fig. 1). In GAIA, images are co-registered to the atlas using linear transformation, followed by intensity measurement for the multiple areas in the atlas space. The overall shape and size are only roughly adjusted to that of the atlas, leaving residual misregistrations in most of the anatomical areas. The measured intensity of each area represents a combination of the local intensity alteration, caused by pathological (e.g., ischemia) or physiological (development and aging) intensity changes, as well as by atlas–image misregistration, which are recorded as unique anatomical features in a quantitative standardized matrix. Since the goal of CBIR is to retrieve images based on anatomical similarity, our ultimate interest is not how accurately images can be warped, but how to extract imaging features that can separate a specific diagnostic group from other conditions. This motivated us to use the GAIA as a method for the image recognition applied to a pool of clinical MRIs with a mixture of various diseases.
Fig. 1.
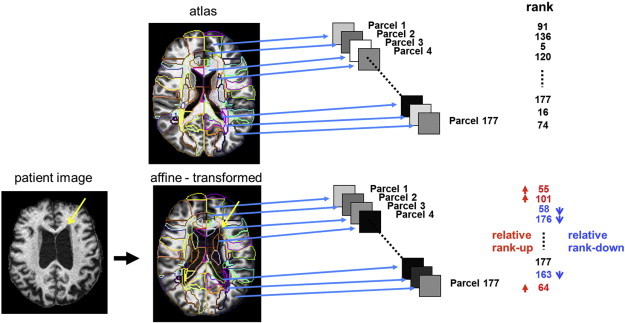
GAIA procedure. All images are co-registered to the atlas space using affine transformation. The atlas segmentation map (colored contour) is overlaid on the co-registered image. The mean intensity of each of 177 parcels is calculated and ranked by the order of mean intensity. Namely, the area with highest intensity is ranked #1 and the area with lowest intensity is ranked #177. Note that the intensity includes information about both misregistration and intensity mismatch between the atlas and the target image. For example, parcels with cerebrospinal fluid contamination (e.g., parcel 4) and with low intensity change, such as the periventricular cap (yellow arrows, parcel 3), were ranked lower than those of the atlas. (For interpretation of the references to color in this figure legend, the reader is referred to the web version of this article.)
As a proof of concept, the GAIA was applied to multiple stages of neurodegenerative diseases with known macroscopic anatomical alterations, such as Alzheimer's disease (AD) (Dickerson et al., 2009; Du et al., 2007; Lerch et al., 2005), Huntington's disease (HD) (van den Bogaard et al., 2012), primary progressive aphasia (PPA) (Mesulam et al., 2012), and spinocerebellar ataxia type 6 (SCA6) (Eichler et al., 2011). We focused on 3D T1-weighted images scanned by magnetization-prepared rapid gradient recalled echo (MPRAGE), since this sequence is already widely used in clinical practice, especially when neurodegenerative diseases are suspected. To extract features specific to each of the diseases, we first applied a principal component analysis (PCA) followed by linear discriminant analysis (LDA) to a training dataset. The resultant feature vectors were subsequently applied to the test dataset collected from multiple scanners to test the accuracy of image categorization based on the GAIA.
2. Methods
2.1. Participants and image acquisitions
A de-identified database consisting of T1-weighted images scanned with a magnetization-prepared rapid gradient recalled echo (MPRAGE) sequence, collected through four independent clinical research studies (Faria et al., 2013; Jung et al., 2012; Oishi et al., 2011; Unschuld et al., 2012), was analyzed retrospectively. The Institutional Review Board approved each study, and written, informed consent was obtained. The demographic features, scan parameters, and abbreviations are summarized in Table 1.
Table 1.
Demographic features and scan parameters.
| AD group | Training dataset |
Test dataset |
||||||
|---|---|---|---|---|---|---|---|---|
| AD (n = 12) | NC (n = 10) | NC_c (n = 3) |
AD (n = 9) |
MCI (n = 18) |
MCI_c (n = 6) |
NC (n = 10) |
||
| I. | Age (years) | 76.4 ± 5.1 | 72.8 ± 8.5 | 77.7 ± 8.7 | 74.6 ± 8.1 | 74.4 ± 5.5 | 78.7 ± 2.7 | 76.8 ± 4.1 |
| Sex (M:F) | 10:2 | 4:6 | 2:1 | 7:2 | 13:5 | 4:2 | 4:6 | |
| Education (years) | 15.8 ± 4.2 | 15.1 ± 2.2 | 14.7 ± 2.3 | 15.3 ± 3.0 | 15.4 ± 3.1 | 16.3 ± 3.4 | 17.4 ± 2.7 | |
| II. | MMSE | 22.2 ± 2.8 | 29.2 ± 1.5 | 27.7 ± 1.5 | 21.2 ± 3.3 | 27.1 ± 2.1 | 24.3 ± 1.0 | 29.3 ± 0.9 |
| ADAS-cog | 18.4 ± 4.3 | 11.0 ± 2.1 | 8.7 ± 2.1 | 20.7 ± 8.1 | 12.2 ± 4.9 | 14.8 ± 4.9 | 10.8 ± 1.8 | |
| CDR-rating | 1.2 ± 0.5 | 0 | 0.2 ± 0.3 | 1.0 ± 0.4 | 0.5 ± 0.1 | 0.5 | 0 | |
| CDR-sum | 6.9 ± 2.9 | 0 | 0.2 ± 0.3 | 5.4 ± 2.1 | 1.3 ± 0.8 | 1.6 ± 0.6 | 0 | |
| GDS | 1.5 ± 1.9 | 1.0 ± 1.2 | 0.3 ± 0.6 | 2.8 ± 2.1 | 1.4 ± 1.1 | 0.5 ± 0.8 | 1.4 ± 2.5 | |
| III. | Scan parameters | Protocol-1: 3.0 T Philips Intera MR scanner-MPRAGE-1.2; TR/TE (ms): 6.9/3.2; matrix: 256 × 256 × 170; FOV: 256 mm × 256 mm × 204 mm, zero-filled to 256 mm × 256 mm × 204 mm; voxel size (mm3): 1 × 1 × 1.2 | ||||||
| HD group | Training dataset |
Test dataset |
|||||
|---|---|---|---|---|---|---|---|
| HD_es (n = 9) |
NC (n = 14) |
HD_es (n = 4) |
HD_cto (n = 22) |
HD_ffo (n = 29) |
NC (n = 13) |
||
| I. | Age (years) | 50.8 ± 8.9 | 37.4 ± 9.8 | 51.0 ± 6.2 | 45.5 ± 8.2 | 37.5 ± 9.7 | 39.7 ± 9.8 |
| Sex (M:F) | 4:5 | 9:5 | 2:2 | 12:10 | 7:22 | 8:5 | |
| Education (years) | – | 17.4 ± 2.1 (n = 9) | – | 14.5 ± 2.7 (n = 10) | 14.9 ± 1.9 (n = 16) | 16.1 ± 3.3 (n = 8) | |
| CAG-repeat | 42.3 ± 1.7 (n = 4) | – | 43.5 ± 0.7 (n = 2) | 44.0 ± 3.5 | 42.0 ± 1.9 | – | |
| II. | MoCA | – | 26.6 ± 1.9 (n = 9) | – | 26.0 ± 2.3 (n = 7) | 26.0 ± 1.7 (n = 13) | 27.8 ± 1.6 (n = 5) |
| III. | Scan parameters | Protocol-2: 3.0 T Philips Intera MR scanner-MPRAGE-0.9; TR/TE (ms): 8.4/3.8; matrix: 256 × 256 × 150; FOV: 230 mm × 230 mm × 135 mm, zero-filled to 256 mm × 256 mm × 135 mm; flip angle: 8°; voxel size (mm3): 0.9 × 0.9 × 0.9 | |||||
| Protocol-3: 3.0 T Philips Intera MR scanner-MPRAGE-1.0; TR/TE (ms): 8.0/3.7; matrix: 256 × 256 × 150; FOV: 256 mm × 256 mm × 150 mm; voxel size (mm3): 1 × 1 × 1 | |||||||
| SCA6 group | Training dataset | Test dataset | |||||
| SCA6 (n = 12) |
NC (n = 4) |
SCA6 (n = 12) |
NC (n = 4) |
||||
| I. | Age (years) | 64.3 ± 6.1 | 55.3 ± 5.9 | 60.0 ± 6.0 | 58.3 ± 3.3 | ||
| Sex (M:F) | 2:10 | 1:3 | 2:10 | 2:2 | |||
| II. | SARA | 11.0 ± 12.3 | – | 8.2 ± 8.3 | – | ||
| III. | Scan parameters | Protocol-4: 3.0 T Philips Intera MR scanner-MPRAGE-1.1; TR/TE (ms): 10.3/6; matrix: 256 × 256 × 140; FOV: 212 mm × 212 mm × 151 mm, zero-filled to 256 mm × 256 mm × 151 mm; voxel size (mm3): 0.8 × 0.8 × 1.1 | |||||
| PPA group | Training dataset |
Test dataset |
|||||||||
|---|---|---|---|---|---|---|---|---|---|---|---|
| PPA_Sv (n = 9) |
PPA_NFv (n = 5) |
PPA_Lv (n = 11) |
PPA_U (n = 4) |
NC (n = 12) |
PPA_Sv (n = 9) |
PPA_NFv (n = 4) |
PPA_Lv (n = 11) |
PPA_U (n = 4) |
NC (n = 12) |
||
| I. | Age (years) | 65.1 ± 6.6 | 69.2 ± 11.0 | 67.3 ± 6.4 | 68.8 ± 7.8 | 61.7 ± 8.3 | 64.8 ± 6.3 | 70.8 ± 9.6 | 68.0 ± 5.9 | 64.8 ± 6.8 | 58.6 ± 6.3 |
| Sex (M:F) | 5:4 | 1:4 | 4:7 | 1:3 | 6:6 | 6:3 | 1:3 | 3:8 | 1:3 | 6:6 | |
| II. | WAB_AQ | 86.1 ± 7.0 (n = 4) |
84.1 ± 10.2 (n = 3) |
84.6 ± 13.3 (n = 9) |
97.3 ± 0.9 (n = 2) |
– | 82.5 ± 12.4 (n = 4) |
93.2 ± 5.6 (n = 3) |
86.0 ± 10.6 (n = 6) |
96.7 ± 1.6 (n = 2) |
– |
| III. | Scan parameters | Protocol-5: 3.0 T Philips Achieva MR scanner-MPRAGE-1.1; TR/TE (ms): 8.4/3.9; matrix: 256 × 256 × 140; FOV: 212 mm × 212 mm × 154 mm, zero-filled to 256 mm × 256 mm × 154 mm; voxel size (mm3): 0.8 × 0.8 × 1.1 | |||||||||
| Protocol-6: 3.0 T Philips Achieva MR scanner-MPRAGE-1.0; TR/TE (ms): 10/6; matrix: 256 × 256 × 120; FOV: 230 mm × 230 mm × 120 mm, zero-filled to 256 mm × 256 mm × 120 mm; voxel size (mm3): 0.9 × 0.9 × 1 | |||||||||||
Notes: AD = Alzheimer's disease, NC = normal control, MCI = mild cognitive impairment, MCI_c = MCI_converters, NC_c = NC_converters, HD = Huntington's disease, HD_es = HD early symptomatic, HD_cto = HD close to onset, HD_ffo = HD far from onset, SCA6 = spinocerebellar ataxia type 6, PPA = primary progressive aphasia, PPA_NFv = non-fluent variant of PPA, PPA_Sv = semantic variant of PPA, PPA_Lv = logopenic variant of PPA, PPA_U = unclassified PPA.
2.1.1. AD, mild cognitive impairment (MCI), and the cognitively normal (NC) control group
Twenty five probable-AD patients who met the NINCDS/ADRDA criteria (McKhann et al., 1984), with a clinical dementia rating (CDR) of 1; 25 aMCI patients who met the criteria for amnestic MCI (Petersen, 2004) with a CDR = 0.5; and 25 NC participants with a CDR = 0, were included. There were no differences among these groups with regard to age, race, education, and the occurrence of vascular conditions (Mielke et al., 2009). After three years of follow-up, six MCI patients had converted to AD and were defined as MCI converters (MCI_c); three NC participants had converted to AD and were defined as NC converters (NC_c). The diagnosis and neuropsychiatric evaluations [CDR, the Alzheimer's Disease Assessment Scale — cognitive portion (ADAS-cog), the mini mental state examination (MMSE), and the geriatric depression scale (GDS)] were performed at the time of the MRI scan.
MPRAGE sequences were acquired using a 3 T scanner (Gyroscan NT, Philips Medical Systems) located in the Kennedy Krieger Institute. The scan parameters were: repetition time (TR) 6.9 ms; echo time (TE) 3.2 ms; inversion time (TI) 846.3 ms; matrix 256 × 256 × 170; and field of view (FOV) 240 mm × 240 mm × 204 mm, zero-filled to 256 mm × 256 mm × 204 mm (protocol-1).
2.1.2. HD and the control group
Sixty-four participants positive for CAG expansion in Huntingtin and twenty-seven control subjects negative for CAG expansion were included. Among those positive for CAG expansion, thirteen participants were early symptomatic (HD_es) and 51 participants were asymptomatic, including 22 who were close to onset (HD_cto; less than 10 years to the estimated onset of the motor symptom) and 19 who were far from onset (HD_ffo; more than or equal to 10 years to the estimated onset of the motor symptom), based on the CAG-repeat length of the mutated Huntingtin allele and age (Langbehn et al., 2004). Disease burden score (DBS) was calculated as ([CAG-repeat length − 35.5] × age) (Penney et al., 1997). The Montreal Cognitive Assessment (MoCA) was performed to screen for mild cognitive dysfunction on the day of scanning. None of the participants had a history of diagnosed mood, obsessive compulsive, or psychotic disorder or substance abuse.
MPRAGE sequences were acquired using a 3 T scanner (Intera, Philips Medical Systems) located in the Kennedy Krieger Institute. Two different protocols were used, including protocol-2: TR 8.4 ms; TE 3.8 ms; TI 826 ms; matrix 256 × 256 × 150; FOV230 mm × 230 mm × 135 mm, zero-filled to 256 mm × 256 mm × 135 mm; and Flip angle = 8°; and protocol-3: TR 8.0 ms; TE 3.7 ms; TI 811 ms; matrix 256 × 256 × 150; and FOV 256 mm × 256 mm × 150 mm.
2.1.3. SCA6 group and the control group
Twenty-four patients with genetically diagnosed SCA6 and eight controls were enrolled. The duration of disease was defined from the first self-reported symptom of ataxia. The Scale for the Assessment and Rating of Ataxia (SARA) was performed for the evaluation of ataxic symptoms.
MPRAGE sequences were acquired using a 3 T scanner (Intera, Philips Medical Systems) located in the Kennedy Krieger Institute. The scan parameters were: TR 10.33 ms; TE 6.0 ms; TI 964.8 ms; matrix 256 × 256 × 140; and FOV 212 mm × 212 mm × 151 mm, zero-filled to 256 mm × 256 mm × 151 mm (protocol-4).
2.1.4. PPA group
Fifty seven participants with PPA, diagnosed on the basis of having a predominant and progressive deterioration in language in the absence of major change in personality, behavior, or cognition other than praxis for at least two years (Mesulam, 1982), and a control group without neurological symptoms, were included. PPA patients were classified as one of the variants of PPA according to recent guidelines (Gorno-Tempini et al., 2011), including non-fluent variant (PPA_NFv), semantic variant (PPA_Sv), and logopenic variant (PPA_Lv). Participants with only anomia and dysgraphia, and who did not meet the criteria for any of these variants, were categorized as unclassified PPA (PPA_U). All participants completed the Western Aphasia Battery (WAB) (Shewan and Kertesz, 1980) within one month before the MRI scans.
MPRAGE sequences were acquired using two 3 T scanners. The one located in the Kennedy Krieger Institute (Achieva, Philips Medical Systems) was used for protocol-5: TR 8.4 ms; TE 3.9 ms; TI 849.4 ms; matrix 256 × 256 × 140; and FOV 212 mm × 212 mm × 140 mm, zero-filled to 256 mm × 256 mm × 154 mm. The other located in the Johns Hopkins Hospital (Achieva, Philips Medical Systems) was used for protocol-6: TR 6.6 ms; TE 3.1 ms; TI 821 ms; matrix 256 × 256 × 120; and FOV 230 mm × 230 mm × 120 mm, zero-filled to 256 mm × 256 mm × 120 mm.
The MRIs from AD, HD_es, SCA6, PPA_Sv, PPA_NFv, PPA_Lv, PPA_U, and the control groups of each study were pseudo-randomly assigned to either training or test datasets. MRIs from NC_c, MCI, MCI_c, HD_cto, and HD_ffo were assigned as a test dataset.
2.2. Image processing
All images were re-sliced to 1 mm isotropic resolution (181 × 217 × 181 matrix), bias corrected, and skull-stripped to generate the “prepared” images by using SPM8 (http://www.fil.ion.ucl.ac.uk/spm/). The intensity histogram peaks of the cerebrospinal fluid (CSF), the gray matter (GM), and the white matter (WM) of the “prepared” images were adjusted to match those of the JHU-MNI atlas (http://cmrm.med.jhmi.edu/) using a nonlinear histogram matching routine implemented in DiffeoMap (www.mristudio.org). After intensity correction, 12-parameter affine transformation of AIR (Woods et al., 1998), implemented in DiffeoMap, was applied to the prepared images to co-register each participant's image to the atlas. The parcellation map of the JHU-MNI atlas was overlaid on the co-registered images to measure the mean intensity of the 177 areas. The measured intensity was converted to the rank order using the standard competition ranking. Namely, a structure with the highest intensity was ranked #1 and the lowest intensity was ranked #177. This conversion was performed to ameliorate the differences in intensity profile among different scan protocols, which might remain even after the bias and intensity corrections.
The novelty of the GAIA is the use of parcellation maps to measure the degree of misregistration and structural intensity mismatch, which have been regarded as errors to be excluded in traditional transformation-based image analysis. Although the overall shape and size are roughly adjusted to that of the atlas after affine transformation, there are residual misregistrations in most anatomical areas (Fig. 1). For example, if a given image has an enlargement in the lateral ventricle, the area defined as the caudate in the atlas is occupied by the enlarged ventricle, which results in lower intensity in this area because of the contamination of the cerebrospinal fluid (parcel 4 of Fig. 1), and hence, this results in a relative lowering of the rank order in this parcel (rightmost column of Fig. 1). If the image contains lesions with altered intensity, such as the periventricular cap, this also lowers the intensity of the corresponding area (parcel 3 of Fig. 1), which also results in a relative lowering of the rank order in this parcel. Our hypothesis is that the rank order, which represents a combination of the atlas-image segmentation and intensity disagreements, could be used to capture the anatomical features specific to the target image.
2.3. Normalization of the ranking
Training dataset: The rank (Rtrainij) of image i, area j was further converted to a z-score: Ztrainij = (Rtrainij - ) / σNCj, where represents the mean rank and σNCj represents the standard deviation of the area j of normal control images assigned to the training dataset. This resulted in a 102 (number of training data) × 177 (number of areas) matrix with Ztrainij in each element. A portion of this matrix including only normal control images (40 × 177 matrix) was also created to investigate the effects of age and gender.
Test dataset: The rank (Rtestkj) of image k, area j was further converted to a z-score: Ztestkj = (Rtestkj - ) / σNCj. This resulted in a 170 (number of test data) × 177 matrix with Ztestkj in each element.
2.4. Extraction of age- and gender-related features using a control subset of the training dataset
PCA was applied to the 40 × 177 matrix of Ztrainij to investigate correlations between extracted principal components (PCs) and age or gender. If significant correlations were identified, the PCA-derived eigenvectors were applied to the 102 × 177 matrix of Ztrainij and the 170 × 177 matrix of Ztestkj, from which the PCs with significant correlations were removed. This resulted in Ztrainil and Ztestkl, in which l ranges from 1 to m, which is the number of PCs without significant effects of age and gender. Spearman's rank correlation coefficient was applied for the evaluation, in which a corrected p < 0.05 (false discovery rate) was considered a significant correlation.
2.5. Extraction of disease-specific features using a training dataset
PCA was applied to the 102 × 177 matrix of Ztrainij to extract PCs that could explain > 95% of the total variance. Subsequently, LDA was applied to the PCs to extract typical appearances for specific disease categories. The eight statuses (NC, AD, HD_es, SCA6, PPA_Sv, PPA_NFv, PPA_Lv, and PPA_U) were used to label the training dataset. If significant effects of age or gender existed, LDA was also applied to the 102 × m matrix of Ztrainil. These procedures resulted in eight feature vectors that represented disease-specific anatomical features extracted from the training dataset.
2.6. Evaluation of GAIA using the test dataset
The eight feature vectors derived from the training dataset were applied to the test dataset (the 170 × 177 matrix of Ztestkj and the 170 × m matrix of Ztestkl) to calculate the discriminant scores of 13 statuses (NC, NC_c, AD, MCI, MCI_c, HD_es, HD_cto, HD_ffo, SCA6, PPA_Sv, PPA_NFv, PPA_Lv, and PPA_U) for each participant. A one-way analysis of variance was used to test the differences in the 13 statuses, and to test the differences in NC scores from five different scan protocols (protocols 1–5 in Table 1). The group differences in the discriminant scores were assessed using independent-sample t tests, in which p < 0.05 was considered significant. Receiver operating characteristic (ROC) curve analysis was performed to assess the classification of each disease group using discriminant scores. The correlations of discriminant scores with clinical scores were analyzed by using the Spearman's rank correlation tests, in which p < 0.05 was considered significant. Statistical analyses were performed on SPSS 18/20 (IBM Corp., NY, USA).
3. Results
3.1. Effects of age, gender, and scan parameters
Thirty-nine PCs were extracted from the 40 × 177 matrix of Ztrainij. Significant correlations were identified between the first PC and age (Spearman's rho = 0.73, p = 8.9 × 10− 8), and the 16th PC and gender (Spearman's rho = 0.39, p = 1.2 × 10− 2) (Fig. 2). Therefore, we created Ztrainil and Ztestkl (l: 1, 2, …, 37) in which the first and 16th PC were removed. With the effect of age and gender, the NC scores significantly differed among protocols 1–5, with the F (4, 35) = 3.648 and p = 1.4 × 10− 2. After removing the effects of age and gender, there was no significant difference in the NC scores among protocols 1–5 (F (4, 35) = 1.217 and p = 3.2 × 10− 1).
Fig. 2.
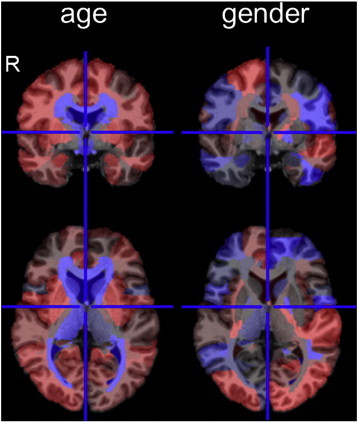
Effects of age and gender on the T1-weighted image. The effects of age and gender are color-coded on the 177 areas of the atlas space. The red represents positively weighted areas and the blue represents negatively weighted areas. Weights are relative, and have no applicable units. The images are in radiological convention (R represents the right side). The effect of age was mostly identified around the ventricles. The effect of female gender was found in the left superior temporal, bilateral middle occipital, bilateral subgenual anterior cingulate, and the right prefrontal areas, which were positively weighted, and the left inferior temporal, left precentral, and bilateral superior parietal areas, which were negatively weighted. (For interpretation of the references to color in this figure legend, the reader is referred to the web version of this article.)
3.2. Extraction of disease-specific features
From the Ztrainij derived from the training dataset, PCA extracted 54 PCs that could explain > 95% of the total variance. LDA was applied to the 54 PCs to extract eight feature vectors that could calculate discriminant scores for seven disease statuses and for normal status (Fig. 3A). PCA and subsequent LDA were also applied to the Ztrainil to extract feature vectors without the effects of age and gender (Fig. 3B).
Fig. 3.
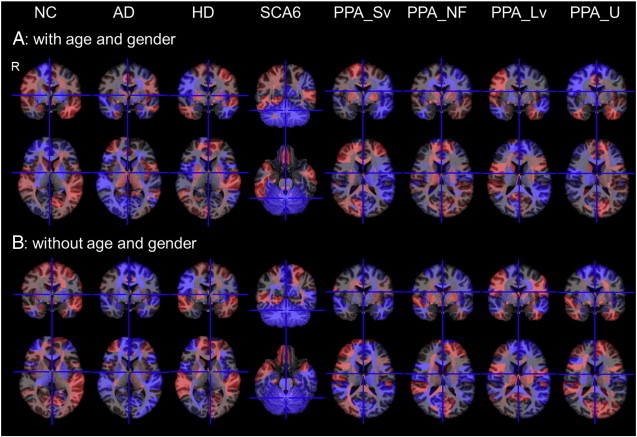
Color-coded feature vectors of eight clinical statuses.The feature vectors are color-coded on the 177 areas of the atlas space. The red represents positively weighted areas and the blue represents negatively weighted areas. Weights are relative, and have no applicable units. The images are in radiological convention (R represents the right side). (For interpretation of the references to color in this figure legend, the reader is referred to the web version of this article.)
3.3. Evaluation of GAIA using the test dataset
Discriminant scores of eight clinical statuses were calculated based on the trained feature vectors. Note that a higher discriminant score represents a closer match to the typical disease-related feature.
The NC group had a significantly higher NC score than the patient groups (p = 1.7 × 10− 4) (Fig. 4A). The difference still remained after the effects of age and gender were removed (p = 1.9 × 10− 2) (Fig. 4A). The area under the ROC curve (AUC) indicated that the ability of the NC score to correctly discriminate between the NC group and the non-NC group was significant for both with and without effects of age and gender (Table 2, I). Although NC individuals were cognitively and neurologically normal, those with low NC scores had atrophy in the brain (Fig. 5A).
Fig. 4.
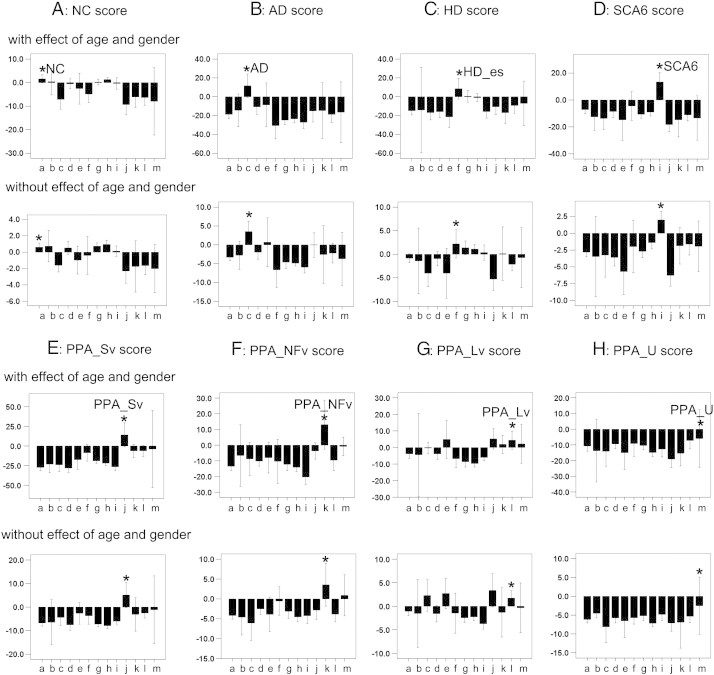
Bar charts of eight discriminant scores (A: NC score, B: AD score, C: HD score, D: SCA6 score, E: PPA_Sv score, F: PPA_NFv score, G: PPA_Lv score, and H: PPA_U score) from thirteen statuses (from left to right a: NC, b: NC_c, c: AD, d: MCI, e: MCI_c, f: HD_es, g: HD_cto, h: HD_ffo, i: SCA6, j: PPA_Sv, k: PPA_NFv, l: PPA_Lv, and m: PPA_U), with effects of age and gender (upper chart) and without effects of age and gender (lower chart). Asterisks (*) represent a status that should be discriminated by the discriminant score.
Table 2.
Results of ROC analyses.
| With effect of age and gender |
Without effect of age and gender |
||||||||||||
|---|---|---|---|---|---|---|---|---|---|---|---|---|---|
| Cut-off (≥) |
Sensitivity (%) |
Specificity (%) |
AUC (%) |
95%CI (%) |
p | Cut-off (≥) |
Sensitivity (%) |
Specificity (%) |
AUC (%) |
95%CI (%) |
p | ||
| I. NC score | NC | − 2.5 | 76.9 | 58 | 71.4 ± 4.9 | 61.8–80.9 | .000b | − 2.2 | 74.4 | 48.9 | 61.2 ± 5.0 | 51.5–71.0 | .033a |
| II. AD score | NC_c | − 33.3 | 100 | 45.5 | 64.7 ± 8.7 | 47.6–81.7 | 0.384 | − 9.5 | 100 | 48.5 | 59.5 ± 6.5 | 46.7–72.3 | 0.574 |
| AD | − 11.2 | 88.9 | 90.1 | 92.3 ± 3.6 | 85.1–99.4 | .000b | − 5.3 | 100 | 85.7 | 93.1 ± 2.2 | 88.9–97.3 | .000b | |
| MCI | − 34.3 | 83.3 | 44.7 | 65.4 ± 6.0 | 53.6–77.2 | .033a | − 10.7 | 94.4 | 32.2 | 60.5 ± 6.4 | 48.0–73.1 | 0.145 | |
| MCI_c | − 39.9 | 100 | 29.3 | 62.4 ± 11.7 | 39.4–85.4 | 0.303 | − 0.5 | 50 | 96.3 | 69.1 ± 13.4 | 42.9–95.3 | 0.112 | |
| III. HD score | HD_es | − 12.6 | 100 | 77.1 | 88.3 ± 4.1 | 80.2–96.3 | .009b | − 3.9 | 100 | 54.8 | 77.0 ± 7.9 | 61.6–92.4 | 0.065 |
| HD_cto | − 15.7 | 63.6 | 74.3 | 72.6 ± 6.0 | 60.8–84.4 | .001b | − 1.3 | 50 | 86.5 | 69.3 ± 6.4 | 56.7–81.9 | .004b | |
| HD-ffo | − 23.2 | 86.2 | 55.3 | 72.0 ± 4.5 | 63.3–80.8 | .000b | − 4.2 | 75.9 | 56 | 67.7 ± 5.2 | 57.6–77.8 | .003b | |
| IV. SCA6 score | SCA6 | − 8.5 | 100 | 91.1 | 97.4 ± 1.2 | 94.9–99.8 | .000b | − 1.8 | 91.7 | 88.6 | 94.1 ± 2.1 | 90.0–98.2 | .000b |
| V. PPA_Sv score | PPA_Sv | − 13.7 | 88.9 | 97.5 | 94.6 ± 3.9 | 0.0–100.0 | .000b | − 7 | 88.9 | 91.9 | 94.7 ± 2.7 | 89.4–100.0 | .000b |
| VI. PPA_NFv score | PPA_NFv | − 10.3 | 100 | 89.8 | 97.3 ± 2.3 | 0.0–100.0 | .001b | − 3.8 | 100 | 86.1 | 95.3 ± 3.0 | 0.0–100.0 | .002b |
| VII. PPA_Lv score | PPA_Lv | − 13.3 | 72.7 | 74.8 | 78.7 ± 6.1 | 66.7–90.6 | .001b | − 6.5 | 81.8 | 71.1 | 78.6 ± 5.6 | 67.7–89.5 | .002b |
| VIII. PPA_U score | PPA_U | − 10.6 | 50 | 92.2 | 66.0 ± 16.6 | 33.3–98.6 | 0.276 | − 0.6 | 50 | 98.2 | 71.1 ± 14.3 | 43.0–99.1 | 0.15 |
The asymptotic significance is less than 0.05.
The asymptotic significance is less than 0.01.
Fig. 5.
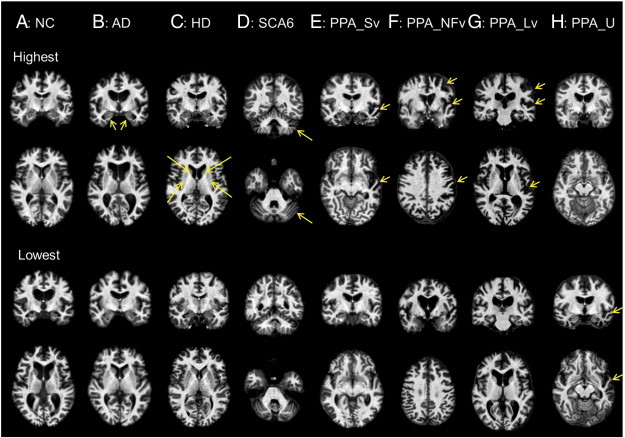
Test images with the highest discriminant score (upper two rows) and the lowest discriminant score (lower two rows). A: Ventricular enlargement was prominent in the NC participant with the lowest NC score. B: The AD participant with the highest AD score showed prominent atrophy in the medial temporal area (yellow arrows), which was not seen in the AD participant with the lowest AD score. C: The HD participant with the highest HD score (HD_es) showed prominent atrophy in the basal ganglia (yellow arrows), which was not seen in the HD_ffo participant with the lowest HD score. D: The SCA6 participant with the highest SCA6 score showed prominent atrophy in the cerebellum (yellow arrows). Cerebellar atrophy was found only in the upper half of the cerebellum in the SCA6 participant with the lowest SCA6 score. E: The PPA_Sv participant with the highest PPA_Sv score showed prominent atrophy in the anterior part of the left temporal lobe (yellow arrows), which was only mildly seen in the PPA_Sv participant with the lowest PPA_Sv score. F: PPA_NFv participant with the highest PPA_NFv score showed prominent atrophy in the left perisylvian areas (yellow arrows), which was only mildly seen in the PPA_NFv participant with the lowest PPA_NFv score. G: The PPA_Lv participant with the highest PPA_Lv score showed prominent atrophy in the left parieto-temporal area (yellow arrows), which was only mildly seen in the PPA_Lv participant with the lowest PPA_Lv score. H: The PPA_U participant with the highest PPA_U score showed only mild ventricular enlargement. However, prominent atrophy in the anterior part of the temporal area (yellow arrows), similar to that in the PPA_Sv, was seen in the PPA_U participant with the lowest PPA_U score. Images are in radiological convention. (For interpretation of the references to color in this figure legend, the reader is referred to the web version of this article.)
The AD scores of the AD and MCI groups were significantly higher than those of the non-AD non-MCI group (p = 1.6 × 10− 9 and 4.0 × 10− 2). The AD scores of the MCI_c group tended to be higher than those of the other groups, but did not reach statistical significance (p = 1.4 × 10− 1). After removing the effects of age and gender, the AD scores were still significantly higher in the AD group (p = 1.1 × 10− 7), but not in the MCI and MCI_c groups (p = 2.0 × 10− 1 and 1.8 × 10− 1). The AUC indicated that the ability of the AD score to correctly discriminate between the AD or MCI group and the non-AD non-MCI group was significant. In the AD group, the significance still remained after removing the effects of age and gender, but not in the MCI group (Table 2-II). Medial temporal atrophy, which is typically seen in AD patients, was not apparent on AD images with a low AD score (Fig. 5B). There were significant correlations between the AD score and MMSE, the ADAS, the CDR-rating, and the CDR-sum of box scores, but not between the AD score and GDS. After removing the effects of age and gender, the AD score still correlated with the MMSE, the ADAS, the CDR-rating, and the CDR-sum of box scores (Table 3, I).
Table 3.
Correlations between discriminant scores and clinical scales.
| With effect of age and gender |
Without effect of age and gender |
||||||
|---|---|---|---|---|---|---|---|
| n | r | p (2-tailed) | n | r | p (2-tailed) | ||
| I. AD score | MMSE | 36 | − .363a | .030a | 36 | − .478b | .003b |
| ADAS | 36 | 0.228 | 0.013a | 36 | 0.322 | 0.009b | |
| CDR-rating | 36 | .447b | .006b | 36 | .388a | .020a | |
| CDR-sum | 36 | .483b | .003b | 36 | .458b | .005b | |
| GDS | 36 | 0.158 | 0.358 | 36 | 0.103 | 0.548 | |
| II. HD score | MoCA | 20 | − 0.102 | 0.668 | 20 | 0.066 | 0.781 |
| III. SCA6 score | SARA | 12 | .745b | .005b | 12 | 0.519 | 0.083 |
| IV. PPA_Sv score | WAB AQ | 15 | − 0.2 | 0.475 | 15 | − 0.411 | 0.128 |
| WAB fluency | 15 | − 0.261 | 0.347 | 15 | − 0.504 | 0.055 | |
| WAB sequential command | 15 | − 0.041 | 0.884 | 15 | − 0.202 | 0.471 | |
| WAB repetition | 15 | 0.247 | 0.374 | 15 | 0.036 | 0.898 | |
| V. PPA_NFv score | WAB AQ | 15 | 0.161 | 0.576 | 15 | 0.375 | 0.168 |
| WAB fluency | 15 | 0.05 | 0.859 | 15 | 0.061 | 0.829 | |
| WAB sequential command | 15 | 0.174 | 0.535 | 15 | 0.225 | 0.421 | |
| WAB repetition | 15 | 0.502 | 0.057 | 15 | 0.564 | 0.029a | |
| VI. PPA_Lv score | WAB AQ | 15 | − 0.286 | 0.302 | 15 | − 0.475 | 0.074 |
| WAB fluency | 15 | − 0.006 | 0.984 | 15 | − 0.426 | 0.113 | |
| WAB sequential command | 15 | − 0.128 | 0.649 | 15 | − 0.358 | 0.191 | |
| WAB repetition | 15 | − 0.338 | 0.218 | 15 | − 0.382 | 0.16 | |
| VII. PPA_U score | WAB AQ | 15 | 0.186 | 0.508 | 15 | 0.268 | 0.334 |
| WAB fluency | 15 | 0.233 | 0.402 | 15 | 0.46 | 0.085 | |
| WAB sequential command | 15 | 0.119 | 0.672 | 15 | 0.252 | 0.365 | |
| WAB repetition | 15 | − 0.255 | 0.36 | 15 | − 0.073 | 0.797 | |
Correlation is significant at the 0.05 level (two-tailed).
Correlation is significant at the 0.01 level (two-tailed).
The HD scores of the HD groups (HD_es, HD_cto, and HD_ffo) were significantly higher than those of the non-HD group (p = 0.9 × 10− 2, 2.3 × 10− 4, and 2.2 × 10− 4). After removing the effects of age and gender, HD scores were still higher in the HD_cto and HD_ffo groups (p = .003 and .002), but the tendency toward higher HD scores for the HD_es group did not reach statistical significance (p = .096). The AUC indicated that the ability of the HD score to correctly discriminate between the HD group (HD_es, HD_cto, and HD_ffo) and the non-HD group was significant. This significance remained after removing the effects of age and gender, except in HD_es, which was slightly below statistical significance (Table 2, III). Atrophy in the striatum, which is typically seen in HD patients, was not apparent in HD images with a low HD score (Fig. 5C). HD score did not correlate with MoCA score.
The SCA6 scores of the SCA6 group were significantly higher than those of the non-SCA6 group (p = 3.1 × 10− 15). After removing the effects of age and gender, the SCA6 score was still significantly higher in the SCA6 group (p = 1.2 × 10− 8). The AUC indicated that the ability of the SCA6 score to correctly discriminate between the SCA6 group and the non-SCA6 group was significant. The significance remained after removing the effects of age and gender (Table 2, IV). Atrophy in the cerebellum, which is typically seen in SCA6 patients, was only seen in the upper half of the cerebellum in SCA6 images with a low SCA6 score (Fig. 5D). The SCA6 score, with the effects of age and gender, was correlated with the SARA score, but the significance was less after removing the effects of age and gender (Table 3, III).
The PPA_Sv score of the PPA_Sv group was significantly higher than that of the non-PPA_Sv group (p = .001). The PPA_NFv score of the PPA_NFv group was significantly higher than that of the non-PPA_NFv group (p = 2.0 × 10− 7). The PPA_Lv score of the PPA_Lv group was significantly higher than that of the non-PPA_Lv group (p = .001). The PPA_U group had a tendency toward higher PPA_U scores than those of the non-PPA_U group, but this did not reach statistical significance (p = 0.162). After removing the effects of age and gender, these four PPA scores were all significantly higher in PPA groups (p = .001, 4.1 × 10− 5, .006, and .019). The AUC indicated that the ability of the PPA score to correctly discriminate between the three PPA groups (PPA_Sv, PPA_NFv, and PPA_Lv) and the non-PPA group was significant. The significance remained after removing the effects of age and gender. However, the discrimination of the PPA_U group from the non-PPA_U group was not significant, either with or without the effects of age and gender (Table 2, V–VIII). Typical anatomical features, such as atrophy in the left fronto-temporal area (PPA_Sv), atrophy in the left frontal operculum (PPA_NFv), and atrophy in the left temporo-parietal area (PPA_Lv), were not apparent in PPA_Sv, PPA_NFv, and PPA_Lv images with low PPA scores (Fig. 5E–G). The WAB repetition scores correlated with the PPA_NFv scores only after removing the effects of age and gender (Table 3, IV–VII), but a significant correlation was not identified between the WAB AQ score and any of the PPA scores.
4. Discussion
GAIA employs mismatches between a target image and the reference atlas to extract anatomical features. The most striking aging effect was found in the periventricular area, probably due to ventricular enlargement, as previously reported (Juva et al., 1993; Wang et al., 2013). The effect of gender is also in agreement with the results of past studies (Chen et al., 2007; Coffey et al., 1998; Thambisetty et al., 2010).
Rank order was used to quantify the intensity profile. For T1-weighted images, the intensity of the cerebrospinal fluid is always lower than that of gray and white matter, and the white matter intensity is always higher than that of gray matter. The comparison of NC scores among five different protocols indicated the robustness of the GAIA-based approach against protocol variability.
The feature vectors extracted from the training dataset agreed with known pathological hallmarks. The medial temporal lobe and the parietal lobe were negatively weighted in AD, the basal ganglia were positively weighted in HD, the cerebellum was negatively weighted in SCA6, the left temporal area was negatively weighted in PPA_Sv, the left frontal operculum and the insular were negatively weighted in PPA_NFv, and the left parieto-temporal area was negatively weighted in PPA_Lv, regardless of the effects of age and gender. Note that with GAIA, the rank of the areas with cortical atrophy decreases because of the inclusion of the dark cerebrospinal fluid signal, and the lenticular nuclei with atrophy were ranked higher because of the inclusion of the surrounding bright white matter signal.
Several features were observed in GAIA-based image scoring. First, the discriminant scores indicated “How close the target image was to the typical anatomical feature of the disease.” As indicated in Fig. 5, the discriminant scores were not suitable to detect diseases in their early stage with only subtle anatomical alterations, or with atypical anatomical features. Second, AD, SCA6, PPA_Sv, and PPA_NFv were well discriminated from each other, which was expected from previous publications (Dolek et al., 2012; Laakso et al., 1998; Marigliano et al., in press). Congruent with the past studies that used morphometry (Xu et al., 2000), the AD score had limited power to separate MCI and MCI_c groups from non-AD, non-MCI groups. The AD, SCA6, and PPA_NFv scores correlated with functional scales, similar to the correlations between hippocampal volume and cognitive scales (Arlt et al., 2013; Troyer et al., 2012), between cerebellar volume and ataxia scales (Eichler et al., 2011; Jacobi et al., 2012; Jung et al., 2012), and between regional volumes and WAB subsets (Amici et al., 2007). This indicated that GAIA-based feature recognition is comparable to that based on morphometry. Third, the disease separation was generally better when the effects of age and gender were accounted for, probably because the age of the AD, MCI, MCI_c, and PPA groups was higher than that of the SCA6 and HD groups. Last, the performance of the discriminant scores was not satisfactory for the disease categories that included various histopathological diagnoses, or those with an atypical phenotype. MCI includes early AD and MCI without AD pathology (Albert, 2011). The histopathological diagnosis of PPA_Lv is usually AD (Kirshner, 2012; Rabinovici et al., 2008), which might partially explain the relatively high PPA_Lv score in AD and MCI_c, but the clinical phenotype is different from that of common AD. PPA_U is, by definition, a mixture of unclassified cases of PPA, which lacks common anatomical features.
While the GAIA was intended to be used as a tool for anatomical feature recognition, the natural extension is an automated image-based diagnosis. For such a diagnostic application, the GAIA needs to give discriminant scores with sufficiently high sensitivity and specificity for the diagnosis of individual patients. The ROC analysis demonstrated substantially high sensitivity and specificity for AD, HD_es, SCA6, PPA_Sv and PPA_NFv, suggesting the potential for a diagnostic application. However, given the fact that there are patients with less typical or atypical anatomical features (Fig. 5), GAIA alone might be insufficient for the clinical evaluation. One possibility for a future clinical application is a probabilistic evaluation of a single patient based on anatomical feature similarity. Namely, GAIA could be used to sort stored clinical cases with anatomical features similar to a target image, to calculate the probability of a given clinical condition, such as diagnosis, prognosis, or responsiveness to treatment. Anatomical features extracted by GAIA could also be combined with other clinical information, such as age, gender, symptoms, medical history, risk factors, results of physical examinations, and other neurological evaluations, to simulate physicians' decision-making. Since the effectiveness of combining image and non-image information to form a classification of AD and MCI has been demonstrated (Zhang et al., 2011), the GAIA might be a promising tool to extend the application of multimodal classification to a cohort that consists of multiple diseases and conditions. The exploration of the applicability of GAIA to clinical diagnosis support will be an important future direction.
In this study, GAIA was based on linear transformation, which does not require computationally extensive non-linear transformation. It is possible to combine GAIA with non-linear transformation. As the nonlinearity of the transformation increases, the accuracy of atlas-based structural definition also increases. However, the transformation results become highly sensitive to intensity abnormalities, potentially leading to unpredictable outcomes. The combination of GAIA and nonlinear transformation and the effect of the degree of nonlinearity are, thus, important directions for future research. The GAIA found characteristic anatomical features for each disease category, which has been previously reported by morphometric studies. Please note that conventional morphometry studies are based on manual delineation of pre-selected structures, or voxel-based analyses, which lead to voxel-based patterns specific to each disease on a study-specific (customized) template, while GAIA applies a single generic atlas and simple linear transformation for all disease models, making it an ideal tool for CBIR of a large clinical database.
This study has limitations. In this proof-of-concept study, only neurodegenerative diseases with well-known neuroanatomical features were included. To test the applicability of GAIA as a tool for CBIR, rigorous evaluation must be performed on much larger datasets, as well as on diseases with no or subtle neuroanatomical features (e.g., psychiatric diseases), diseases with substantial alterations in image intensity (e.g., stroke), diseases with space-occupying lesions (e.g., tumor), and patients with multiple diseases. Care should be taken to interpret the discriminant scores, since the scores are purely based on imaging features and do not necessarily reflect the histopathological or etiological background. Further investigations about the applicability of this method to other image modalities or to multimodal image recognition will be essential.
In summary, a method to convert T1-weighted brain MRIs to feature vectors, based on local atlas–image segmentation disagreement, can accurately categorize test images with typical disease-related anatomical features.
Conflict of interest
Dr. van Zijl is a paid lecturer for Philips Medical Systems and is the inventor of technology that is licensed to Philips. This arrangement has been approved by the Johns Hopkins University in accordance with its conflict of interest policies.
Acknowledgments
The authors thank Ms. Mary McAllister for the help with manuscript editing, and Ms. Terri Brawner and Mr. Hugh Wall for the technological support. This publication was made possible by grants from the National Institutes of Health (R01DC011317, R21AG033774, R01HD065955, K24DA61427, U54NS56883, P41EB015909, U24RR021382, P01EB00195, R01AG20012, K23EY015802, R21NS059830, M01RR000052, R01NS056307, RC1NS068897 and P50AG005146), the National Center for Research Resources grant G12-RR003061, the State Scholarship Fund (File No. 2011616055), and the Yousem Family Research Fund. Its contents are solely the responsibility of the authors and do not necessarily represent the official view of any of these institutes. The images acquired on Alzheimer's patients and age-matched controls were supported by a methods development grant from Glaxo-Smith-Kline.
Footnotes
This is an open-access article distributed under the terms of the Creative Commons Attribution-NonCommercial-No Derivative Works License, which permits non-commercial use, distribution, and reproduction in any medium, provided the original author and source are credited.
References
- Albert M.S. Changes in cognition. Neurobiol. Aging. 2011;32(Suppl. 1):S58–S63. doi: 10.1016/j.neurobiolaging.2011.09.010. [DOI] [PMC free article] [PubMed] [Google Scholar]
- Amici S., Ogar J., Brambati S.M., Miller B.L., Neuhaus J., Dronkers N.L., Gorno-Tempini M.L. Performance in specific language tasks correlates with regional volume changes in progressive aphasia. Cogn. Behav. Neurol. 2007;20:203–211. doi: 10.1097/WNN.0b013e31815e6265. [DOI] [PubMed] [Google Scholar]
- Andersen S.M., Rapcsak S.Z., Beeson P.M. Cost function masking during normalization of brains with focal lesions: still a necessity? Neuroimage. 2010;53:78–84. doi: 10.1016/j.neuroimage.2010.06.003. [DOI] [PMC free article] [PubMed] [Google Scholar]
- Arlt S., Buchert R., Spies L., Eichenlaub M., Lehmbeck J.T., Jahn H. Association between fully automated MRI-based volumetry of different brain regions and neuropsychological test performance in patients with amnestic mild cognitive impairment and Alzheimer's disease. Eur. Arch. Psychiatry Clin. Neurosci. 2013;263:335–344. doi: 10.1007/s00406-012-0350-7. [DOI] [PubMed] [Google Scholar]
- Ashburner J., Friston K.J. Nonlinear spatial normalization using basis functions. Hum. Brain Mapp. 1999;7:254–266. doi: 10.1002/(SICI)1097-0193(1999)7:4<254::AID-HBM4>3.0.CO;2-G. [DOI] [PMC free article] [PubMed] [Google Scholar]
- Chen X., Sachdev P.S., Wen W., Anstey K.J. Sex differences in regional gray matter in healthy individuals aged 44–48 years: a voxel-based morphometric study. Neuroimage. 2007;36:691–699. doi: 10.1016/j.neuroimage.2007.03.063. [DOI] [PubMed] [Google Scholar]
- Chiang M.C., Leow A.D., Klunder A.D., Dutton R.A., Barysheva M., Rose S.E., McMahon K.L., de Zubicaray G.I., Toga A.W., Thompson P.M. Fluid registration of diffusion tensor images using information theory. IEEE Trans. Med. Imaging. 2008;27:442–456. doi: 10.1109/TMI.2007.907326. [DOI] [PMC free article] [PubMed] [Google Scholar]
- Coffey C.E., Lucke J.F., Saxton J.A., Ratcliff G., Unitas L.J., Billig B., Bryan R.N. Sex differences in brain aging: a quantitative magnetic resonance imaging study. Arch. Neurol. 1998;55:169–179. doi: 10.1001/archneur.55.2.169. [DOI] [PubMed] [Google Scholar]
- Dickerson B.C., Bakkour A., Salat D.H., Feczko E., Pacheco J., Greve D.N., Grodstein F., Wright C.I., Blacker D., Rosas H.D., Sperling R.A., Atri A., Growdon J.H., Hyman B.T., Morris J.C., Fischl B., Buckner R.L. The cortical signature of Alzheimer's disease: regionally specific cortical thinning relates to symptom severity in very mild to mild AD dementia and is detectable in asymptomatic amyloid-positive individuals. Cereb. Cortex. 2009;19:497–510. doi: 10.1093/cercor/bhn113. [DOI] [PMC free article] [PubMed] [Google Scholar]
- Dolek N., Saylisoy S., Ozbabalik D., Adapinar B. Comparison of hippocampal volume measured using magnetic resonance imaging in Alzheimer's disease, vascular dementia, mild cognitive impairment and pseudodementia. J. Int. Med. Res. 2012;40:717–725. doi: 10.1177/147323001204000236. [DOI] [PubMed] [Google Scholar]
- Du A.T., Schuff N., Kramer J.H., Rosen H.J., Gorno-Tempini M.L., Rankin K., Miller B.L., Weiner M.W. Different regional patterns of cortical thinning in Alzheimer's disease and frontotemporal dementia. Brain. 2007;130:1159–1166. doi: 10.1093/brain/awm016. [DOI] [PMC free article] [PubMed] [Google Scholar]
- Eichler L., Bellenberg B., Hahn H.K., Koster O., Schols L., Lukas C. Quantitative assessment of brain stem and cerebellar atrophy in spinocerebellar ataxia types 3 and 6: impact on clinical status. AJNR Am. J. Neuroradiol. 2011;32:890–897. doi: 10.3174/ajnr.A2387. [DOI] [PMC free article] [PubMed] [Google Scholar]
- El-Kwae E.A., Xu H., Kabuka M.R. Content-based retrieval in picture archiving and communication systems. J. Digit. Imaging. 2000;13:70–81. doi: 10.1007/BF03168371. [DOI] [PMC free article] [PubMed] [Google Scholar]
- Faria A.V., Crinion J., Tsapkini K., Newhart M., Davis C., Cooley S., Mori S., Hillis A.E. Patterns of dysgraphia in primary progressive aphasia compared to post-stroke aphasia. Behav. Neurol. 2013;26:21–34. doi: 10.3233/BEN-2012-110237. [DOI] [PMC free article] [PubMed] [Google Scholar]
- Good C.D., Johnsrude I.S., Ashburner J., Henson R.N., Friston K.J., Frackowiak R.S. A voxel-based morphometric study of ageing in 465 normal adult human brains. Neuroimage. 2001;14:21–36. doi: 10.1006/nimg.2001.0786. [DOI] [PubMed] [Google Scholar]
- Gorno-Tempini M.L., Hillis A.E., Weintraub S., Kertesz A., Mendez M., Cappa S.F., Ogar J.M., Rohrer J.D., Black S., Boeve B.F., Manes F., Dronkers N.F., Vandenberghe R., Rascovsky K., Patterson K., Miller B.L., Knopman D.S., Hodges J.R., Mesulam M.M., Grossman M. Classification of primary progressive aphasia and its variants. Neurology. 2011;76:1006–1014. doi: 10.1212/WNL.0b013e31821103e6. [DOI] [PMC free article] [PubMed] [Google Scholar]
- Greenspan H., Pinhas A.T. Medical image categorization and retrieval for PACS using the GMM-KL framework. IEEE Trans. Inf. Technol. Biomed. 2007;11:190–202. doi: 10.1109/titb.2006.874191. [DOI] [PubMed] [Google Scholar]
- Jacobi H., Hauser T.K., Giunti P., Globas C., Bauer P., Schmitz-Hubsch T., Baliko L., Filla A., Mariotti C., Rakowicz M., Charles P., Ribai P., Szymanski S., Infante J., van de Warrenburg B.P., Durr A., Timmann D., Boesch S., Fancellu R., Rola R., Depondt C., Schols L., Zdzienicka E., Kang J.S., Ratzka S., Kremer B., Stephenson D.A., Melegh B., Pandolfo M., Tezenas du Montcel S., Borkert J., Schulz J.B., Klockgether T. Spinocerebellar ataxia types 1, 2, 3 and 6: the clinical spectrum of ataxia and morphometric brainstem and cerebellar findings. Cerebellum. 2012;11:155–166. doi: 10.1007/s12311-011-0292-z. [DOI] [PubMed] [Google Scholar]
- Jung B.C., Choi S.I., Du A.X., Cuzzocreo J.L., Geng Z.Z., Ying H.S., Perlman S.L., Toga A.W., Prince J.L., Ying S.H. Principal component analysis of cerebellar shape on MRI separates SCA types 2 and 6 into two archetypal modes of degeneration. Cerebellum. 2012;11:887–895. doi: 10.1007/s12311-011-0334-6. [DOI] [PMC free article] [PubMed] [Google Scholar]
- Juva K., Sulkava R., Erkinjuntti T., Valvanne J., Tilvis R. Prevalence of dementia in the city of Helsinki. Acta Neurol. Scand. 1993;87:106–110. doi: 10.1111/j.1600-0404.1993.tb04086.x. [DOI] [PubMed] [Google Scholar]
- Kirshner H.S. Primary progressive aphasia and Alzheimer's disease: brief history, recent evidence. Curr. Neurol. Neurosci. Rep. 2012;12:709–714. doi: 10.1007/s11910-012-0307-2. [DOI] [PubMed] [Google Scholar]
- Laakso M.P., Soininen H., Partanen K., Lehtovirta M., Hallikainen M., Hanninen T., Helkala E.L., Vainio P., Riekkinen P.J., Sr. MRI of the hippocampus in Alzheimer's disease: sensitivity, specificity, and analysis of the incorrectly classified subjects. Neurobiol. Aging. 1998;19:23–31. doi: 10.1016/s0197-4580(98)00006-2. [DOI] [PubMed] [Google Scholar]
- Langbehn D.R., Brinkman R.R., Falush D., Paulsen J.S., Hayden M.R., International Huntington's Disease Collaborative Group A new model for prediction of the age of onset and penetrance for Huntington's disease based on CAG length. Clin. Genet. 2004;65:267–277. doi: 10.1111/j.1399-0004.2004.00241.x. [DOI] [PubMed] [Google Scholar]
- Lerch J.P., Pruessner J.C., Zijdenbos A., Hampel H., Teipel S.J., Evans A.C. Focal decline of cortical thickness in Alzheimer's disease identified by computational neuroanatomy. Cereb. Cortex. 2005;15:995–1001. doi: 10.1093/cercor/bhh200. [DOI] [PubMed] [Google Scholar]
- Liao S., Jia H., Wu G., Shen D. A novel framework for longitudinal atlas construction with groupwise registration of subject image sequences. Neuroimage. 2012;59:1275–1289. doi: 10.1016/j.neuroimage.2011.07.095. [DOI] [PMC free article] [PubMed] [Google Scholar]
- Mandal P.K., Mahajan R., Dinov I.D. Structural brain atlases: design, rationale, and applications in normal and pathological cohorts. J. Alzheimers Dis. 2012;31(Suppl 3):S169–S188. doi: 10.3233/JAD-2012-120412. [DOI] [PMC free article] [PubMed] [Google Scholar]
- Marigliano V., Gualdi G., Servello A., Marigliano B., Volpe L.D., Fioretti A., Pagliarella M., Valenti M., Masedu F., Di Biasi C., Ettorre E., Fusetti M. Olfactory deficit and hippocampal volume loss for early diagnosis of Alzheimer disease: a pilot study. Alzheimer Dis. Assoc. Disord. 2013 doi: 10.1097/WAD.0b013e31827bdb9f. (in press) [DOI] [PubMed] [Google Scholar]
- Mazziotta J., Toga A., Evans A., Fox P., Lancaster J., Zilles K., Woods R., Paus T., Simpson G., Pike B., Holmes C., Collins L., Thompson P., MacDonald D., Iacoboni M., Schormann T., Amunts K., Palomero-Gallagher N., Geyer S., Parsons L., Narr K., Kabani N., Le Goualher G., Boomsma D., Cannon T., Kawashima R., Mazoyer B. A probabilistic atlas and reference system for the human brain: International Consortium for Brain Mapping (ICBM) Philos. Trans. R. Soc. Lond. B Biol. Sci. 2001;356:1293–1322. doi: 10.1098/rstb.2001.0915. [DOI] [PMC free article] [PubMed] [Google Scholar]
- McKhann G., Drachman D., Folstein M., Katzman R., Price D., Stadlan E.M. Clinical diagnosis of Alzheimer's disease: report of the NINCDS-ADRDA Work Group under the auspices of Department of Health and Human Services Task Force on Alzheimer's Disease. Neurology. 1984;34:939–944. doi: 10.1212/wnl.34.7.939. [DOI] [PubMed] [Google Scholar]
- Mesulam M.M. Slowly progressive aphasia without generalized dementia. Ann. Neurol. 1982;11:592–598. doi: 10.1002/ana.410110607. [DOI] [PubMed] [Google Scholar]
- Mesulam M.M., Wieneke C., Thompson C., Rogalski E., Weintraub S. Quantitative classification of primary progressive aphasia at early and mild impairment stages. Brain. 2012;135:1537–1553. doi: 10.1093/brain/aws080. [DOI] [PMC free article] [PubMed] [Google Scholar]
- Mielke M.M., Kozauer N.A., Chan K.C., George M., Toroney J., Zerrate M., Bandeen-Roche K., Wang M.C., Vanzijl P., Pekar J.J., Mori S., Lyketsos C.G., Albert M. Regionally-specific diffusion tensor imaging in mild cognitive impairment and Alzheimer's disease. Neuroimage. 2009;46:47–55. doi: 10.1016/j.neuroimage.2009.01.054. [DOI] [PMC free article] [PubMed] [Google Scholar]
- Muller H., Michoux N., Bandon D., Geissbuhler A. A review of content-based image retrieval systems in medical applications—clinical benefits and future directions. Int. J. Med. Inform. 2004;73:1–23. doi: 10.1016/j.ijmedinf.2003.11.024. [DOI] [PubMed] [Google Scholar]
- Muller H., Rosset A., Garcia A., Vallee J.P., Geissbuhler A. Informatics in radiology (infoRAD): benefits of content-based visual data access in radiology. Radiographics. 2005;25:849–858. doi: 10.1148/rg.253045071. [DOI] [PubMed] [Google Scholar]
- Oishi K., Akhter K., Mielke M., Ceritoglu C., Zhang J., Jiang H., Li X., Younes L., Miller M.I., van Zijl P.C., Albert M., Lyketsos C.G., Mori S. Multi-modal MRI analysis with disease-specific spatial filtering: initial testing to predict mild cognitive impairment patients who convert to Alzheimer's disease. Front. Neurol. 2011;2:54. doi: 10.3389/fneur.2011.00054. [DOI] [PMC free article] [PubMed] [Google Scholar]
- Orphanoudakis S.C., Chronaki C.E., Vamvaka D. I2Cnet: content-based similarity search in geographically distributed repositories of medical images. Comput. Med. Imaging Graph. 1996;20:193–207. doi: 10.1016/s0895-6111(96)00013-4. [DOI] [PubMed] [Google Scholar]
- Penney J.B., Jr., Vonsattel J.P., MacDonald M.E., Gusella J.F., Myers R.H. CAG repeat number governs the development rate of pathology in Huntington's disease. Ann. Neurol. 1997;41:689–692. doi: 10.1002/ana.410410521. [DOI] [PubMed] [Google Scholar]
- Petersen R.C. Mild cognitive impairment as a diagnostic entity. J. Intern. Med. 2004;256:183–194. doi: 10.1111/j.1365-2796.2004.01388.x. [DOI] [PubMed] [Google Scholar]
- Rabinovici G.D., Jagust W.J., Furst A.J., Ogar J.M., Racine C.A., Mormino E.C., O'Neil J.P., Lal R.A., Dronkers N.F., Miller B.L., Gorno-Tempini M.L. Abeta amyloid and glucose metabolism in three variants of primary progressive aphasia. Ann. Neurol. 2008;64:388–401. doi: 10.1002/ana.21451. [DOI] [PMC free article] [PubMed] [Google Scholar]
- Rahman M.M., Bhattacharya P., Desai B.C. A framework for medical image retrieval using machine learning and statistical similarity matching techniques with relevance feedback. IEEE Trans. Inf. Technol. Biomed. 2007;11:58–69. doi: 10.1109/titb.2006.884364. [DOI] [PubMed] [Google Scholar]
- Ripolles P., Marco-Pallares J., de Diego-Balaguer R., Miro J., Falip M., Juncadella M., Rubio F., Rodriguez-Fornells A. Analysis of automated methods for spatial normalization of lesioned brains. Neuroimage. 2012;60:1296–1306. doi: 10.1016/j.neuroimage.2012.01.094. [DOI] [PubMed] [Google Scholar]
- Robinson G.P., Tagare H.D., Duncan J.S., Jaffe C.C. Medical image collection indexing: shape-based retrieval using KD-trees. Comput. Med. Imaging Graph. 1996;20:209–217. doi: 10.1016/s0895-6111(96)00014-6. [DOI] [PubMed] [Google Scholar]
- Shewan C.M., Kertesz A. Reliability and validity characteristics of the Western Aphasia Battery (WAB) J. Speech Hear. Disord. 1980;45:308–324. doi: 10.1044/jshd.4503.308. [DOI] [PubMed] [Google Scholar]
- Sinha U., Kangarloo H. Principal component analysis for content-based image retrieval. Radiographics. 2002;22:1271–1289. doi: 10.1148/radiographics.22.5.g02se021271. [DOI] [PubMed] [Google Scholar]
- Sinha U., Ton A., Yaghmai A., Taira R.K., Kangarloo H. Image content extraction: application to MR images of the brain. Radiographics. 2001;21:535–547. doi: 10.1148/radiographics.21.2.g01mr18535. [DOI] [PubMed] [Google Scholar]
- Smith S.M., Jenkinson M., Johansen-Berg H., Rueckert D., Nichols T.E., Mackay C.E., Watkins K.E., Ciccarelli O., Cader M.Z., Matthews P.M., Behrens T.E. Tract-based spatial statistics: voxelwise analysis of multi-subject diffusion data. Neuroimage. 2006;31:1487–1505. doi: 10.1016/j.neuroimage.2006.02.024. [DOI] [PubMed] [Google Scholar]
- Thambisetty M., Wan J., Carass A., An Y., Prince J.L., Resnick S.M. Longitudinal changes in cortical thickness associated with normal aging. Neuroimage. 2010;52:1215–1223. doi: 10.1016/j.neuroimage.2010.04.258. [DOI] [PMC free article] [PubMed] [Google Scholar]
- Troyer A.K., Murphy K.J., Anderson N.D., Craik F.I., Moscovitch M., Maione A., Gao F. Associative recognition in mild cognitive impairment: relationship to hippocampal volume and apolipoprotein E. Neuropsychologia. 2012;50:3721–3728. doi: 10.1016/j.neuropsychologia.2012.10.018. [DOI] [PubMed] [Google Scholar]
- Unay D., Ekin A., Jasinschi R.S. Local structure-based region-of-interest retrieval in brain MR images. IEEE Trans. Inf. Technol. Biomed. 2010;14:897–903. doi: 10.1109/TITB.2009.2038152. [DOI] [PubMed] [Google Scholar]
- Unschuld P.G., Joel S.E., Pekar J.J., Reading S.A., Oishi K., McEntee J., Shanahan M., Bakker A., Margolis R.L., Bassett S.S., Rosenblatt A., Mori S., van Zijl P.C., Ross C.A., Redgrave G.W. Depressive symptoms in prodromal Huntington's Disease correlate with Stroop-interference related functional connectivity in the ventromedial prefrontal cortex. Psychiatry Res. 2012;203:166–174. doi: 10.1016/j.pscychresns.2012.01.002. [DOI] [PMC free article] [PubMed] [Google Scholar]
- van den Bogaard S., Dumas E., van der Grond J., van Buchem M., Roos R. MRI biomarkers in Huntington's disease. Front. Biosci. (Elite Ed.) 2012;4:1910–1925. doi: 10.2741/e512. [DOI] [PubMed] [Google Scholar]
- Verma R., Mori S., Shen D., Yarowsky P., Zhang J., Davatzikos C. Spatiotemporal maturation patterns of murine brain quantified by diffusion tensor MRI and deformation-based morphometry. Proc. Natl. Acad. Sci. U. S. A. 2005;102:6978–6983. doi: 10.1073/pnas.0407828102. [DOI] [PMC free article] [PubMed] [Google Scholar]
- Wang H., Ren Y., Bai L., Zhang W., Tian J. Morphometry based on effective and accurate correspondences of localized patterns (MEACOLP) PLoS One. 2012;7:e35745. doi: 10.1371/journal.pone.0035745. [DOI] [PMC free article] [PubMed] [Google Scholar]
- Wang H.L., Yu R., Wu Y.T., Lee W.Y., Lin M.F., Chen C.Y., Shen E.Y. The changes of cerebral morphology related to aging in Taiwanese population. PLoS One. 2013;8:e55241. doi: 10.1371/journal.pone.0055241. [DOI] [PMC free article] [PubMed] [Google Scholar]
- Woods R.P., Grafton S.T., Holmes C.J., Cherry S.R., Mazziotta J.C. Automated image registration: I. General methods and intrasubject, intramodality validation. J. Comput. Assist. Tomogr. 1998;22:139–152. doi: 10.1097/00004728-199801000-00027. [DOI] [PubMed] [Google Scholar]
- Wright I.C., McGuire P.K., Poline J.B., Travere J.M., Murray R.M., Frith C.D., Frackowiak R.S., Friston K.J. A voxel-based method for the statistical analysis of gray and white matter density applied to schizophrenia. Neuroimage. 1995;2:244–252. doi: 10.1006/nimg.1995.1032. [DOI] [PubMed] [Google Scholar]
- Xu Y., Jack C.R., Jr., O'Brien P.C., Kokmen E., Smith G.E., Ivnik R.J., Boeve B.F., Tangalos R.G., Petersen R.C. Usefulness of MRI measures of entorhinal cortex versus hippocampus in AD. Neurology. 2000;54:1760–1767. doi: 10.1212/wnl.54.9.1760. [DOI] [PubMed] [Google Scholar]
- Yushkevich P.A., Zhang H., Simon T.J., Gee J.C. Structure-specific statistical mapping of white matter tracts. Neuroimage. 2008;41:448–461. doi: 10.1016/j.neuroimage.2008.01.013. [DOI] [PMC free article] [PubMed] [Google Scholar]
- Zhang H., Yushkevich P.A., Alexander D.C., Gee J.C. Deformable registration of diffusion tensor MR images with explicit orientation optimization. Med. Image Anal. 2006;10:764–785. doi: 10.1016/j.media.2006.06.004. [DOI] [PubMed] [Google Scholar]
- Zhang D., Wang Y., Zhou L., Yuan H., Shen D. Multimodal classification of Alzheimer's disease and mild cognitive impairment. Neuroimage. 2011;55:856–867. doi: 10.1016/j.neuroimage.2011.01.008. [DOI] [PMC free article] [PubMed] [Google Scholar]