

Abstract
Atypical visual perception in people with autism spectrum disorders (ASD) is hypothesized to stem from an imbalance in excitatory and inhibitory processes in the brain. We used neuronal oscillations in the gamma frequency range (30–90 Hz), which emerge from a balanced interaction of excitation and inhibition in the brain, to assess contextual modulation processes in early visual perception. Electroencephalography was recorded in 12 high-functioning adults with ASD and 12 age- and IQ-matched control participants. Oscillations in the gamma frequency range were analyzed in response to stimuli consisting of small line-like elements. Orientation-specific contextual modulation was manipulated by parametrically increasing the amount of homogeneously oriented elements in the stimuli. The stimuli elicited a strong steady-state gamma response around the refresh-rate of 60 Hz, which was larger for controls than for participants with ASD. The amount of orientation homogeneity (contextual modulation) influenced the gamma response in control subjects, while for subjects with ASD this was not the case. The atypical steady-state gamma response to contextual modulation in subjects with ASD may capture the link between an imbalance in excitatory and inhibitory neuronal processing and atypical visual processing in ASD.
Keywords: Asperger's disorder, Gamma oscillations, EEG, Visual perception, Surround suppression, GABA
Highlights
-
•
EEG was recorded in adults with autism spectrum disorders and matched controls.
-
•
Stimuli were presented varying in orientation-specific contextual modulation.
-
•
Contextual modulation affected power of gamma oscillations for control subjects.
-
•
No such effect of contextual modulation was identified for subjects with autism.
-
•
Atypical gamma response reflects inhibition–excitation imbalance.
1. Introduction
People with autism spectrum disorders (ASD) suffer from deficits in communication, social functioning and behavioral flexibility. Less well-known is that atypical visual perception is also a characteristic feature of ASD. In general, people with ASD have a tendency to focus on details instead of perceiving the bigger picture (Dakin and Frith, 2005; Simmons et al., 2009; Behrmann et al., 2006; Boelte et al., 2007; Mottron et al., 2006). It has been speculated that atypical visual perception in people with ASD is the result of an imbalance between excitatory (glutamergic) and inhibitory (GABAergic) neurotransmitters (Hussman, 2001; Rubenstein and Merzenich, 2003; Coghlan et al., 2012). Autism has indeed been associated with pathology in GABA receptors (Fatemi et al., 2009a; Fatemi et al., 2009b) and mutations in genes encoding for GABA-A receptors (DiCicco-Bloom et al., 2006; Polleux and Lauder, 2004; van Kooten et al., 2005; Dhossche et al., 2002). Additionally, cortical minicolumns, which are important for the flow of excitatory–inhibitory information in the neocortex, have been found to be narrower in people with autism (Casanova et al., 2003; Casanova et al., 2002a; Casanova et al., 2002b; Casanova et al., 2002c).
How would an imbalance in neural excitation and inhibition lead to atypical visual perception? We think that contextual modulation, that is, the modulation of the neural response to a detail by the context in which the detail is placed, plays a crucial role. Visually responsive neurons (e.g., in the primary visual cortex) show a well-established center-surround receptive field organization, with excitatory influences of stimuli falling within the center of the receptive field, and generally inhibitory influences of stimuli falling in the immediate surround of the receptive field. Surround suppression is most prominent if center and surround stimuli share the same stimulus features, such as orientation (Blakemore and Tobin, 1972; Xing and Heeger, 2001). This type of contextual modulation has been attributed to horizontal intra-cortical connectivity within V1, as well as to feedback connections from extrastriate cortex for the far surround (Seriès et al., 2003). In ASD, an imbalance in excitatory and inhibitory neurotransmitter systems might give rise to atypical contextual modulation effects leading to atypical perception (Casanova et al., 2003; Keita et al., 2011; Bertone et al., 2005).
GABAergic neurotransmission is supposed to be critical for establishing surround suppression (Smith, 2006). Recent evidence suggests that GABA concentrations in visual cortex (as measured with MR spectroscopy) are associated with how orientation context modulates the perception of contrast, giving support for a GABAergic role in contextual modulation (Yoon et al., 2010).
GABAergic inhibitory neurons are also essential for synchronizing brain activity (Buzsaki, 2006). Gamma oscillations (30–90 Hz) emerge from a balanced interaction of excitation and inhibition in the brain (Buzsaki and Wang, 2012) and both the frequency and amplitude of oscillations in the gamma frequency range have been shown to depend on GABAergic action (Whittington et al., 1995; Brunel and Wang, 2003; Edden et al., 2009; Muthukumaraswamy et al., 2009). Mild sedation using the GABA-A agonist propofol results in an increase in amplitude of visual stimulus-induced gamma oscillations (Saxena et al., 2013). Furthermore, the integrity of GABAergic interneurons within cortical minicolumns is important for the generation of normal gamma oscillations (Whittington et al., 2000). Interestingly, atypical gamma oscillations in response to visual stimuli have been identified in people with ASD (Grice et al., 2001; Milne et al., 2009; Wright et al., 2012; Sun et al., 2012).
Therefore, examining gamma-frequency responses to visual stimulation seems like a promising method for capturing GABAergic contextual modulation in humans, as well as investigating possible atypicalities herein in ASD. Although to our knowledge there have been no electrophysiological studies which have addressed the relationship between contextual modulation and gamma oscillations in humans, recent non-human primate research indicates that increases in contextual modulation in V1 due to a larger size of a grating patch are associated with an increase in amplitude of gamma power and a decrease in gamma frequency in V1 (Gieselmann and Thiele, 2008). The current study builds on these findings to address two major outstanding questions. The first question is whether gamma oscillations in the human visual cortex (as measured with electroencephalography (EEG)) are involved in orientation-specific contextual modulation. The second: whether the gamma response to contextual modulation is different for people with ASD.
We measured EEG while we presented subjects with ASD and controls with stimuli consisting of local elements (Gabor patches) arranged into circular textures (see Fig. 1). The Gabor patches could have an orientation of 0, 45, 90, or 135° from the vertical. The amount of orientation-specific contextual modulation was implemented by parametrically increasing the number of local elements with the same orientation; the larger the amount of elements with an identical orientation, the more orientation-specific contextual modulation is expected. In the inhomogeneous (IH-25) condition, all 4 allowable orientations occurred in 25% of the Gabor patches. In the homogeneous (H-100) condition, all local elements shared the same orientation. For the intermediate condition (inter-62), one of the allowed orientations occurred in 62% of the local elements, while the rest of the orientations were equally divided over the rest of the Gabor patches.
Fig. 1.
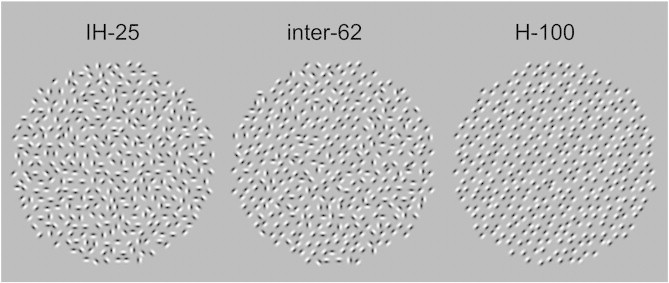
Inhomogeneous (IH-25), intermediate (inter-62), and homogeneous (H-100) example stimuli.
We hypothesize that the human gamma response to visual stimulation is affected by orientation-specific contextual modulation, reflected in increasing gamma amplitude with increasing contextual modulation (H-100 > inter-62 > IH-25). For people with ASD we expect a smaller effect of contextual modulation on gamma power than for control subjects, due to abnormalities in GABAergic neurotransmission and as such to decreased synchronization of brain activity implied in contextual modulation.
2. Material and methods
2.1. Subjects
Twenty-four healthy volunteers and nineteen subjects diagnosed with ASD participated in the experiment. Subjects were paid for their participation. The diagnostic evaluation for the subjects with ASD included a psychiatric observation and a review of prior records (developmental history, child psychiatric and psychological observations and tests). ASD was diagnosed by a child psychiatrist, using the DSM-IV criteria. The parents of all but one of the nineteen ASD subjects took part in the autism diagnostic interview-revised (ADI-R (Lord et al., 1994)) and eleven of the participants with ASD were administered the autism diagnostic observation schedule-generic (ADOS-G, (Lord et al., 1989)), both by a trained rater. Eighteen subjects met ADI-R criteria for autism or the autistic spectrum; one subject did not (this subject did, however, meet ADOS-G criteria). All of the participants who completed the ADOS-G, met the full criteria for autism or autism spectrum disorder.
In total nineteen subjects (7 subjects with ASD) were excluded from analysis because too little trials remained after artifact rejection of the EEG data (see Section 2.4). Of the 12 included subjects with ASD, 8 were diagnosed with Asperger's disorder, 3 with Autism, and 1 with PDD-NOS. Subjects with ASD and controls did not differ in terms of age or intelligence and all participants had normal or corrected to normal vision (see Table 1 for subject characteristics). As expected, ASD and control groups differed on Autism Quotient (AQ) scores (Hoekstra et al., 2008).
Table 1.
Subject characteristics of control and Autism Spectrum Disorder (ASD) groups. Means and standard deviations are given, as well as T- and p-values for differences between groups. IQ was measured with the full WAIS-III for subjects with ASD, while a short version of the WAIS-III was used to estimate IQ for the control subjects. TIQ = total scale IQ; VIQ = verbal IQ; PIQ = performance IQ; AQ = autism quotient.
| ASD group | Control group | T(22) | P | |
|---|---|---|---|---|
| Sample size | 12 | 12 | ||
| Gender | 11 male; 1 female | 11 male; 1 female | ||
| Age | 22 (4) | 22 (3) | 0.13 | .90 |
| TIQ | 115 (11) | 122 (13) | 1.29 | .21 |
| PIQ | 112 (8) | 117 (19) | 0.95 | .35 |
| VIQ | 116 (12) | 122 (10) | 1.34 | .19 |
| Acuity (logMar) | − 0.26 (0.12) | − 0.24 (0.09) | 0.31 | .76 |
| AQ | 126 (12) | 100 (13) | − 5.09 | < .001 |
The experiment was approved by the medical ethics committee of the University Medical Centre Utrecht, and all subjects gave written informed consent before participation.
2.2. Stimuli
The stimuli consisted of local elements (Gabor patches) arranged into circular textures (see Fig. 1). The diameter of the textures was 12.5° of the visual angle. The Gabor patches were single wavelength, sinusoidal gratings convolved with a Gaussian envelope filter, and were presented either in 0° or 180° phase (resulting in a mean-isoluminant image). The wavelength/diameter of the Gabor patches was 0.4° of visual angle, which corresponds to an estimate of population receptive field sizes in V1 (Dumoulin and Wandell, 2008), and the carrier spatial frequency was 2.5 cycles per degree. This spatial frequency is known to elicit clear gamma responses in visual cortex (Muthukumaraswamy and Singh, 2008). To reduce the appearance of regularity, Gabor patches were initially placed on a circular hexagonal grid (0.6° spacing) and subsequently the position of the Gabor patches was jittered in x and y coordinates up to 30% of the diameter.
The Gabor patches could have an orientation of 0, 45, 90, or 135° from the vertical. The amount of orientation-specific surround suppression was modulated by parametrically increasing the number of local elements with the same orientation. In the inhomogeneous (IH-25) condition, all 4 allowable orientations occurred in 25% of the Gabor patches. In the homogeneous (H-100) condition, all local elements shared the same orientation. For the intermediate condition (inter-62), one of the allowed orientations occurred in 62% of the local elements, while the other three orientations were equally divided over the remaining Gabor patches.
2.3. Procedure
During EEG measurement, the subjects were seated in a comfortable chair in front of a computer screen at 114 cm, in a dimly illuminated sound-attenuating booth. Stimuli were presented on the computer screen (Dell M933s 19″’ CRT monitor with 1024 × 768 resolution and 60 Hz refresh rate) using the Presentation software (www.neuro-bs.com). See Supplementary materials for measurements of luminous emittance of the monitor. Before every stimulus a light-gray fixation cross was presented on a dark-gray background for 1000–1200 ms (baseline). The stimuli were presented on the same dark-gray background, with the radius of the textures being 6.25°. Every stimulus remained on the screen for 1000–1200 ms. When the stimulus disappeared, the subjects had to press a button within 500 ms after stimulus disappearance. Subjects got feedback by means of the fixation cross turning green (correct) or red (miss/too late) for 750 ms, after which the baseline for the next trial started. Each subject completed 240 trials (3 homogeneity conditions × 4 allowable orientations × 20 stimuli for each condition–orientation combination).
Next to the experiment presented in the current paper, subjects participated in two other experiments on visual perception in the same EEG session. The order of the experiments was counterbalanced.
2.4. EEG recording and data analysis
Electroencephalographic activity was recorded with a Biosemi 64-channel Active Two EEG system (Biosemi Instrumentation BV, Amsterdam, the Netherlands), and sampled at 2048 Hz. Two electrodes in the electrode cap provided an active ground. Electro-oculogram (EOG) was recorded from electrodes above and below the eye, and at the outer canthi of the eyes. The EEG electrodes were re-referenced offline to the average of all EEG electrodes. Data were downsampled offline to 512 Hz.
Preprocessing of the EEG data was performed using Brain Vision Analyzer (Brain Products GmbH, Munich, Germany). The raw data was filtered offline with a time-constant of 1 s and a notch filter at 50 Hz. Filtered data were segmented into 2000 ms epochs ranging between 500 ms before and 1500 ms after the stimulus onset. EOG artifacts were reduced using an ocular correction algorithm described by Gratton et al. (1983). Next, a baseline correction was applied in which the waveforms were normalized relative to a 100 ms stimulus-preceding epoch, and trials containing EEG exceeding +/− 75 μV were removed. The dataset of nineteen subjects (seven subjects with ASD) were discarded because less than 40 trials of all conditions combined (< 17% of all trials) remained after artifact rejection. The minimum amount of trials per condition was 14. The average amount of kept trials for the included subjects was 51 per condition (64%), with no significant difference in amount of kept trials between groups (Controls mean 69%, range 25–98%; ASD group mean 58%, range 18–90%; p = .27). The relatively large number of discarded datasets might be explained by the fact that the experiment was part of a rather long EEG session (including two other visual perception experiments, see Section 2.3), while relatively long artifact-free epochs are needed for time–frequency analysis.
2.5. Time–frequency analysis
EEG data were exported and further analyzed using FieldTrip (http://www.ru.nl/neuroimaging/fieldtrip/), an open source MATLAB toolbox (The MathWorks, Natick, MA) for EEG and MEG analyses (Oostenveld et al., 2011).
Time–frequency representations (TFRs) were calculated for each trial using a multitaper spectral estimation method (Percival and Walden, 1993). All frequencies between 25 and 100 Hz in steps of 0.5 Hz were examined. A fixed sliding time window of ΔT = 0.5 s was used, sliding in steps of 50 ms. Frequency smoothing of plus and minus 4 Hz was obtained using multitapering. The sliding time window data was multiplied with three orthogonal Slepian tapers. Subsequently, the data was Fourier transformed and the power-spectral densities were averaged across tapers.
2.6. Control experiment to investigate entrainment to refresh rate
The experimental stimuli elicited neuronal oscillations over visual cortex at 60 Hz. As the screen refresh rate was at 60 Hz as well, we were interested to know whether the elicited gamma response was (partly) due to entrainment to the computer screen flicker. We performed a control experiment comparing the gamma response when the stimuli were presented with a screen refresh rate at 60 Hz to the gamma response when using refresh rate of 75 Hz (5 subjects, see Supplementary materials). Indeed, the gamma response to the experimental stimuli was influenced by the screen refresh rate (see Supplementary materials, Fig. S1).
2.7. Statistical analysis
To explore differences between conditions data was averaged over the 58–62 Hz frequency band. The investigated time window was 0 to 800 ms. All posterior electrodes were entered into the analysis (P1, P3, P5, P7, P9, PO7, PO3, O1, Iz, Oz, POz, Pz, P2, P4, P6, P8, P10, PO8, PO4, O2).
To assess the parametric modulation we conducted two repeated contrast analyses, comparing inter-62 with IH-25, and comparing H-100 with inter-62. We did this in a 2-step mixed design procedure. At the first-level, for every subject the difference in power between conditions (as defined by the repeated contrasts) was first quantified within each subject over trials by means of a t-test (testing for differences between the trials of the two conditions, within the specific subject, for every electrode and time point). Subsequently, the T-values were converted to z-values (SPM2, http://www.fil.ion.ucl.ac.uk/spm). In this way the power values were normalized and the contribution of subjects with a large variance was reduced (see (Nieuwenhuis et al., 2008; van Dijk et al., 2010) for a similar procedure).
Then, at the second-level, z-values were (1) tested to be different from 0 over subjects for both groups combined to evaluate the main condition effects and (2) compared between groups (ASD vs Controls) to assess the interaction between group and condition. To correct for multiple comparisons (i.e., 20 EEG electrodes × 17 time points) a nonparametric cluster-randomization test was used (Maris and Oostenveld, 2007): First, all (electrode, time point) pairs were identified for which the T/z-value for the effect of interest exceeded a prior threshold (p < .05). Spatially and/or temporally contiguous electrode-time point pairs that exceeded the threshold were then grouped into clusters. The cluster-level test statistic is the sum of the T values within each cluster. In a second step, the observed cluster-level test statistic was compared to a randomization null distribution of the cluster-level test statistic assuming no difference between conditions. This randomization null distribution was obtained by randomly permuting the data of the two experimental groups 1000 times. The Monte Carlo p-value was determined as the proportion from this randomization null distribution in which the maximum cluster-level test statistic exceeded the observed cluster-level test. This is, with 1000 draws, a good estimate of the true p value. In brief, the cluster randomization p-value denotes the probability that such a large summed cluster-level statistic would be observed when there is actually no effect.
When significant clusters were found identifying a condition ∗ group interaction, separate cluster randomization analyses were performed for the ASD group and the Control group on the mean TFR z-values of the identified time window (now clustering only over electrodes, and not over time). Here z-values were again tested to be different from 0 over subjects (higher than 1.96 or lower than − 1.96), to identify significant condition effects per group.
To assess the main effect of group, at within-subject level the power mean of the three conditions was compared to zero for all electrodes and time points (after baseline correction with an absolute baseline of 300–100 ms before stimulus onset), and T-values were converted to z-values. Then, at the second level, z-values for the ASD group and the control group were compared (using clustering algorithm over time and electrodes as above).
3. Results
3.1. Behavior
The groups did not differ in their performance on the simple attention task performed during the experiment, neither in the percentage of correct responses (T(22) = .45, p = .66; percentage correct: Controls 93.4% (SD 5.1); subjects with ASD 92.4% (SD 5.9)), nor in reaction time (T(22) = .19, p = .85; mean RT: Controls 252 ms (SD 35 ms); subjects with ASD 249 ms (SD 41 ms).
3.2. Gamma response to experimental stimuli
The experimental stimuli elicited a clear steady-state evoked gamma response at 60 Hz over parieto-occipital electrodes, for both controls (p < .001) and subjects with ASD (p < .001). The increase in gamma power at 60 Hz compared to baseline was larger for controls than for subjects with ASD (main effect of group, p = .023, cluster at electrodes P1, P3, PO7, PO3, P2, P5, P9, and O1; see Fig. 2).
Fig. 2.
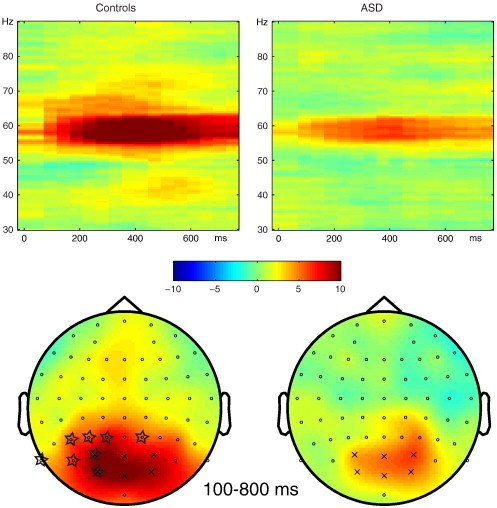
Normalized gamma power elicited by the experimental stimuli (all conditions combined) compared to an absolute baseline of 300–100 ms before stimulus onset, for controls (left) and subjects with autism spectrum disorders (ASD, right). Color codes represent z-values. Top: time–frequency representation averaged over six parieto-occipital electrodes (PO3, O1, Oz, POz, PO4, O2, shown with ‘x’ in lower panel). Bottom: topography of the effect of stimulus presentation, at 58–62 Hz, 100–800 ms after stimulus onset. Starred electrodes showed a larger effect in control subjects compared to subjects with ASD (p = .023, corrected for multiple comparisons with cluster randomization routine).
The group effect could not be explained by differences in baseline gamma power, as no difference in gamma power between groups was identified in the pre-stimulus baseline period of 300–100 ms (p > .05).
3.3. Contextual modulation effect
Fig. 3 shows the gamma response elicited by the three different conditions for subjects with ASD and controls. To explore the contextual modulation effect, first the normalized difference in gamma power (58–62 Hz) between inter-62 and IH-25 was tested to be different from 0 for both groups combined. An increase in gamma power was identified from 300 to 700 ms at electrodes O1, Oz, POz, and O2 (cluster-p = .041).
Fig. 3.
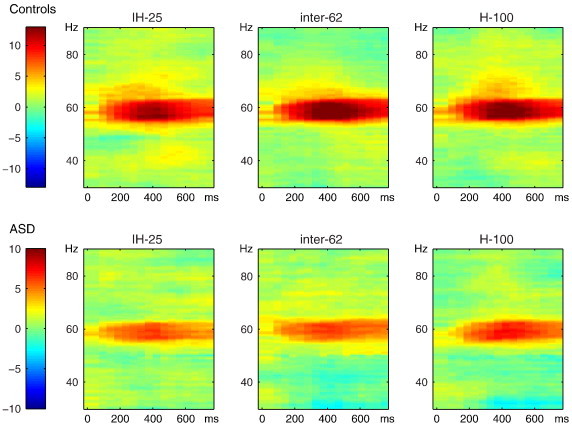
Time–frequency representation for the three different contextual-modulation conditions (inhomogeneous IH-25, intermediate inter-62, and homogeneous H-100) for control subjects (top) and subjects with autism spectrum disorders (ASD, bottom). Gamma power is compared to an absolute baseline of 300–100 ms before stimulus onset, and averaged over six parieto-occipital electrodes (PO3, O1, Oz, POz, PO4, O2, shown with ‘x’ in Fig. 2). Color codes represent z-values. (For interpretation of the references to color in this figure legend, the reader is referred to the web version of this article.)
Secondly, the normalized difference in power between inter-62 and IH-25 was compared between groups (ASD vs Controls, condition ∗ group effect). There was a marginally significant cluster identified from 250 to 650 ms (p = 0.053), including electrodes P1, P3, Oz, POz, P2, PO8, PO4, and O2. Subsequently, the mean TFR z-values for 250–650 ms were tested for both groups separately. For the Control group, stimuli in the inter-62 condition elicited more 60 Hz power than stimuli in the IH-25 condition (cluster at electrodes Oz, POz, PO4 and O2, p = .018; see Fig. 4). No difference was found between inter-62 and IH-25 stimuli in the ASD group (no clusters identified). Fig. 4 shows the average effect from 250 to 650 ms for both groups.
Fig. 4.
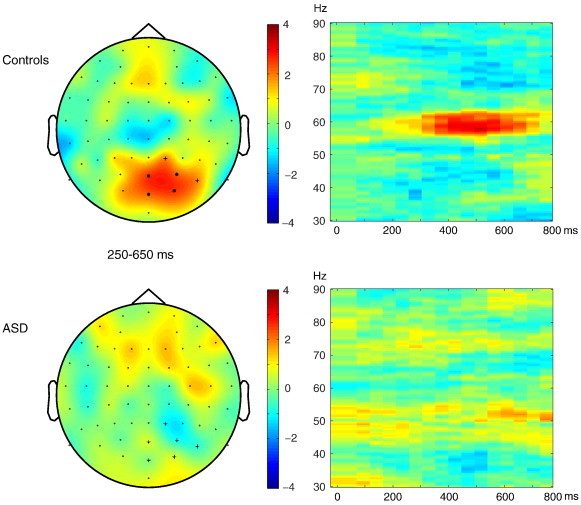
Normalized power difference for inter-62 compared to IH-25 conditions for controls (upper panel) and subjects with autism spectrum disorders (ASD, lower panel). Color codes represent z-values. Left: topography of the effect at 58–62 Hz, 250–650 ms after stimulus onset. Electrodes showing a significant effect in control subjects are marked with * (p < .05 corrected for multiple comparisons with cluster randomization routine). Right: time–frequency representation of the effect averaged over electrodes showing a group difference (marked with + in left panel). (For interpretation of the references to color in this figure legend, the reader is referred to the web version of this article.)
The normalized difference in power between H-100 and inter-62 was not different between groups (condition ∗ group effect, smallest cluster-p = .49). Furthermore, the z-values for the H-100 compared to the inter-62 condition did not differ from zero (smallest cluster-p = .23).
Thus, increasing homogeneity in Gabor orientation from 25 to 62% resulted in an increase in 60-Hz power for the Control group, but not for the ASD group. Increasing the orientation homogeneity from 62 to 100% did not result in a further 60-Hz power increase.
4. Discussion
Starting point of this study was the hypothesis that people with ASD experience atypical contextual modulation in vision as a result of an atypical excitatory–inhibitory balance in the brain. We were interested in whether people with ASD show atypical contextual modulation of the gamma-frequency response recorded with EEG, as gamma oscillations emerge from a balanced interaction of excitation and inhibition in the brain (Buzsaki and Wang, 2012), and atypical gamma responses to visual stimuli have previously been identified in people with autism (Grice et al., 2001; Milne et al., 2009; Wright et al., 2012; Sun et al., 2012). We manipulated the amount of orientation–homogeneity in textures to tap into orientation-specific center-surround interactions in early visual areas. We investigated whether these contextual modulation processes induced an amplitude increase in oscillations in the gamma frequency range. Indeed, an increase in steady-state evoked gamma power over parieto-occipital electrodes was found in control subjects for textures with more homogeneously oriented local elements (62% homogeneity vs 25% iso-orientation). This increase reached a ceiling in the sense that no further increase was seen from 62% to 100% homogeneity. The gamma-power increase with increasing contextual modulation was identified only in our control sample, while no such gamma response for contextual modulation was seen for subjects with ASD (condition ∗ group interaction).
Our results are in line with previous studies suggesting that atypical visual perception in ASD is related to impaired lateral connectivity within primary visual areas (Casanova et al., 2003; Keita et al., 2011; Vandenbroucke et al., 2008). Lateral (horizontal intra-cortical) connectivity is important for contextual modulation processes in V1 (Seriès et al., 2003). Furthermore, orientation-specific surround suppression has been linked to GABA concentrations in visual cortex (Yoon et al., 2010). The atypical gamma response to contextual modulation that we identified can be seen as the link between the behavioral output (atypical visual perception) and the underlying brain mechanism (an imbalance in excitatory and inhibitory neuronal processing). The impaired inhibition–excitation balance is suggested to be part of the core etiological pathway of ASD (Ecker et al., 2013). Gamma oscillations emerge from interactions between neuronal excitation and inhibition (Buzsaki and Wang, 2012), are important for neuronal communication (Fries, 2009), and have been associated with e.g., perceptual grouping mechanisms (Singer, 1999).
The gamma response to our experimental stimuli was influenced by the screen refresh rate. All oscillatory systems, including those in the brain, display resonance behavior: they oscillate more strongly in their preferred frequency (Zaehle et al., 2010). Also for visual stimulation such neural entrainment processes have been found (Regan, 1977; Herrmann, 2001), with stimulation around 60 Hz resulting in a large entrained response (Regan, 1977; Veit et al., 2011). Intracranial electrophysiological studies have shown that neurons in LGN and V1 entrain to a 60/70 Hz video refresh rate when high contrast patterns are on the screen, both in macaques (Williams et al., 2004) and humans (Krolak-Salmon et al., 2003). Thus, the increase in gamma activity around 60 Hz, that we identified in response to the textured Gabor stimuli, is probably a result of activity of entrained neurons in LGN/early visual cortex, oscillating at their resonance frequency. In the entrained state, contextual modulation processes can have an effect at the entrained frequency of 60 Hz. For the controls, the gamma response was related to the amount of orientation homogeneity, with an increase in gamma power for intermediate versus inhomogeneous displays.
As mentioned in the Introduction section, spontaneous gamma oscillations have been linked to GABAergic action. Would the link between GABA and gamma hold for entrained oscillations? Indeed, GABA modulates steady-state responses in the auditory domain (Vohs et al., 2010; Vierling-Claassen et al., 2008). A similar mechanism will probably be at work in the visual domain. We suggest that the contextual modulation effect that we identified in the gamma response for control subjects is resulting from GABAergic processes in early visual brain areas.
It is interesting to note that in the auditory domain reduced auditory steady-state response in the gamma frequency range (40 Hz) have been found in children with ASD (Wilson et al., 2007) as well as their first degree relatives (Rojas et al., 2008; Rojas et al., 2011). At lower frequencies decreased visual steady-state responses have been found in people with ASD (Lazarev and Pontes, 2009). We now find a reduced entrained gamma response in the visual domain for subjects with ASD compared to controls. An alternative interpretation of our contextual modulation results might be that as people with ASD show less visual entrainment, there can be no (or less) modulation by context. However, although the gamma response is smaller than controls, people with ASD do show a strong gamma increase in response to the experimental stimuli, giving opportunity for a possible contextual modulation effect hereon. An imbalance in excitation–inhibition in the autistic brain would probably result in both an atypical general gamma response, and an atypical gamma response to contextual modulation.
Effects in the gamma-frequency range have been related to saccadic eye-movements (Yuval-Greenberg et al., 2008). We do not think it likely that saccadic eye-movements cause the gamma effects we find in the current study, as gamma effects related to saccadic eye-movements are usually more broadband in frequency (Yuval-Greenberg et al., 2008). Indeed, no differences between groups were identified in the EOG signal (p > .05).
5. Conclusion
In conclusion, we have found an increase in oscillations in the gamma frequency range for stimuli that elicit more orientation-specific contextual modulation (i.e., contain a larger amount of homogeneously oriented local elements). This increase of the gamma response with contextual modulation was seen for controls, but not for subjects with ASD. We suggest that this atypical gamma response for contextual modulation in subjects with ASD is a result of atypical GABAergic processes, reflecting an imbalance between excitatory and inhibitory processes in the brain in subjects with ASD.
Acknowledgments
This work was supported by a Netherlands Organization for Scientific Research (NWO) VICI grant (45307004). We thank all participants of the study, as well as Emmie van Schaffelaar, Manje Brinkhuis, and Peter de Best for their assistance with participant recruitment and data measurement, and Gert Camfferman for lux measurements.
Footnotes
This is an open-access article distributed under the terms of the Creative Commons Attribution-NonCommercial-ShareAlike License, which permits non-commercial use, distribution, and reproduction in any medium, provided the original author and source are credited.
Contributor Information
Tineke M. Snijders, Email: t.snijders@donders.ru.nl.
Branka Milivojevic, Email: b.milivojevic@donders.ru.nl.
Chantal Kemner, Email: c.kemner@umcutrecht.nl.
Appendix A. Supplementary data
Supplementary material.
References
- Behrmann M., Thomas C., Humphreys K. Seeing it differently: visual processing in autism. Trends in Cognitive Sciences. 2006;10:258–264. doi: 10.1016/j.tics.2006.05.001. [DOI] [PubMed] [Google Scholar]
- Bertone A., Mottron L., Jelenic P., Faubert J. Enhanced and diminished visuo-spatial information processing in autism depends on stimulus complexity. Brain. 2005;128:2430–2441. doi: 10.1093/brain/awh561. [DOI] [PubMed] [Google Scholar]
- Blakemore C., Tobin E.A. Lateral inhibition between orientation detectors in cat's visual cortex. Experimental Brain Research. 1972;15:439–440. doi: 10.1007/BF00234129. [DOI] [PubMed] [Google Scholar]
- Boelte S., Holtmann M., Poustka F., Scheurich A., Schmidt L. Gestalt perception and local–global processing in high-functioning autism. Journal of Autism and Developmental Disorders. 2007;37:1493–1504. doi: 10.1007/s10803-006-0231-x. [DOI] [PubMed] [Google Scholar]
- Brunel N., Wang X.J. What determines the frequency of fast network oscillations with irregular neural discharges? I. Synaptic dynamics and excitation–inhibition balance. Journal of Neurophysiology. 2003;90:415–430. doi: 10.1152/jn.01095.2002. [DOI] [PubMed] [Google Scholar]
- Buzsaki G. Oxford University Press; New York: 2006. Rhythms of the Brain. [Google Scholar]
- Buzsaki G., Wang X.-J. Mechanisms of gamma oscillations. Annual Review of Neuroscience. 2012;35:203–225. doi: 10.1146/annurev-neuro-062111-150444. [DOI] [PMC free article] [PubMed] [Google Scholar]
- Casanova M.F., Buxhoeveden D.P., Switala A.E., Roy E. Neuronal density and architecture (gray level index) in the brains of autistic patients. Journal of Child Neurology. 2002;17:515–521. doi: 10.1177/088307380201700708. [DOI] [PubMed] [Google Scholar]
- Casanova M.F., Buxhoeveden D.P., Switala A.E., Roy E. Minicolumnar pathology in autism. Neurology. 2002;58:428–432. doi: 10.1212/wnl.58.3.428. [DOI] [PubMed] [Google Scholar]
- Casanova M.F., Buxhoeveden D.P., Switala A.E., Roy E. Asperger's syndrome and cortical neuropathology. Journal of Child Neurology. 2002;17:142–145. doi: 10.1177/088307380201700211. [DOI] [PubMed] [Google Scholar]
- Casanova M.F., Buxhoeveden D., Gomez J. Disruption in the inhibitory architecture of the cell minicolumn: implications for autisim. The Neuroscientist. 2003;9:496–507. doi: 10.1177/1073858403253552. [DOI] [PubMed] [Google Scholar]
- Coghlan S., Horder J., Inkster B., Mendez M.A., Murphy D.G.M., Nutt D.J. GABA system dysfunction in autism and related disorders: from synapse to symptoms. Neuroscience and Biobehavioral Reviews. 2012;36:2044–2055. doi: 10.1016/j.neubiorev.2012.07.005. [DOI] [PMC free article] [PubMed] [Google Scholar]
- Dakin S., Frith U. Vagaries of visual perception in autism. Neuron. 2005;48:497–507. doi: 10.1016/j.neuron.2005.10.018. [DOI] [PubMed] [Google Scholar]
- Dhossche D., Applegate H., Abraham A., Maertens P., Bland L., Bencsath A., Martinez J. Elevated plasma gamma-aminobutyric acid (GABA) levels in autistic youngsters: stimulus for a GABA hypothesis of autism. Medical Science Monitor. 2002;8:PR1–PR6. [PubMed] [Google Scholar]
- DiCicco-Bloom E., Lord C., Zwaigenbaum L., Courchesne E., Dager S.R., Schmitz C., Schultz R.T., Crawley J., Young L.J. The developmental neurobiology of autism spectrum disorder. The Journal of Neuroscience. 2006;26:6897–6906. doi: 10.1523/JNEUROSCI.1712-06.2006. [DOI] [PMC free article] [PubMed] [Google Scholar]
- Dumoulin S.O., Wandell B.A. Population receptive field estimates in human visual cortex. NeuroImage. 2008;39:647–660. doi: 10.1016/j.neuroimage.2007.09.034. [DOI] [PMC free article] [PubMed] [Google Scholar]
- Ecker C., Spooren W., Murphy D.G.M. Translational approaches to the biology of autism: false dawn or a new era? Molecular Psychiatry. 2013;18:435–442. doi: 10.1038/mp.2012.102. [DOI] [PMC free article] [PubMed] [Google Scholar]
- Edden R.A.E., Muthukumaraswamy S.D., Freeman T.C.A., Singh K.D. Orientation discrimination performance is predicted by GABA concentration and gamma oscillation frequency in human primary visual cortex. The Journal of Neuroscience. 2009;29:15721–15726. doi: 10.1523/JNEUROSCI.4426-09.2009. [DOI] [PMC free article] [PubMed] [Google Scholar]
- Fatemi S.H., Folsom T.D., Reutiman T.J., Thuras P.D. Expression of GABA(B) receptors is altered in brains of subjects with autism. Cerebellum. 2009;8:64–69. doi: 10.1007/s12311-008-0075-3. [DOI] [PMC free article] [PubMed] [Google Scholar]
- Fatemi S.H., Reutiman T.J., Folsom T.D., Thuras P.D. GABA(A) receptor downregulation in brains of subjects with autism. Journal of Autism and Developmental Disorders. 2009;39:223–230. doi: 10.1007/s10803-008-0646-7. [DOI] [PMC free article] [PubMed] [Google Scholar]
- Fries P. Neuronal gamma-band synchronization as a fundamental process in cortical computation. Annual Review of Neuroscience. 2009;32:209–224. doi: 10.1146/annurev.neuro.051508.135603. [DOI] [PubMed] [Google Scholar]
- Gieselmann M.A., Thiele A. Comparison of spatial integration and surround suppression characteristics in spiking activity and the local field potential in macaque V1. European Journal of Neuroscience. 2008;28:447–459. doi: 10.1111/j.1460-9568.2008.06358.x. [DOI] [PubMed] [Google Scholar]
- Gratton G., Coles M.G.H., Donchin E. A new method for off-line removal of ocular artifact. Electroencephalography and Clinical Neurophysiology. 1983;55:468–484. doi: 10.1016/0013-4694(83)90135-9. [DOI] [PubMed] [Google Scholar]
- Grice S.J., Spratling M.W., Karmiloff-Smith A., Halit H., Csibra G., de Haan M., Johnson M.H. Disordered visual processing and oscillatory brain activity in autism and Williams Syndrome. NeuroReport. 2001;12:2697–2700. doi: 10.1097/00001756-200108280-00021. [DOI] [PubMed] [Google Scholar]
- Herrmann C.S. Human EEG responses to 1–100 Hz flicker: resonance phenomena in visual cortex and their potential correlation to cognitive phenomena. Experimental Brain Research. 2001;137:346–353. doi: 10.1007/s002210100682. [DOI] [PubMed] [Google Scholar]
- Hoekstra R.A., Bartels M., Cath D.C., Boomsma D.I. Factor structure, reliability and criterion validity of the autism-spectrum quotient (AQ): a study in dutch population and patient groups. Journal of Autism and Developmental Disorders. 2008;38:1555–1566. doi: 10.1007/s10803-008-0538-x. [DOI] [PMC free article] [PubMed] [Google Scholar]
- Hussman J.P. Suppressed GABAergic inhibition as a common factor in suspected etiologies of autism. Journal of Autism and Developmental Disorders. 2001;31:247–248. doi: 10.1023/a:1010715619091. [DOI] [PubMed] [Google Scholar]
- Keita L., Mottron L., Dawson M., Bertone A. Atypical lateral connectivity: a neural basis for altered visuospatial processing in autism. Biological Psychiatry. 2011;70:806–811. doi: 10.1016/j.biopsych.2011.07.031. [DOI] [PubMed] [Google Scholar]
- Krolak-Salmon P., Henaff M.A., Tallon-Baudry C., Yvert B., Guenot M., Vighetto A., Mauguiere F., Bertrand O. Human lateral geniculate nucleus and visual cortex respond to screen flicker. Annals of Neurology. 2003;53:73–80. doi: 10.1002/ana.10403. [DOI] [PubMed] [Google Scholar]
- Lazarev V.V., Pontes A., deAzevedo L.C. EEG photic driving: right-hemisphere reactivity deficit in childhood autism. A pilot study. International Journal of Psychophysiology. 2009;17:177–183. doi: 10.1016/j.ijpsycho.2008.08.008. [DOI] [PubMed] [Google Scholar]
- Lord C., Rutter M., Goode S., Heemsbergen J., Jordan H., Mawhood L., Schopler E. Autism diagnostic observation schedule: a standardized observation of communicative and social behavior. Journal of Autism and Developmental Disorders. 1989;19:185–212. doi: 10.1007/BF02211841. [DOI] [PubMed] [Google Scholar]
- Lord C., Rutter M., Le Couteur A. Autism Diagnostic Interview-Revised: a revised version of a diagnostic interview for caregivers of individuals with possible pervasive developmental disorders. Journal of Autism and Developmental Disorders. 1994;24:659–685. doi: 10.1007/BF02172145. [DOI] [PubMed] [Google Scholar]
- Maris E., Oostenveld R. Nonparametric statistical testing of EEG- and MEG-data. Journal of Neuroscience Methods. 2007;164:177–190. doi: 10.1016/j.jneumeth.2007.03.024. [DOI] [PubMed] [Google Scholar]
- Milne E., Scope A., Pascalis O., Buckley D., Makeig S. Independent component analysis reveals atypical electroencephalographic activity during visual perception in individuals with autism. Biological Psychiatry. 2009;65:22–30. doi: 10.1016/j.biopsych.2008.07.017. [DOI] [PubMed] [Google Scholar]
- Mottron L., Dawson M., Soulieres I., Hubert B., Burack J. Enhanced perceptual functioning in autism: an update, and eight principles of autistic perception. Journal of Autism and Developmental Disorders. 2006;36:27–43. doi: 10.1007/s10803-005-0040-7. [DOI] [PubMed] [Google Scholar]
- Muthukumaraswamy S.D., Singh K.D. Spatiotemporal frequency tuning of BOLD and gamma band MEG responses compared in primary visual cortex. NeuroImage. 2008;40:1552–1560. doi: 10.1016/j.neuroimage.2008.01.052. [DOI] [PubMed] [Google Scholar]
- Muthukumaraswamy S.D., Edden R.A.E., Jones D.K., Swettenham J.B., Singh K.D. Resting GABA concentration predicts peak gamma frequency and fMRI amplitude in response to visual stimulation in humans. Proceedings of the National Academy of Sciences of the United States of America. 2009;106:8356–8361. doi: 10.1073/pnas.0900728106. [DOI] [PMC free article] [PubMed] [Google Scholar]
- Nieuwenhuis I.L.C., Takashima A., Oostenveld R., Fernandez G., Jensen O. Visual areas become less engaged in associative recall following memory stabilization. NeuroImage. 2008;40:1319–1327. doi: 10.1016/j.neuroimage.2007.12.052. [DOI] [PubMed] [Google Scholar]
- Oostenveld R., Fries P., Maris E., Schoffelen J.-M. FieldTrip: open source software for advanced analysis of MEG, EEG, and invasive electrophysiological data. Computational Intelligence and Neuroscience. 2011:9 pages. doi: 10.1155/2011/156869. [DOI] [PMC free article] [PubMed] [Google Scholar]
- Percival D.B., Walden A.T. Cambridge University Press; Cambridge, UK: 1993. Spectral Analysis for Physical Applications: Multitaper and Conventional Univariate Techniques. [Google Scholar]
- Polleux F., Lauder J.M. Toward a developmental neurobiology of autism. Mental Retardation and Developmental Disabilities Research Reviews. 2004;10:303–317. doi: 10.1002/mrdd.20044. [DOI] [PubMed] [Google Scholar]
- Regan D. Steady-state evoked-potentials. Journal of the Optical Society of America. 1977;67:1475–1489. doi: 10.1364/josa.67.001475. [DOI] [PubMed] [Google Scholar]
- Rojas D.C., Maharajh K., Teale P., Rogers S.J. Reduced neural synchronization of gamma-band MEG oscillations in first-degree relatives of children with autism. BMC Psychiatry. 2008;8 doi: 10.1186/1471-244X-8-66. [DOI] [PMC free article] [PubMed] [Google Scholar]
- Rojas D.C., Teale P.D., Maharajh K., Kronberg E., Youngpeter K., Wilson L.B., Wallace A., Hepburn S. Transient and steady-state auditory gamma-band responses in first-degree relatives of people with autism spectrum disorder. Molecular Autism. 2011;2 doi: 10.1186/2040-2392-2-11. [DOI] [PMC free article] [PubMed] [Google Scholar]
- Rubenstein J.L.R., Merzenich M.M. Model of autism: increased ratio of excitation/inhibition in key neural systems. Genes, Brain, and Behavior. 2003;2:255–267. doi: 10.1034/j.1601-183x.2003.00037.x. [DOI] [PMC free article] [PubMed] [Google Scholar]
- Saxena N., Muthukumaraswamy S.D., Diukova A., Singh K., Hall J., Wise R. Enhanced stimulus-induced gamma activity in humans during propofol-induced sedation. PLoS One. 2013;8:e57685. doi: 10.1371/journal.pone.0057685. [DOI] [PMC free article] [PubMed] [Google Scholar]
- Seriès P., Lorenceau J., Frégnac Y. The “silent” surround of V1 receptive fields: theory and experiments. Journal of Physiology, Paris. 2003;97:453–474. doi: 10.1016/j.jphysparis.2004.01.023. [DOI] [PubMed] [Google Scholar]
- Simmons D.R., Robertson A.E., McKay L.S., Toal E., McAleer P., Pollick F.E. Vision in autism spectrum disorders. Vision Research. 2009;49:2705–2739. doi: 10.1016/j.visres.2009.08.005. [DOI] [PubMed] [Google Scholar]
- Singer W. Neuronal synchrony: a versatile code for the definition of relations? Neuron. 1999;24:49–65. doi: 10.1016/s0896-6273(00)80821-1. [DOI] [PubMed] [Google Scholar]
- Smith M.A. Surround suppression in the early visual system. The Journal of Neuroscience. 2006;26:3624–3625. doi: 10.1523/JNEUROSCI.0236-06.2006. [DOI] [PMC free article] [PubMed] [Google Scholar]
- Sun L., Gruetzner C., Boelte S., Wibral M., Tozman T., Schlitt S., Poustka F., Singer W., Freitag C.M., Uhlhaas P.J. Impaired gamma-band activity during perceptual organization in adults with autism spectrum disorders: evidence for dysfunctional network activity in frontal–posterior cortices. The Journal of Neuroscience. 2012;32:9563–9573. doi: 10.1523/JNEUROSCI.1073-12.2012. [DOI] [PMC free article] [PubMed] [Google Scholar]
- van Dijk H., van der Werf J., Mazaheri A., Medendorp W.P., Jensen O. Modulations in oscillatory activity with amplitude asymmetry can produce cognitively relevant event-related responses. Proceedings of the National Academy of Sciences of the United States of America. 2010;107:900–905. doi: 10.1073/pnas.0908821107. [DOI] [PMC free article] [PubMed] [Google Scholar]
- van Kooten L.A.J., Hof P.R., van Engeland H., Steinbusch H.W.M., Patterson P.H., Schmitz C. Autism: neuropathology, alterations of the GABAergic system, and animal models. International Review of Neurobiology. 2005;71:1–26. doi: 10.1016/s0074-7742(05)71001-1. [DOI] [PubMed] [Google Scholar]
- Vandenbroucke M.W.G., Scholte H.S., van Engeland H., Lamme V.A.F., Kemner C. A neural substrate for atypical low-level visual processing in autism spectrum disorder. Brain. 2008;131:1013–1024. doi: 10.1093/brain/awm321. [DOI] [PubMed] [Google Scholar]
- Veit J., Bhattacharyya A., Kretz R., Rainer G. Neural response dynamics of spiking and local field potential activity depend on CRT monitor refresh rate in the tree shrew primary visual cortex. Journal of Neurophysiology. 2011;106:2303–2313. doi: 10.1152/jn.00388.2011. [DOI] [PubMed] [Google Scholar]
- Vierling-Claassen D., Siekmeier P., Stufflebeam S., Kopell N. Modeling GABA alterations in schizophrenia: a link between impaired inhibition and altered gamma and beta range auditory entrainment. Journal of Neurophysiology. 2008;99:2656–2671. doi: 10.1152/jn.00870.2007. [DOI] [PMC free article] [PubMed] [Google Scholar]
- Vohs J.L., Chambers R.A., Krishnan G.P., O'Donnell B.F., Berg S., Morzorati S.L. GABAergic modulation of the 40 Hz auditory steady-state response in a rat model of schizophrenia. The International Journal of Neuropsychopharmacology. 2010;13:487–497. doi: 10.1017/S1461145709990307. [DOI] [PMC free article] [PubMed] [Google Scholar]
- Whittington M.A., Traub R.D., Jefferys J.G.R. Synchronized oscillations in interneuron networks driven by metabotropic glutamate-receptor activation. Nature. 1995;373:612–615. doi: 10.1038/373612a0. [DOI] [PubMed] [Google Scholar]
- Whittington M.A., Traub R.D., Kopell N., Ermentrout B., Buhl E.H. Inhibition-based rhythms: experimental and mathematical observations on network dynamics. International Journal of Psychophysiology. 2000;38:315–336. doi: 10.1016/s0167-8760(00)00173-2. [DOI] [PubMed] [Google Scholar]
- Williams P.E., Mechler F., Gordon J., Shapley R., Hawken M.J. Entrainment to video displays in primary visual cortex of macaque and humans. The Journal of Neuroscience. 2004;24:8278–8288. doi: 10.1523/JNEUROSCI.2716-04.2004. [DOI] [PMC free article] [PubMed] [Google Scholar]
- Wilson T.W., Rojas D.C., Reite M.L., Teale P.D., Rogers S.J. Children and adolescents with autism exhibit reduced MEG steady-state gamma responses. Biological Psychiatry. 2007;62:192–197. doi: 10.1016/j.biopsych.2006.07.002. [DOI] [PMC free article] [PubMed] [Google Scholar]
- Wright B., Alderson-Day B., Prendergast G., Bennett S., Jordan J., Whitton C., Gouws A., Jones N., Attur R., Tomlinson H., Green G. Gamma activation in young people with autism spectrum disorders and typically-developing controls when viewing emotions on faces. PLoS One. 2012;7 doi: 10.1371/journal.pone.0041326. [DOI] [PMC free article] [PubMed] [Google Scholar]
- Xing J., Heeger D.J. Measurement and modeling of center-surround suppression and enhancement. Vision Research. 2001;41:571–583. doi: 10.1016/s0042-6989(00)00270-4. [DOI] [PubMed] [Google Scholar]
- Yoon J.H., Maddock R.J., Rokem A., Silver M.A., Minzenberg M.J., Ragland J.D., Carter C.S. GABA concentration is reduced in visual cortex in schizophrenia and correlates with orientation-specific surround suppression. The Journal of Neuroscience. 2010;30:3777–3781. doi: 10.1523/JNEUROSCI.6158-09.2010. [DOI] [PMC free article] [PubMed] [Google Scholar]
- Yuval-Greenberg S., Tomer O., Keren A.S., Nelken I., Deouell L.Y. Transient induced gamma-band response in EEG as a manifestation of miniature saccades. Neuron. 2008;58:429–441. doi: 10.1016/j.neuron.2008.03.027. [DOI] [PubMed] [Google Scholar]
- Zaehle T., Lenz D., Ohl F.W., Herrmann C.S. Resonance phenomena in the human auditory cortex: individual resonance frequencies of the cerebral cortex determine electrophysiological responses. Experimental Brain Research. 2010;203:629–635. doi: 10.1007/s00221-010-2265-8. [DOI] [PubMed] [Google Scholar]
Associated Data
This section collects any data citations, data availability statements, or supplementary materials included in this article.
Supplementary Materials
Supplementary material.