

Abstract
Fibromyalgia syndrome is a chronic pain disorder characterised by widespread pain and tenderness in muscles and deep tissues. Current theories regarding the pathophysiological origins of fibromyalgia syndrome point towards central sensitisation and a decreased capacity of descending nociceptive controls. Morphological alterations to subcortical brain regions may contribute to such pathophysiological mechanisms, and to pain and other symptoms seen in fibromyalgia. Therefore, we evaluated geometric differences in subcortical structures in fibromyalgia patients relative to healthy people using a novel method of shape analysis. Sixteen female fibromyalgia patients and 15 age and sex matched, healthy control subjects underwent high-resolution T1-weighted magnetic resonance image scanning. Data was analysed using shape analysis of 15 subcortical regions and standard voxel-based morphometry analysis.
Fibromyalgia syndrome patients, relative to healthy control participants, exhibited alterations to the shape of the left lateral aspect of the lower brainstem (medulla). The mean total volume of the brainstem was also found to be significantly reduced in the patient group compared to healthy control subjects, and this brainstem volume reduction in patient group significantly correlated with clinical manual tender point scale scores. Voxel-based morphometry analysis revealed that patients also demonstrated decreased local grey matter volumes in the brainstem (pons) and left precuneus, and increased grey matter volumes in bilateral primary somatosensory cortices.
Results suggest that the volume reduction and associated geometric shape alterations seen in the brainstem of the patient group may contribute to sensitivity to pressure pain in fibromyalgia syndrome. This finding may be due to structure-related deficiencies in regions subserving descending nociceptive control.
Highlights
-
•
Fibromyalgia syndrome patients exhibited shape alterations in the brainstem.
-
•
The mean brainstem volume was also significantly reduced in FMS patients.
-
•
This volume reduction correlated with clinical manual tender point scores.
-
•
Structural alterations in the brainstem may contribute to clinical symptoms of FMS.
1. Introduction
Fibromyalgia syndrome (FMS) is a chronic pain disorder characterised by widespread pain and tenderness, morning stiffness, sleep disturbance and fatigue (Bennett et al., 2007; Wolfe et al., 1990). FMS patients also demonstrate hyperalgesia and allodynia and cognitive deficits (Clauw, 2009) and dysfunctional postural control (Jones et al., 2011). The disorder is often co-morbid with other diagnoses such as chronic fatigue syndrome, temporomandibular joint disorder and irritable bowel syndrome (Clauw, 2009). In 1990, the American College of Rheumatology (ACR) empirically defined FMS as pain during manual palpation of at least 11 out of 18 designated tender points and affecting all 4 quadrants of the body for a period of at least three months (Wolfe et al., 1990). A more recent ACR criterion, without a need for a physical examination, classifies FMS patients according to widespread pain index and symptom severity scores (Wolfe et al., 2010).
As alterations to central processing of somatosensory stimuli may influence symptoms of FMS (Clauw et al., 2011), studies have previously utilised voxel based morphometry (VBM) to investigate structural grey matter differences in FMS patients relative to healthy control subjects (Burgmer et al., 2009; Kuchinad et al., 2007; Luerding et al., 2008; Lutz et al., 2008; Robinson et al., 2011; Schmidt-Wilcke et al., 2007; Valet et al., 2009). FMS patients have demonstrated local grey matter density reductions in cingulate, insular cortices, medial frontal cortices, parahippocampal gyri (Kuchinad et al., 2007), superior temporal gyrus and left posterior thalamus (Schmidt-Wilcke et al., 2007). Grey matter density increases were shown in the left orbitofrontal cortex, cerebellum and bilateral striatum (Schmidt-Wilcke et al., 2007). Analyses excluding age and depression identified reduced grey matter volumes in prefrontal, cingulate and insular cortices of FMS patients (Valet et al., 2009), although an alternative study suggested that alterations were negated when implementing depression as a covariant (Hsu et al., 2009). VBM analyses of pre-defined regions of interest of FMS patients have shown reduced grey matter volumes in the cingulate, prefrontal and insular cortices, hippocampi and amygdala (Burgmer et al., 2009; Lutz et al., 2008; Robinson et al., 2011).
Unfortunately, there is little consistency in the VBM data from FMS studies. This may result from methodological issues pertaining to tissue classification and arbitrary smoothing (Jones et al., 2005; Patenaude et al., 2011; Smith et al., 2006). Factors such as age, sample size and relative proportions of symptoms contributing to the complex symptom profile in the FMS population can also affect findings (May, 2011). VBM has also been used to identify structural differences in patients with irritable bowel syndrome (Seminowicz et al., 2010), tension type headache (Schmidt-Wilcke et al., 2005), chronic fatigue syndrome (de Lange et al., 2005) and post-traumatic stress disorder (Chen et al., 2006; Villarreal et al., 2002). FMS is often comorbid with these disorders, and the overlap of symptoms has led some researchers to propose that similar neurophysiological mechanisms may be involved (Ablin and Clauw, 2009; Phillips and Clauw, 2011; Williams and Clauw, 2009). It is possible that a particularly high prevalence of a specific comorbidity in a heterogeneous FMS population could drive regional grey matter changes identified using VBM and explain the wide variety in the data.
In the present study, shape analysis of fifteen subcortical regions was carried out in a homogenous sample of female FMS patients and healthy, age-matched control subjects. This method can be used to comparatively investigate shape and volume of subcortical structures, and has recently been used to investigate abnormalities in long term abstinent alcoholics (Sameti et al., 2011), patients with Alzheimer's disease (Zarei et al., 2010) and age-related changes in healthy populations (Goodro et al., 2012). This novel technique has been recently validated and shown to be consistent over a variety of magnetic field strengths and acquisition systems (Goodro et al., 2012). Shape analysis can locate subcortical structural boundaries without the need for smoothing. Therefore, it can accurately identify both location and direction of complex morphological alterations through direct measurement of geometric shape more precisely than VBM (Patenaude et al., 2011). In order to compare results with shape analyses concurrent global and local grey matter alterations throughout the whole brain of FMS patients were also investigated using VBM. We hypothesised that FMS patients would show subcortical abnormalities in shape and volume and that the degree of such morphological changes would correlate with clinical measures of FMS severity such as manual tender point scale (MTPS) scores (Wolfe et al., 1990), Beck Depression Inventory (BDI) scores (Beck et al., 1961) and Fibromyalgia Impact Questionnaire (FIQ) scores (Burckhardt et al., 1991), which included self-report measures of duration of symptoms.
2. Methods
2.1. Patients
Sixteen female patients (age 38.5 ± 8.45 years, mean ± SD) took part in the study. Mean duration of symptoms was 9.1 ± 6.8 years, and mean time since diagnosis was 2.8 ± 1.3 years (mean ± SD). All patients fulfilled ACR criteria for diagnosis with fibromyalgia on the day of scanning (Wolfe et al., 1990). Patients were recruited from two outpatient fibromyalgia clinics at regional NHS Foundation Trust hospitals; the Walton Centre, Liverpool, United Kingdom, and Wirral University Teaching Hospital, Wirral, United Kingdom. Informed consent was obtained from all participants in accordance with the Declaration of Helsinki and the study was approved by the National Research Ethics Committee of the United Kingdom, and the Research Governance Committees of both hospitals. Patients aged between 22 and 52 years were considered for participation. Those with additional disease or disorders (not commonly comorbid with FMS such as diabetes or hypertension) were excluded, as were patients with a past history of major disease, alcohol/drug abuse or serious head or brain injury. Patients using analgesics (such as co-codamol) withdrew for 3 to 5 days prior to scanning. For example, a patient taking 6 to 8 tablets of mild co-codamol (8/500 mg) a day was asked to discontinue use for 3 days, a patient using up to 8 tablets of strong co-codamol (30/500 mg), or high doses of dihydrocodeine, was asked to taper the dose over a period of 2 days before discontinuing use for 3 days prior to testing; withdrawal was managed by the clinical team during consultation. Analgesic medications with minimal central nervous system effects, such as paracetamol, were permitted. Patients using medications with central nervous system effects (such as trycyclic antidepressants), which were not deemed suitable for withdrawal by the clinical team, were excluded. Common FMS medications at stable low doses such as pregabalin (up to 75 mg twice a day), gabapentin (up to 300 mg twice a day) and amitriptyline (up to 10 mg at night), were considered acceptable for the criteria of minimal central nervous effects.
2.2. Controls
Fifteen age-matched female controls (age 39.4 ± 8.7 years, mean ± SD) were recruited through campus advertisement. Volunteers taking regular medication, currently diagnosed with any disease or disorder, or demonstrating a history of major disease, alcohol/drug abuse or serious head or brain injury were excluded. All patients and volunteers were compensated for time and travel expenses.
2.3. MRI data acquisition
High-resolution 3-dimensional T1-weighted images of the brain were acquired using a whole-body Trio 3 T MRI imaging system (Siemens, Erlangen Germany) and an 8-channel head coil. A T1 weighted modified driven equilibrium Fourier transform (MDEFT) sequence (TR = 7.92 ms, TE = 2.48 ms, flip angle = 16°, 176 sagittal slices, slice thickness 1 mm, matrix 256 × 256, in-plane voxel size 1 mm × 1 mm, total acquisition time 12:51 min) was utilised. Following the MR scan all participants underwent a clinical MTPS examination (Wolfe et al., 1990), eighteen anatomically standard FMS tender points were palpated for 4 s using the thumb pad of the dominant hand. Pressure began at 1 kgf and was incremented by 1 kg per second until a maximum pressure of 4 kg is achieved. Following examination of each point patients reported whether they felt any pain during palpation and rated the pain verbally on a scale of 0 (no pain) to 10 (worst pain ever experienced). All participants also completed the BDI and FIQ to evaluate affective disturbance and the impact of symptoms on quality of life in the week preceding the scan. Questionnaires and MTPS examinations were administered immediately following the MR scanning session (on the same day), so as to reflect medication levels and symptoms appropriate to the time of scanning.
2.4. Subcortical segmentation, vertex and volumetric analysis
Fifteen subcortical structures (brainstem, bilateral thalami, hippocampi, amygdalae, putamen, caudate nucleus, accumbens nucleus and pallidum) were segmented from each subject's high-resolution T1 structural scan using the Oxford Centre for Functional MRI of the Brain's (FMRIB) integrated registration and segmentation tool (FIRST) toolbox (Patenaude et al., 2011) in the FMRIB software library [FSL, http://www.fmrib.ox.ac.uk/fsl, (Smith et al., 2004)]. This method implements a probabilistic adaptation of the active appearance model using a large, manually labelled data set as a training template wherein the subcortical structures are parameterised as surface meshes with established vertices. In an automated process, the images are linearly registered (12 degrees of freedom) to the training template and subsequently to a standard Montreal Neurological Institute (MNI) space subcortical mask template in FSL. Finally, shape and intensity variations in the images are used to automatically segment structures in native space using the inverse transformation.
To evaluate group differences in the shape of subcortical structures vertex analysis was performed. A multivariate Gaussian model of vertex location and intensity variation was used to generate a surface mesh for each structure in each subject. The number and correspondence of mesh vertices remain constant across subjects to allow for point-to-point group comparisons of mean vertex positions. Corresponding vertices of surface meshes for each individual subject were compared in standard MNI space using the Multivariate General Linear Model with Pillai's trace as the test statistic. This results in a multivariate F-statistic for each vertex which is sensitive to between group differences in vertex coordinates in any direction (Patenaude et al., 2011). Geometric shape analysis of subcortical structures may be preferable to VBM for identification of subtle morphological alterations as this method identifies the location and direction of complex morphological alterations through direct measurement of shape without the need for smoothing (Patenaude et al., 2011). The accuracy of this method has been shown to be superior to previous automated segmentation tools (Patenaude et al., 2011), and FIRST analysis is consistent over a variety of magnetic field strengths and acquisition systems (Goodro et al., 2012). This method has also been compared to the ‘gold standard’ of segmentation in structural imaging, manual segmentation of images by an expert, and the findings indicate a high degree of accuracy (Babalola et al., 2009). Individual vertex results were corrected for multiple comparisons (across vertices) using false discovery rate (FDR) method (Benjamini and Hochberg, 1995) and P < 0.05 was considered significant. Bonferroni–Šidák correction was also employed to account for the multiple comparisons required across 15 structures.
As recent studies pointed to an association between Chiari I malformation and FMS (Heffez, 2011; Thimineur et al., 2002; Watson et al., 2011), each anatomical image was assessed for Chiari I malformation by measuring the distance from the inferior tip of the cerebellar tonsils to the line connecting basion and opisthion (Watson et al., 2011). This measure was of importance for evaluation of potential shape or volume differences because increased pressure of cerebrovascular fluid below foramen magnum in Chiari I malformation may affect the shape of subcortical structures such as the brainstem.
For structures demonstrating a significant shape alteration in FMS patients relative to healthy participants, multivariate analysis of covariance (MANCOVA) was performed using clinical and psychological measures as covariates to investigate whether clinical or psychological variables would explain group shape differences. However, if the measures violated the assumption of homogeneity of regression slopes (i.e. demonstrated a bimodal distribution which was confirmed by a significant difference in group means using an independent samples t-test), then they were deemed unsuitable for use in MANCOVA analysis. Instead, these measures were implemented in a correlation analysis using FIRST in the FMS patient group only. These variables were independently entered as correlates in the design and vertex analysis was performed to evaluate whether they correlated with vertex positions in structures showing significant group differences in shape. FDR correction was applied to correct for multiple tests across vertices. Chiari I parameters, MTPS scores, FIQ scores, BDI scores and individual brain structure volumes were the measures utilised as potential confounds in MANCOVA or correlation analyses to investigate significant group differences.
The surface meshes generated for each subject were then transformed back into native space and boundary corrected before the volume (mm3) for each structure was calculated. For each subcortical structure demonstrating a significant difference in shape analysis, volumetric data were exported for each participant and mean values for FMS patient group and healthy control group were compared using Student's independent sample t-tests. In the event of significant group differences in the volume of specific structures, univariate ANCOVA was performed implementing total intracranial volumes and total grey matter volumes from VBM analyses as covariates to evaluate whether such factors would account for the findings. Individual volumes in the FMS patient group were also utilised for Pearson's correlation analyses with clinical measures (MTPS scores) in SPSS v.19 (SPSS Inc., Chicago, USA).
2.5. Voxel based morphometry analysis
VBM pre-processing and analysis were performed using VBM8 toolbox (http://dbm.neuro.uni-jena.de/vbm) in SPM8 (Welcome Trust Centre for Neuroimaging, University College London, United Kingdom) in Matlab v.7.8 (The MathWorks Inc., USA). Voxel based morphometry consists of several steps including spatial normalisation of images, segmentation of grey matter and other tissues, and analysis of global and local differences in voxel intensities. Images were registered to MNI space and an optimized method of VBM using the VBM8 Toolbox was implemented for segmentation of grey and white matter, default settings were used unless otherwise indicated. A hidden Markov random field model is applied as part of this procedure to reduce noise effects and, as spatial normalisation causes expansion or contraction of some brain regions, segmented images were scaled by the degree of contraction (modulated), so that the total volume of grey or white matter in the images remains the same as in the original images. Images were smoothed using an isotropic Gaussian kernel of 10 mm full width at half maximum. A data quality check based on inhomogeneity measures of the sample, as implemented in VBM8 toolbox, was used to check for anomalous data (outside 2 standard deviations) which was visually inspected and subsequently excluded if necessary. Using these criteria no data was excluded from the sample.
A voxel-wise comparison was performed between the FMS patient and healthy control group using the general linear model implemented in VBM8. As in previous clinical studies (Buckalew et al., 2008; Schmidt-Wilcke et al., 2006) where pain-related grey matter alterations may be small, whole brain differences in voxel intensities were first evaluated using an initial threshold of P < 0.001 (uncorrected) to identify clusters of contiguous voxels (thresholded to encompass at least 30 voxels) showing a difference. Subsequently, the clusters of voxels demonstrating grey matter volume differences at the uncorrected level were compared using a statistical threshold corrected for family-wise error (FWE) at cluster level (P < 0.05 corrected). Finally, for any regions demonstrating significant group differences, individual regional grey matter volumes in the FMS patient group were exported and utilised for Pearson's correlation analysis with MTPS, FIQ and BDI scores in SPSS v.19. This analysis was performed to evaluate whether clinical or psychological factors would account for alterations to regional grey matter volumes in the FMS group.
2.6. Total intracranial tissue volumes and correlations with clinical measures
Total volumes of grey matter, white matter and total intracranial volumes for each participant were exported and mean values for FMS patient group and healthy control groups were compared using Student's independent sample t-tests. Pearson's correlation analysis was performed to evaluate possible correlations between total grey matter volumes in the patient group and clinical measures of symptom severity (MTPS, BDI and FIQ scores).
3. Results
3.1. Clinical and psychological analysis
A Student's independent t-test indicated a significant difference between the mean MTPS scores for patients (4.98 ± 1.89) and controls (0.26 ± 0.34); t (29) = 9.48, P < 0.001. Mean FIQ scores in the FMS patient group (63.37 ± 15.83) also differed significantly from those in the healthy control participants (6.26 ± 6.51); t (29) = 12.74, P < 0.001. A significant difference was also seen between mean BDI scores for FMS patients (19.50 ± 11.19) and controls (3.87 ± 4.42); t (29) = 5.05, P < 0.001.
3.2. Shape analysis
Vertex analysis was performed to evaluate the shape and volume of 15 subcortical structures in FMS and healthy control groups. However, only the brainstem showed a localised shape difference, which is significant following FDR correction for the number of vertices tested and Bonferroni–Šidák correction for multiple comparisons across structures (P = 0.01corr). In the FMS patient group the brainstem demonstrated an inward movement of vertices compared to healthy control participants on the left lateral medullary funiculus extending from the inferior tip of the brainstem to the level of the inferior olivary body (Naidich and Duvernoy, 2009) suggesting a volume reduction in this region. A significant outward movement of fewer vertices located above this area in the left medulla at the level of the inferior olivary body was also apparent which further suggests an alteration to geometric shape in the region. Taken together these results suggest an inward shape change to the left lateral aspect of the brainstem in FMS patients at the level of the medulla accompanied by a smaller (in size) outward shape change at the level of the inferior olivary body. Fig. 1 shows the locations, directions and F-statistics of shape change of brainstem vertices in the FMS group relative to healthy control group.
Fig. 1.
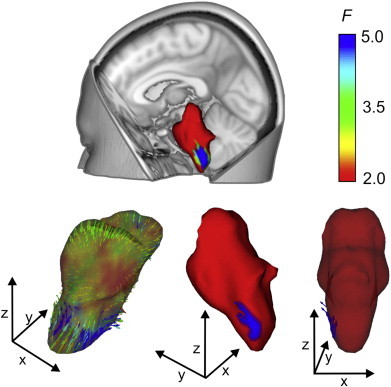
Vertex analysis of shape alterations in the brainstem of the FMS patient group in comparison to healthy control participants. Upper panel shows the anatomical location of the brainstem and the local area exhibiting shape change in FMS patient group. Lower left panel indicates shape change in FMS patient group compared to healthy control group at an uncorrected level, this transparent image shows direction of vectors, inward direction represents relative inward positions of vertices (in FMS subjects compared with healthy control subjects) indicative of volume reduction. Outward direction of vectors indicates relative shape increases in FMS patient group. Arrow colour and surface colour indicate the F-statistic of the change in the specific vertices (see colour bar). Lower centre panel shows the location of the difference in patient group following FDR correction, red colour indicates areas which did not differ significantly from healthy control group. Lower right panel shows a semi-transparent image following FDR correction, indicating the direction of significant vectors showing alterations in the FMS group in comparison to healthy control participants. (For interpretation of the references to colour in this figure legend, the reader is referred to the web version of this article.)
A Student's independent t-test was performed to compare mean brainstem volumes, as indicated by FIRST analysis, in FMS patient and healthy control groups. The mean total volume of the brainstem in FMS patient group was shown to be significantly reduced in comparison to healthy control participants (t (29) = 2.56, P = 0.016). Fig. 2A shows the bar charts and error bars for both group's mean brainstem volumes. Univariate ANCOVA analysis revealed that the group difference in volume of the brainstem was similarly significant following correction for total intracranial volume and total grey matter volume covariates (F(1,27) = 7.30, P = 0.012). Pearson's correlation analysis was performed to evaluate the relationship between the reduction of brainstem volume and MTPS scores, BDI scores and FIQ scores in the FMS patient group. A significant one-tailed correlation (r = − 0.45, N = 16, P = 0.039) was evident, indicating that patients exhibiting greater reductions in volume of the brainstem reported higher scores for the MTPS evaluation. Fig. 2B shows the scatter plot of individual brainstem volume and MTPS score data for the FMS patient group distributed along the regression line.
Fig. 2.
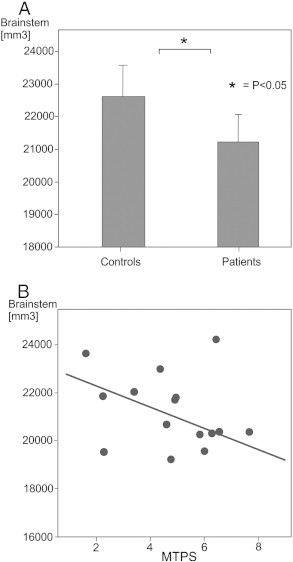
A: Bar chart illustrating the mean total volume of the brainstem in FMS patient group and healthy control participants and error bars. * indicates a significant difference in an independent Student's t-test comparison of group mean values.
B: Scatter plot showing manual tender point scale (MTPS) scores and total volume of the brainstem (mm3) as calculated during FIRST analyses. The linear regression line is also shown.
As Chiari I malformation might contribute to the shape and volume changes in the brainstem, we analysed the distance between the basion–opisthion line and lower tip of cerebellar tonsils (Watson et al., 2011). Two FMS patients and one control subject showed a tonsillar position > 5 mm below the basion–opisthion line which meets the diagnostic criterion of Chiari I malformation. The mean distance between the basion–opisthion line to the tip of cerebellar tonsils was 0.58 ± 3.33 mm (mean ± SD) in FMS group and − 0.12 ± 2.23 mm (mean ± SD) in healthy control subjects (t (29) = − 0.68, P > 0.05), positive values denoting measurements inferior to the basion–opisthion line. This distance measurement was entered as a covariate in a MANCOVA design vertex analysis in FIRST. The vertices differentiating FMS patients and controls in the lower brainstem (Fig. 1A) remained unchanged after entering the distance between basion–opisthion line and the lower tip of cerebellar tonsils as a covariate. Thus, it is unlikely that Chiari I malformation would account for the reduction of lower brainstem volume seen in FMS patients. The additional clinical and psychological data collected during the study demonstrated a significant bimodal distribution and was therefore not appropriate for MANCOVA analysis. These variables (MTPS scores, BDI scores, FIQ scores and individual brainstem volumes) were independently employed in correlation analysis using FIRST in the FMS patient group. No significant correlations were identified between vertex positions in the brainstem and any of the clinical or psychological measures in the FMS patient group.
3.3. Regional grey matter volumes
Voxel-wise comparison of local grey matter volumes across the whole brain revealed that FMS patients, relative to healthy control participants, exhibited two significant clusters of grey matter volume reduction. One was located in the brainstem in the left ventral aspect of the basilar pons, in the pontine nuclei, and the other in the left precuneus (cluster extent P < 0.05, FWE-corrected). FMS patients also exhibited two clusters of grey matter volume increases located in bilateral primary somatosensory cortices. Fig. 3 shows the locations of clusters of voxels demonstrating grey matter alterations in FMS patient group relative to healthy control subjects displayed in glass brains and MNI standardised anatomical brains. Table 1 shows the MNI co-ordinates of clusters demonstrating grey matter volume decreases. Table 2 shows increases in FMS patients relative to healthy control subjects. The anatomical locations of t-maxima as defined by the Harvard–Oxford atlas in FSL, peak T and Z values, number of voxels (k) and the cluster-level FWE corrected significance values are also shown. Pearson's correlation analysis was used to investigate potential linear relationships between regional grey matter volume changes and MTPS, BDI and FIQ scores within the FMS patient group. Grey matter volume data was extracted for all clusters demonstrating increases or decreases for each patient in the FMS group and Pearson's correlations with MTPS scores, BDI scores and FIQ scores were calculated. No significant correlations were found.
Fig. 3.
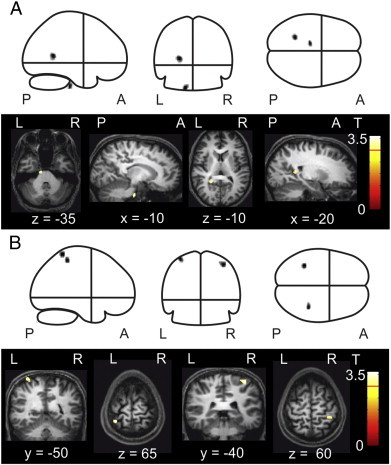
A: Local grey matter volume decreases as indicated by clusters representing spatially extended groups of voxels which differed significantly in grey matter volume at the uncorrected level (P < 0.001) in whole brain analysis and corrected level (P < 0.05) in cluster level analysis. Clusters are displayed in glass brains (upper panel) and MNI standardised anatomical brains (lower panel) x, y and z co-ordinates indicate slice dimensions in MNI space. B: Local grey matter volume increases at the same significance level. Clusters are displayed in glass brains (upper panel) and MNI standardised anatomical brains (lower panel).
Table 1.
Local grey matter volume decreases in FMS patient group relative to healthy control group.
| Structure | MNI [mm] |
k | Z | T | Sig. | ||
|---|---|---|---|---|---|---|---|
| x | y | z | |||||
| Brainstem | − 14 − 21 − 38 | 35 | 3.41 | 3.82 | 0.008 | ||
| Precuneus | − 23 − 51 12 | 40 | 3.37 | 3.77 | 0.008 | ||
Table 2.
Local grey matter volume increases in FMS patient group relative to healthy control group.
| Structure | MNI [mm] |
k | Z | T | Sig. | ||
|---|---|---|---|---|---|---|---|
| x | y | z | |||||
| Left SI | − 36 − 47 69 | 39 | 3.41 | 3.83 | 0.005 | ||
| Right SI | 39 − 39 59 | 35 | 3.37 | 3.76 | 0.005 | ||
Anatomical structure location as defined by the Harvard–Oxford atlas, t-maxima locations according with MNI x, y, z coordinates in millimetres. L, left; R, right; k, number of voxels; T, peak t values; Z, peak z values; Sig., cluster-level FWE corrected P values; SI, primary somatosensory cortex.
3.4. Total intracranial volume statistics and correlations with clinical measures
A Student's independent samples t-test indicated no significant differences in mean total grey matter volume for FMS patients compared to healthy control subjects (P > 0.05), although total mean grey matter volume in FMS patient group (626.30 cm3) was lower than in the healthy control group (644.19 cm3). Pearson's correlation analysis showed a significant correlation between total grey matter volume and MTPS scores in the FMS patient group (r = − 0.63, N = 16, P = 0.009). Patients with lower total grey matter volumes scored higher on the MTPS examination. Fig. 4 shows the data distributed along the regression line in a linear relationship. No correlations were seen between total intracranial tissue volumes and regional grey matter changes.
Fig. 4.
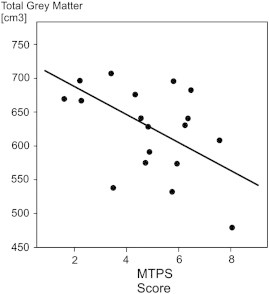
Scatter plot of manual tender point scale (MTPS) scores and total grey matter volume (voxels) as indicated by VBM8 analyses in the FMS patient group. The linear regression line is also shown.
4. Discussion
Analysis of subcortical structures revealed significant differences in the shape and volume of the brainstem of FMS patients. Voxel based morphometry analysis also demonstrated local grey matter reductions in the brainstem as well as in the left precuneus of FMS patients. The volume reduction of the brainstem of FMS patients showed a significant correlation with MTPS scores, indicating that this structure may play an important role in the pathogenesis or maintenance of deep tissue pain and hyperalgesia in FMS. In addition, total grey matter volume in FMS patients also demonstrated a negative correlation with MTPS scores which further suggests that grey matter reductions in FMS are relevant to symptom severity.
In the FMS patient group a reduction or ‘sucking in’ of shape was evident, located in the left lateral medullary funiculus extending from the inferior tip of the medulla to the level of the inferior olivary body. Patients also exhibited significant reductions in mean total volume of the brainstem. The uncorrected results (Fig. 1) show that similar patterns of vertex alterations were seen bilaterally in the FMS patient group at the level of the medulla. However, only left sided vertex alterations were evident following FDR correction in FIRST. Further investigation, utilising a larger patient group, is needed to investigate whether alterations in the brainstem of FMS patients could actually occur bilaterally. Alternatively, unilateral shape alterations may be sufficient to cause widespread symptoms. Small unilateral brainstem infarction has been shown to induce major cognitive problems (Garrard et al., 2002; Hoffmann and Cases, 2008), and unilateral stimulation of periventricular grey can relieve lower back pain (Rasche et al., 2006). Brainstem structures likely play an important role in the maintenance of central sensitisation in FMS (Graven-Nielsen and Arendt-Nielsen, 2010; Petersel et al., 2011), and it is possible that even unilateral structural alterations could be sufficient to contribute to development of widespread central sensitisation. As no correlation was seen between brainstem vertex positions and brainstem volume in the FMS patient group following FDR correction, it is not possible to infer that shape alterations in the brainstem of FMS patients were directly related to volumetric reductions. However, this lack of correlation may be due to the sample size, and this relationship also warrants further investigation with a larger FMS patient cohort.
The inward shape alterations evident on the surface of the medulla in FMS patients indicate a possible reduction in the nuclei underlying this region. Specifically, a reduction in the volume of the reticular formation nuclei could lead to the shape alterations seen on the brainstem surface. Reticular formation nuclei are involved in many systems which demonstrate dysfunction in FMS such as homeostatic regulation, postural control and sleep cycle control (Naidich and Duvernoy, 2009). This formation also contains the rostral ventromedial medulla which is the major relay point between periaqueductal grey and dorsal horn neurons, and the pathway of these three structures constitutes the primary descending pain modulation pathway in the brain (Lovick, 2008; Naidich and Duvernoy, 2009). The nucleus raphe magnus, a group of nuclei which also receive afferent input from the periaqueductal grey and have efferent connections with dorsal horn neurons, is also located in the region, and this structure is also important for descending pain modulation.
Previous studies have demonstrated that descending pain modulation is impaired in FMS (Julien et al., 2005; Kosek and Hansson, 1997). Functional MRI studies of FMS patients undergoing noxious stimulation indicate reduced activity in regions of the brainstem associated with descending pain inhibitory mechanisms (Jensen et al., 2009), and reduced connectivity between the brainstem and pain processing regions (Jensen et al., 2012). A VBM study also recently reported grey matter reductions in the brainstem of chronic pain patients, including FMS patients (May, 2009). Functional imaging of the brainstem and spinal cord during innocuous and painful touch suggests that dysfunctional descending pain modulation may be important in the experience of allodynia pain (Ghazni et al., 2010), and such dysfunction may facilitate the development of chronic pain in FMS and other chronic pain disorders (Staud, 2011a). In healthy participants, selected regions of brainstem showed activation increases during stimulation of a secondary hyperalgesic area of skin (Zambreanu et al., 2005), and a role of brainstem areas has also been suggested for anticipatory mechanisms involved in the maintenance of chronic pain (Fairhurst et al., 2007). Shape alterations and volumetric reductions in the brainstem may relate to dysfunctional pain modulation in FMS. However, a recent VBM study of chronic fatigue syndrome, a disorder closely related to FMS, also suggests structural grey matter reductions in the brainstem (Barnden et al., 2011) (although these changes appear to involve different sub-regions of brainstem).
In a complex syndrome such as FMS it is difficult to surmise specific clinical implications of local abnormalities from a cross-sectional study as extraneous factors could also influence structural changes. FMS patients do less exercise and exhibit higher levels of obesity than healthy people (Mork et al., 2010), and both of these factors were previously shown to influence regional and total brain volumes in normal populations (Colcombe et al., 2006; Erickson et al., 2009). Duration of medication use was also previously shown to correlate with specific structural alterations in FMS patients (Burgmer et al., 2009). Therefore, whilst every effort was made to recruit a homogenous group of FMS patients, it is impossible to ensure that the presence of FMS was the only factor influencing brain structure alterations. However, as the shape and volume alterations seen in the brainstem of patients did not correlate with BDI or FIQ scores, we infer that changes to this structure in FMS patients do not relate to changes in mood associated with the disorder. Shape changes in the lower brainstem of FMS patients cannot be attributed to Chiari I malformation which may be associated with FMS, or at least with a subgroup of patients (Heffez, 2011; Thimineur et al., 2002; Watson et al., 2011). However, we cannot exclude the possibility that a combination of multiple anatomical factors in the cervico-spinal region might have contributed to the shape change seen in lower brainstem of FMS patients in the present study.
Using VBM analysis, decreased local grey matter volumes were identified in the brainstem of FMS patients located in the left ventral aspect of the basilar pons. This region does not correspond to the difference seen using shape analysis, but contains the pontine nuclei (Naidich and Duvernoy, 2009) which are involved in the control and regulation of motor activity. As FMS affects dynamic balance control and is associated with clumsiness and a high prevalence of falls (Jones et al., 2011), grey matter reductions in this region could relate to reported dysfunctional postural control. The left precuneus also demonstrated local grey matter reductions in FMS patients relative to healthy control subjects. Precuneus is an important structure in endogenous pain modulation which demonstrates increased connectivity with periaqueductal grey and posterior cingulate cortex during experimental pain relief (Zyloney et al., 2010), and it is also a known structure of the default mode network (Greicius et al., 2003) which can be disrupted by ongoing chronic pain (Baliki et al., 2008), and specifically FMS (Napadow et al., 2010, 2012). Thus, grey matter reductions seen in the precuneus of FMS patients may contribute to dysfunctional descending pain modulation generated in the posteromedial cortex of FMS patients, or to disruption of the default mode network.
FMS patients exhibited bilateral increases in grey matter of somatosensory cortices. Primary somatosensory cortices are important in the discriminative aspects of pain processing (Lee et al., 2008), and augmented activations were previously seen in somatosensory cortices of fibromyalgia patients during noxious pressure stimulation (Gracely et al., 2002), and brushing of the forearm (Fallon et al., 2013). Neuroplastic alterations in grey matter of chronic pain patients could relate to underlying mechanisms of central sensitisation (Woolf, 2011), and dynamic re-organisation of neural networks may occur as tonic pain persists in FMS (Staud, 2011b). A longitudinal study of chronic pain patients with severe osteoarthritis undergoing hip arthroplasty has shown that grey matter alterations normalise post-operatively with pain reduction (Gwilym et al., 2010), and volume increases in primary somatosensory cortex may ensue in healthy people after just eight days of noxious stimulation lasting for only 20 min (Teutsch et al., 2008). Therefore, grey matter increases in somatosensory regions of patients may represent dynamic changes related to impaired sensory processing and discrimination in FMS. However, as experimental pain does not accurately reflect the experience of ongoing chronic pain and, due to the present uncertainty regarding the precise contribution of peripheral afferent input to FMS pain, the cause of these alterations in FMS patients requires further study.
Subcortical morphological alterations in FMS patients are pertinent to the disorders pathophysiology and merit further investigation. The novel technique of shape analysis used in the present study indicates morphological abnormalities in structures relevant to endogenous pain modulation and a variety of FMS symptoms. Vertex analysis in FIRST is limited to the location of shape changes on the surface of each structure, and volume analyses only reveal global volume differences for each structure. However, as brainstem volume reductions correlated with MTPS scores in the FMS patient group, structural alterations in the present study may corroborate previous evidence for dysfunctional descending inhibition in brainstem of FMS patients (Jensen et al., 2009, 2012). Therefore, the findings represent a step towards understanding the structural underpinning for physiological mechanisms of FMS pain.
In future, high-resolution imaging studies should prioritise structural analysis of cervico-spinal region in FMS patients. Ultra high-resolution T1-weighted MR scanning has already been utilised to identify nuclei and white matter tracts in the brainstem of ex vivo humans (Soria et al., 2011), and future technical improvements may eventually allow for in vivo evaluation of brainstem cytoarchitecture in FMS patients. Future studies could also further investigate whether subcortical shape differences in FMS patients could correlate with functional abnormalities such as decreased functioning of descending nociceptive control systems during experimental pain, dysfunctional postural control or sleep disturbance. Possible structural and functional alterations to the pain modulatory system in FMS may also be affected by current treatments (such as pharmacological interventions, self-management programmes, or non-invasive brain stimulation techniques), and a longitudinal investigation could improve understanding of both the pathophysiology of FMS and the mechanisms of such interventions.
Acknowledgements
This study was supported by Pain Relief Foundation, Liverpool, UK.
Footnotes
This is an open-access article distributed under the terms of the Creative Commons Attribution-NonCommercial-ShareAlike License, which permits non-commercial use, distribution, and reproduction in any medium, provided the original author and source are credited.
References
- Ablin K., Clauw D.J. From fibrositis to functional somatic syndromes to a bell-shaped curve of pain and sensory sensitivity: evolution of a clinical construct. Rheumatic Diseases Clinics of North America. 2009;35:233–251. doi: 10.1016/j.rdc.2009.06.006. [DOI] [PubMed] [Google Scholar]
- Babalola K.O. An evaluation of four automatic methods of segmenting the subcortical structures in the brain. NeuroImage. 2009;47:1435–1447. doi: 10.1016/j.neuroimage.2009.05.029. [DOI] [PubMed] [Google Scholar]
- Baliki M.N. Beyond feeling: chronic pain hurts the brain, disrupting the default-mode network dynamics. Journal of Neuroscience. 2008;28:1398–1403. doi: 10.1523/JNEUROSCI.4123-07.2008. [DOI] [PMC free article] [PubMed] [Google Scholar]
- Barnden L.R. A brain MRI study of chronic fatigue syndrome: evidence of brainstem dysfunction and altered homeostasis. NMR in Biomedicine. 2011;24:1302–1312. doi: 10.1002/nbm.1692. [DOI] [PMC free article] [PubMed] [Google Scholar]
- Beck A.T. An inventory for measuring depression. Archives of General Psychiatry. 1961;4:561–571. doi: 10.1001/archpsyc.1961.01710120031004. [DOI] [PubMed] [Google Scholar]
- Benjamini Y., Hochberg Y. Controlling the false discovery rate — a practical and powerful approach to multiple testing. Journal of the Royal Statistical Society: Series B Methodological. 1995;57:289–300. [Google Scholar]
- Bennett R.M. An internet survey of 2,596 people with fibromyalgia. BMC Musculoskeletal Disorders. 2007;8:27. doi: 10.1186/1471-2474-8-27. [DOI] [PMC free article] [PubMed] [Google Scholar]
- Buckalew N. Chronic pain is associated with brain volume loss in older adults: preliminary evidence. Pain Medicine. 2008;9:240–248. doi: 10.1111/j.1526-4637.2008.00412.x. [DOI] [PubMed] [Google Scholar]
- Burckhardt C.S., Clark S.R., Bennett R.M. The fibromyalgia impact questionnaire: development and validation. Journal of Rheumatology. 1991;18:728–733. [PubMed] [Google Scholar]
- Burgmer M. Decreased gray matter volumes in the cingulo-frontal cortex and the amygdala in patients with fibromyalgia. Psychosomatic Medicine. 2009;71:566–573. doi: 10.1097/PSY.0b013e3181a32da0. [DOI] [PubMed] [Google Scholar]
- Chen S. Gray matter density reduction in the insula in fire survivors with posttraumatic stress disorder: a voxel-based morphometric study. Psychiatry Research. 2006;146:65–72. doi: 10.1016/j.pscychresns.2005.09.006. [DOI] [PubMed] [Google Scholar]
- Clauw D.J. Fibromyalgia: an overview. American Journal of Medicine. 2009;122:S3–S13. doi: 10.1016/j.amjmed.2009.09.006. [DOI] [PubMed] [Google Scholar]
- Clauw D.J., Arnold L.M., McCarberg B.H. The science of fibromyalgia. Mayo Clinic Proceedings. 2011;86:907–911. doi: 10.4065/mcp.2011.0206. [DOI] [PMC free article] [PubMed] [Google Scholar]
- Colcombe S.J. Aerobic exercise training increases brain volume in aging humans. The Journals of Gerontology. Series A, Biological Sciences and Medical Sciences. 2006;61:1166–1170. doi: 10.1093/gerona/61.11.1166. [DOI] [PubMed] [Google Scholar]
- de Lange F.P. Gray matter volume reduction in the chronic fatigue syndrome. NeuroImage. 2005;26:777–781. doi: 10.1016/j.neuroimage.2005.02.037. [DOI] [PubMed] [Google Scholar]
- Erickson K.I. Aerobic fitness is associated with hippocampal volume in elderly humans. Hippocampus. 2009;19:1030–1039. doi: 10.1002/hipo.20547. [DOI] [PMC free article] [PubMed] [Google Scholar]
- Fairhurst M. Anticipatory brainstem activity predicts neural processing of pain in humans. Pain. 2007;128:101–110. doi: 10.1016/j.pain.2006.09.001. [DOI] [PubMed] [Google Scholar]
- Fallon N. Ipsilateral cortical activation in fibromyalgia patients during brushing correlates with symptom severity. Clinical Neurophysiology. 2013;124:154–163. doi: 10.1016/j.clinph.2012.06.014. [DOI] [PubMed] [Google Scholar]
- Garrard P. Cognitive dysfunction after isolated brain stem insult. An underdiagnosed cause of long term morbidity. Journal of Neurology, Neurosurgery, and Psychiatry. 2002;73:191–194. doi: 10.1136/jnnp.73.2.191. [DOI] [PMC free article] [PubMed] [Google Scholar]
- Ghazni N.F., Cahill C.M., Stroman P.W. Tactile sensory and pain networks in the human spinal cord and brain stem mapped by means of functional MR imaging. AJNR. American Journal of Neuroradiology. 2010;31:661–667. doi: 10.3174/ajnr.A1909. [DOI] [PMC free article] [PubMed] [Google Scholar]
- Goodro M. Age effect on subcortical structures in healthy adults. Psychiatry Research. 2012;203:38–45. doi: 10.1016/j.pscychresns.2011.09.014. [DOI] [PMC free article] [PubMed] [Google Scholar]
- Gracely R.H. Functional magnetic resonance imaging evidence of augmented pain processing in fibromyalgia. Arthritis and Rheumatism. 2002;46:1333–1343. doi: 10.1002/art.10225. [DOI] [PubMed] [Google Scholar]
- Graven-Nielsen T., Arendt-Nielsen L. Assessment of mechanisms in localized and widespread musculoskeletal pain. Nature Reviews. Rheumatology. 2010;6:599–606. doi: 10.1038/nrrheum.2010.107. [DOI] [PubMed] [Google Scholar]
- Greicius M.D. Functional connectivity in the resting brain: a network analysis of the default mode hypothesis. Proceedings of the National Academy of Sciences of the United States of America. 2003;100:253–258. doi: 10.1073/pnas.0135058100. [DOI] [PMC free article] [PubMed] [Google Scholar]
- Gwilym S.E. Thalamic atrophy associated with painful osteoarthritis of the hip is reversible after arthroplasty: a longitudinal voxel-based morphometric study. Arthritis and Rheumatism. 2010;62:2930–2940. doi: 10.1002/art.27585. [DOI] [PubMed] [Google Scholar]
- Heffez D.S. “Is Chiari-I malformation associated with fibromyalgia?” revisited. Neurosurgery. 2011;69:E507. doi: 10.1227/NEU.0b013e3182214cea. (author reply E507-8) [DOI] [PubMed] [Google Scholar]
- Hoffmann M., Cases L.B. Etiology of frontal network syndromes in isolated subtentorial stroke. Behavioural Neurology. 2008;20:101–105. doi: 10.3233/BEN-2008-0220. [DOI] [PMC free article] [PubMed] [Google Scholar]
- Hsu M.C. No consistent difference in gray matter volume between individuals with fibromyalgia and age-matched healthy subjects when controlling for affective disorder. Pain. 2009;143:262–267. doi: 10.1016/j.pain.2009.03.017. [DOI] [PMC free article] [PubMed] [Google Scholar]
- Jensen K.B. Evidence of dysfunctional pain inhibition in fibromyalgia reflected in rACC during provoked pain. Pain. 2009;144:95–100. doi: 10.1016/j.pain.2009.03.018. [DOI] [PubMed] [Google Scholar]
- Jensen K.B. Patients with fibromyalgia display less functional connectivity in the brain's pain inhibitory network. Molecular Pain. 2012;8:32. doi: 10.1186/1744-8069-8-32. [DOI] [PMC free article] [PubMed] [Google Scholar]
- Jones D.K. The effect of filter size on VBM analyses of DT-MRI data. NeuroImage. 2005;26:546–554. doi: 10.1016/j.neuroimage.2005.02.013. [DOI] [PubMed] [Google Scholar]
- Jones K.D. Postural control deficits in people with fibromyalgia: a pilot study. Arthritis Research & Therapy. 2011;13:R127. doi: 10.1186/ar3432. [DOI] [PMC free article] [PubMed] [Google Scholar]
- Julien N. Widespread pain in fibromyalgia is related to a deficit of endogenous pain inhibition. Pain. 2005;114:295–302. doi: 10.1016/j.pain.2004.12.032. [DOI] [PubMed] [Google Scholar]
- Kosek E., Hansson P. Modulatory influence on somatosensory perception from vibration and heterotopic noxious conditioning stimulation (HNCS) in fibromyalgia patients and healthy subjects. Pain. 1997;70:41–51. doi: 10.1016/s0304-3959(96)03295-2. [DOI] [PubMed] [Google Scholar]
- Kuchinad A. Accelerated brain gray matter loss in fibromyalgia patients: premature aging of the brain? Journal of Neuroscience. 2007;27:4004–4007. doi: 10.1523/JNEUROSCI.0098-07.2007. [DOI] [PMC free article] [PubMed] [Google Scholar]
- Lee M.C. Identifying brain activity specifically related to the maintenance and perceptual consequence of central sensitization in humans. Journal of Neuroscience. 2008;28:11642–11649. doi: 10.1523/JNEUROSCI.2638-08.2008. [DOI] [PMC free article] [PubMed] [Google Scholar]
- Lovick T.A. Pro-nociceptive action of cholecystokinin in the periaqueductal grey: a role in neuropathic and anxiety-induced hyperalgesic states. Neuroscience and Biobehavioral Reviews. 2008;32:852–862. doi: 10.1016/j.neubiorev.2008.01.003. [DOI] [PubMed] [Google Scholar]
- Luerding R. Working memory performance is correlated with local brain morphology in the medial frontal and anterior cingulate cortex in fibromyalgia patients: structural correlates of pain–cognition interaction. Brain. 2008;131:3222–3231. doi: 10.1093/brain/awn229. [DOI] [PubMed] [Google Scholar]
- Lutz J. White and gray matter abnormalities in the brain of patients with fibromyalgia: a diffusion-tensor and volumetric imaging study. Arthritis and Rheumatism. 2008;58:3960–3969. doi: 10.1002/art.24070. [DOI] [PubMed] [Google Scholar]
- May A. Chronic pain alters the structure of the brain. Schmerz. 2009;23:569–575. doi: 10.1007/s00482-009-0842-1. [DOI] [PubMed] [Google Scholar]
- May A. Structural brain imaging: a window into chronic pain. The Neuroscientist. 2011;17:209–220. doi: 10.1177/1073858410396220. [DOI] [PubMed] [Google Scholar]
- Mork P.J., Vasseljen O., Nilsen T.I. Association between physical exercise, body mass index, and risk of fibromyalgia: longitudinal data from the Norwegian Nord-Trondelag Health Study. Arthritis Care and Research. 2010;62:611–617. doi: 10.1002/acr.20118. [DOI] [PubMed] [Google Scholar]
- Naidich T.P., Duvernoy H.M. Springer; Wien: 2009. Duvernoy's Atlas of the Human Brain Stem and Cerebellum. [electronic resource] (xi, 876 pp.) [Google Scholar]
- Napadow V. Intrinsic brain connectivity in fibromyalgia is associated with chronic pain intensity. Arthritis and Rheumatism. 2010;62:2545–2555. doi: 10.1002/art.27497. [DOI] [PMC free article] [PubMed] [Google Scholar]
- Napadow V. Decreased intrinsic brain connectivity is associated with reduced clinical pain in fibromyalgia. Arthritis and Rheumatism. 2012 doi: 10.1002/art.34412. [DOI] [PMC free article] [PubMed] [Google Scholar]
- Patenaude B. A Bayesian model of shape and appearance for subcortical brain segmentation. NeuroImage. 2011;56:907–922. doi: 10.1016/j.neuroimage.2011.02.046. [DOI] [PMC free article] [PubMed] [Google Scholar]
- Petersel D.L., Dror V., Cheung R. Central amplification and fibromyalgia: disorder of pain processing. Journal of Neuroscience Research. 2011;89:29–34. doi: 10.1002/jnr.22512. [DOI] [PubMed] [Google Scholar]
- Phillips K., Clauw D.J. Central pain mechanisms in chronic pain states—maybe it is all in their head. Best Practice & Research. Clinical Rheumatology. 2011;25:141–154. doi: 10.1016/j.berh.2011.02.005. [DOI] [PMC free article] [PubMed] [Google Scholar]
- Rasche D. Deep brain stimulation for the treatment of various chronic pain syndromes. Neurosurgical Focus. 2006;21:E8. doi: 10.3171/foc.2006.21.6.10. [DOI] [PubMed] [Google Scholar]
- Robinson M.E. Gray matter volumes of pain-related brain areas are decreased in fibromyalgia syndrome. The Journal of Pain. 2011;12:436–443. doi: 10.1016/j.jpain.2010.10.003. [DOI] [PMC free article] [PubMed] [Google Scholar]
- Sameti M. Subcortical volumes in long-term abstinent alcoholics: associations with psychiatric comorbidity. Alcoholism, Clinical and Experimental Research. 2011;35:1067–1080. doi: 10.1111/j.1530-0277.2011.01440.x. [DOI] [PMC free article] [PubMed] [Google Scholar]
- Schmidt-Wilcke T. Gray matter decrease in patients with chronic tension type headache. Neurology. 2005;65:1483–1486. doi: 10.1212/01.wnl.0000183067.94400.80. [DOI] [PubMed] [Google Scholar]
- Schmidt-Wilcke T. Affective components and intensity of pain correlate with structural differences in gray matter in chronic back pain patients. Pain. 2006;125:89–97. doi: 10.1016/j.pain.2006.05.004. [DOI] [PubMed] [Google Scholar]
- Schmidt-Wilcke T. Striatal grey matter increase in patients suffering from fibromyalgia—a voxel-based morphometry study. Pain. 2007;132(Suppl. 1):S109–S116. doi: 10.1016/j.pain.2007.05.010. [DOI] [PubMed] [Google Scholar]
- Seminowicz D.A. Regional gray matter density changes in brains of patients with irritable bowel syndrome. Gastroenterology. 2010;139:48–57. doi: 10.1053/j.gastro.2010.03.049. (e2) [DOI] [PMC free article] [PubMed] [Google Scholar]
- Smith S.M. Advances in functional and structural MR image analysis and implementation as FSL. NeuroImage. 2004;23:S208–S219. doi: 10.1016/j.neuroimage.2004.07.051. [DOI] [PubMed] [Google Scholar]
- Smith S.M. Tract-based spatial statistics: voxelwise analysis of multi-subject diffusion data. NeuroImage. 2006;31:1487–1505. doi: 10.1016/j.neuroimage.2006.02.024. [DOI] [PubMed] [Google Scholar]
- Soria G. Improved assessment of ex vivo brainstem neuroanatomy with high-resolution MRI and DTI at 7 Tesla. Anatomical Record (Hoboken, N.J.: 2007) 2011;294:1035–1044. doi: 10.1002/ar.21383. [DOI] [PubMed] [Google Scholar]
- Staud R. Evidence for shared pain mechanisms in osteoarthritis, low back pain, and fibromyalgia. Current Rheumatology Reports. 2011;13:513–520. doi: 10.1007/s11926-011-0206-6. [DOI] [PubMed] [Google Scholar]
- Staud R. Peripheral pain mechanisms in chronic widespread pain. Best Practice & Research. Clinical Rheumatology. 2011;25:155–164. doi: 10.1016/j.berh.2010.01.010. [DOI] [PMC free article] [PubMed] [Google Scholar]
- Teutsch S. Changes in brain gray matter due to repetitive painful stimulation. NeuroImage. 2008;42:845–849. doi: 10.1016/j.neuroimage.2008.05.044. [DOI] [PubMed] [Google Scholar]
- Thimineur M. Functional abnormalities of the cervical cord and lower medulla and their effect on pain: observations in chronic pain patients with incidental mild Chiari I malformation and moderate to severe cervical cord compression. The Clinical Journal of Pain. 2002;18:171–179. doi: 10.1097/00002508-200205000-00006. [DOI] [PubMed] [Google Scholar]
- Valet M. Patients with pain disorder show gray-matter loss in pain-processing structures: a voxel-based morphometric study. Psychosomatic Medicine. 2009;71:49–56. doi: 10.1097/PSY.0b013e31818d1e02. [DOI] [PubMed] [Google Scholar]
- Villarreal G. Reduced hippocampal volume and total white matter volume in posttraumatic stress disorder. Biological Psychiatry. 2002;52:119–125. doi: 10.1016/s0006-3223(02)01359-8. [DOI] [PubMed] [Google Scholar]
- Watson N.F. Is Chiari I malformation associated with fibromyalgia? Neurosurgery. 2011;68:443–448. doi: 10.1227/NEU.0b013e3182039a31. (discussion 448-9) [DOI] [PubMed] [Google Scholar]
- Williams D.A., Clauw D.J. Understanding fibromyalgia: lessons from the broader pain research community. The Journal of Pain. 2009;10:777–791. doi: 10.1016/j.jpain.2009.06.001. [DOI] [PMC free article] [PubMed] [Google Scholar]
- Wolfe F. The American College of Rheumatology 1990 criteria for the classification of fibromyalgia. Report of the Multicenter Criteria Committee. Arthritis and Rheumatism. 1990;33:160–172. doi: 10.1002/art.1780330203. [DOI] [PubMed] [Google Scholar]
- Wolfe F. The American College of Rheumatology preliminary diagnostic criteria for fibromyalgia and measurement of symptom severity. Arthritis Care and Research. 2010;62:600–610. doi: 10.1002/acr.20140. [DOI] [PubMed] [Google Scholar]
- Woolf C.J. Central sensitization: implications for the diagnosis and treatment of pain. Pain. 2011;152:S2–S15. doi: 10.1016/j.pain.2010.09.030. [DOI] [PMC free article] [PubMed] [Google Scholar]
- Zambreanu L. A role for the brainstem in central sensitisation in humans. Evidence from functional magnetic resonance imaging. Pain. 2005;114:397–407. doi: 10.1016/j.pain.2005.01.005. [DOI] [PubMed] [Google Scholar]
- Zarei M. Combining shape and connectivity analysis: an MRI study of thalamic degeneration in Alzheimer's disease. NeuroImage. 2010;49:1–8. doi: 10.1016/j.neuroimage.2009.09.001. [DOI] [PubMed] [Google Scholar]
- Zyloney C.E. Imaging the functional connectivity of the periaqueductal gray during genuine and sham electroacupuncture treatment. Molecular Pain. 2010;6 doi: 10.1186/1744-8069-6-80. [DOI] [PMC free article] [PubMed] [Google Scholar]