

Abstract
Compulsive behaviors in obsessive–compulsive disorder (OCD) may be related to deficits in reward processing mediated by corticostriatal circuitry, a brain network implicated in the pathophysiology of OCD. Performing compulsive actions can be perceived as a reward to OCD patients because it temporarily reduces the anxiety provoked by obsessions. Although most OCD literature provides evidence of altered regional activity in these corticostriatal circuits, very little is known about the connectivity between individual regions of the corticostriatal-limbic circuits, including the cognitive and affective neural circuitry associated with OCD. Thus, this study investigated the differences in functional connectivity (FC) patterns in this network during resting-state and incentive processing. Nineteen patients with OCD and 18 well-matched healthy controls were scanned during resting-state and a monetary incentive delay task (task state). FC was assessed using both voxel-wise and region-of-interest (ROI)-wise analyses. Voxel-wise FC analysis with the nucleus accumbens seed revealed that patients with OCD exhibited increased FC between the nucleus accumbens and the lateral orbitofrontal cortex during resting-state. Additionally, these patients showed decreased FC between the nucleus accumbens and limbic areas such as the amygdala during incentive processing. Exploratory ROI-wise FC analysis revealed that OCD patients demonstrated enhanced FC between the nucleus accumbens and the lateral orbitofrontal cortex and increased total connectivity of the lateral orbitofrontal cortex during resting-state. Additionally, patients showed alterations in FC between resting and task state. This study provides evidence that patients with OCD have altered FC in the corticostriatal-limbic network, particularly in striatal-amygdala and striatal-orbitofrontal circuitry, during incentive processing and resting-state. These findings also emphasize that functional connections in the network are modulated by affective/motivational states and further suggest that OCD patients may have abnormalities of such modulation in this network.
Keywords: Corticostriatal circuitry, Functional connectivity, Obsessive–compulsive disorder, Reward, Resting-state
Highlights
-
•
Corticostriatal-limbic FC analysis of task-based and resting-state fMRI data in OCD
-
•
Dysfunctional connectivity in striatal–amygdala during reward task in OCD
-
•
Dysfunctional connectivity in striatal–orbitofrontal cortex at rest in OCD
-
•
FC levels in corticostriatal-limbic network are modulated by affective state.
-
•
OCD patients have deficits in this modulation of the corticostriatal-limbic network.
1. Introduction
One of the striking features of obsessive–compulsive disorder (OCD) is the occurrence of repetitive behaviors (compulsions) that diminish anxiety-inducing thoughts (obsessions). These compulsions produce temporary relief from anxiety that is interpreted by patients as a reward, but they never feel fully safe (Cavedini et al., 2006). OCD patients also evidence cognitive and behavioral inflexibility and exhibit deficits in goal-directed and adaptive behaviors, which may be seen in alterations of behavioral responses when an outcome or environment is altered (Chamberlain et al., 2007; Gu et al., 2008; Page et al., 2009); these typical clinical features and maladaptive behaviors are commonly thought to stem from an impaired ability to process rewards (Cavedini et al., 2006; Huey et al., 2008), because reward processing is responsible for appropriate responses to rewards or punishments during incentive-based learning and for the development of numerous goal-directed and adaptive behaviors by improving future performance and emotion regulation (Haber and Knutson, 2010). The neural circuits mediating reward processing overlap with several brain regions implicated in the pathophysiology of OCD including the basal ganglia (BG), thalamus (THAL), and anterior cingulate cortex (ACC) as well as areas of the prefrontal cortex (PFC) including the orbitofrontal cortex (OFC) and dorsolateral prefrontal cortex (DLPFC) (Atmaca et al., 2011; Kwon et al., 2009; Saxena and Rauch, 2000). Particularly, the nucleus accumbens (NA), as part of the ventral striatum (VS), constitutes a central region for reward processing (Choi et al., 2013; Haber and Knutson, 2010) and a primary target of deep brain stimulation (DBS) therapy for refractory OCD (Denys et al., 2010). Recent meta-analyses of functional imaging using positron emission tomography, single photon emission computed tomography (Whiteside et al., 2004), and voxel-based morphometry studies (Radua et al., 2010) found reliable differences in radiotracer uptake and gray matter volume in the VS of OCD patients compared with controls. Abnormalities of dopaminergic function, which plays a crucial role in reward processing, have also been reported in OCD patients (Denys et al., 2004; van der Wee et al., 2004). More recently, abnormal activity during reward processing was identified in the OFC and VS of OCD patients (Chamberlain et al., 2008; Figee et al., 2011; Jung et al., 2011; Kaufmann et al., 2013; Remijnse et al., 2006). Therefore, an examination of reward processing and its neural correlates in OCD patients may be beneficial in understanding the pathophysiology and treatment of OCD (Huey et al., 2008; Milad and Rauch, 2012).
Converging evidence from functional imaging studies utilizing univariate general linear model (GLM) analysis reveals altered regional activity in corticostriatal circuits and points to their involvement in OCD (Gu et al., 2008; Han et al., 2011; Page et al., 2009). However, very little is known about the interactions between these regions in OCD patients. Recent advances in mapping neural connectivity at the circuit level have enabled the exploration of abnormalities in inter-regional interaction among corticostriatal regions. These studies generally use functional connectivity (FC) analysis that captures the temporal structure of resting-state or task-related network dynamics (Harrison et al., 2009; Sakai et al., 2011; Stern et al., 2011). Recent research has indicated a role for specific brain regions and circuits involved in the affective–motivational aspects of behavior of healthy controls and OCD patients. These areas include the amygdala (AMY), hippocampus (HIP), and insula (Kwon et al., 2009; Menzies et al., 2008) and anatomically and functionally differential OFC subregions including the medial OFC (med-OFC) and the lateral OFC (lat-OFC; Milad and Rauch, 2012; O'Doherty et al., 2001), as well as the interactions between these regions, which collectively represent an affective and cognitive circuit underlying the pathophysiology of OCD. However, as of yet, there has been no specific investigation of functional interactions between these regions during affective and motivational processing in OCD.
A study of FC during a monetary incentive delay (MID) task is employed here and may help resolve this issue as the task (i) elicits both affective and neural responses to reward and punishment and (ii) is associated with the corticostriatal regions implicated in OCD including the NA, ACC, anterior insula (AIS), and other limbic regions. Previous studies using the MID task in OCD patients reported inconsistent results in the regional NA activity during reward anticipation–decreased activity (Figee et al., 2011) and no group difference (Jung et al., 2011; Kaufmann et al., 2013). On the other hand, FC analyses have been shown a consistency in the results of increased ventral striatal FC in OCD patients during resting-state (Harrison et al., 2009, 2013; Sakai et al., 2011). Based on these reports, neural dysfunctions in OCD patients during incentive anticipation may lie in functional interactions between brain regions rather than regional activity. Therefore, in this study, MID task data (Jung et al., 2011) were reanalyzed using FC analysis, specifically a beta-series correlation technique (Rissman et al., 2004), to examine event-related changes in whole-brain voxel-wise FC analysis of the NA. The beta-series correlation method can disassociate functional networks corresponding to the distinct stages of a cognitive task.
Recent studies have investigated FC not only during cognitive tasks but also during resting-state, and the findings suggested an interaction between resting-state activity and stimulus-induced activity (Northoff et al., 2010). However, few studies have investigated any differences in FC between resting-state and task-performance state (Arbabshirani et al., 2013). Evaluating the differences in FC between these states may clarify how this network is modulated by task demands. Therefore, resting-state data acquired from the same subject performing the MID task were analyzed to investigate whether there are group differences in the behavior-dependent modulation of the network.
The aim of this study is to examine whether OCD patients exhibit altered FC in the ventral corticostriatal network, which is relevant to both OCD and incentive processing, during incentive task state and resting-state as well as any interaction between these states. Based on this prevailing model and previous findings from studies of OCD, it is hypothesized that, compared with healthy controls, the corticostriatal-limbic regions of OCD patients would show increased FC during resting-state and reduced FC during incentive processing. Specifically, this altered connectivity in OCD patients is expected to be found in the OFC and limbic areas, such as the AMY, which have been implicated in affective processing. To address this, first, we performed whole-brain voxel-wise FC analysis to generate the FC map of the NA for both the MID task and resting-state data. We also conducted exploratory FC analyses in ROI-wise manner using graph theory to examine FC among brain regions that comprise the corticostriatal-limbic reward network (Camara et al., 2009; Haber and Knutson, 2010; Milad and Rauch, 2012). Then, we compared the results from two different analytic methods to show that the altered connectivity in OCD patients persists regardless of which analytic method is used.
2. Material and methods
2.1. Participants
Twenty patients with OCD were recruited from the outpatient clinic at Seoul National University Hospital. Diagnoses and comorbidity were established by experienced psychiatrists using the Structured Clinical Interview for DSM-IV Axis-I and -II disorders (SCID-I and -II). Twenty comparison subjects who were matched for sex, age, and IQ with the patients were also recruited. All subjects were right-handed. Exclusion criteria included lifetime history of psychosis, brain injury, neurological illness, alcohol or substance abuse, and learning disabilities. Of all participants, three subjects (two healthy controls, one OCD patient) were excluded from FC analysis because of excessive head motion during resting-state. The criteria for excessive head motion were translations in excess of 1 mm in any directions or rotations in excess of 1°around any axes in 6 head motion parameters. Demographic, clinical, and behavioral data were recorded for the two groups (Table 1). At the time of the study, 15 OCD patients were drug naïve, and four OCD patients were drug free for at least 4 weeks. Note that all subjects in this study were those included in our previous study using a univariate analysis approach (Jung et al., 2011). The institutional review board of Seoul National University Hospital approved the study protocol, and all participants signed an informed consent form prior to their participation. Participants were paid according to their task performance (see Participants and clinical and behavioral results in the Supplementary material).
Table 1.
Demographic and characteristic features and behavioral data for subjects.
| Controls (n = 18) |
Patients (n = 19) |
t | p | |
|---|---|---|---|---|
| Demographic data | ||||
| Sex (male/female) | 11/7 | 12/7 | 0.02b | 0.90 |
| Age (years) | 24.83 (3.88) | 25.84 (7.15) | − 0.53 | 0.60 |
| Education (years) | 14.61 (1.30) | 15.16 (3.82) | − 0.58 | 0.57 |
| IQ scorea | 111.11 (10.43) | 108.89 (13.21) | 0.56 | 0.58 |
| BIS | 15.94 (2.62) | 18.63 (3.77) | − 2.50 | 0.02 |
| BAS total score | 33.06 (7.76) | 30.79 (5.33) | 1.04 | 0.31 |
| BAS reward responsiveness | 13.44 (3.28) | 13.53 (2.37) | − 0.09 | 0.93 |
| BAS drive | 9.78 (2.62) | 8.89 (2.83) | 0.98 | 0.33 |
| BAS fun seeking | 9.83 (2.38) | 8.37 (2.67) | 1.76 | 0.09 |
| Clinical date | ||||
| BDI | 3.00 (4.56) | 15.79 (11.25) | − 4.48 | p < 0.01 |
| BAI | 4.33 (4.69) | 15.63 (14.99) | − 3.06 | p < 0.01 |
| Y-BOCS total score | 20.63 (6.58) | |||
| Y-BOCS obsession | 10.89 (4.31) | |||
| Y-BOCS compulsion | 9.74 (4.33) | |||
| Age of onset (years) | 18.00 (6.76) | |||
| Duration of illness (years) | 7.82 (5.57) | |||
| Behavioral data | ||||
| Total earnings (in won) | 28611.11 (2913.23) | 28631.58 (2832.56) | − 0.02 | 0.98 |
| Reaction time (ms overall) | 230.05 (18.91) | 227.19 (41.27) | 0.27 | 0.79 |
| Hit rate (% overall) | 58.40 (2.86) | 58.25 (1.7) | 0.20 | 0.85 |
| VAS effort for gain (1–10) | 8.26 (1.31) | 8.62 (1.07) | − 0.92 | 0.37 |
| VAS effort to avoid loss (1–10) | 8.82 (0.84) | 8.35 (1.33) | 1.25 | 0.22 |
Abbreviations: IQ, Intelligence Quotient; BIS, Behavioral Inhibition System; BAS, Behavioral Activation System; BDI, Beck Depression Inventory; BAI, Beck Anxiety Inventory; Y-BOCS, Yale–Brown Obsessive Compulsive Scale; VAS, Visual Analog Scale.
Values are presented as mean (SD). Independent sample t-test was used.
Estimated by Korean–Wechsler Adult Intelligence Scale-Revised (K-WAIS-R).
χ2 test was used.
2.2. Monetary incentive delay task
A modified version of the MID task developed by Knutson et al. (2001) was utilized to invoke anticipation of monetary gains and losses in OCD patients and healthy controls (Fig. S1). While performing the task, subjects saw one of three cues during each trial, which led them to anticipate potential monetary gain, monetary loss, or no consequence. Participants' monetary outcome depended on their performance during a simple reaction time task at the end of each trial, which involved pressing a button while a visual target was briefly presented (see Supplementary material for a detailed description of the trial structure).
2.3. Data acquisition
Functional images (T2*-weighted echo-planar imaging, repetition time (TR) = 2340 ms, echo time (TE) = 52 ms, flip angle = 90°, field of view (FOV) = 22 cm) were acquired using a 1.5-T Siemens scanner (Avanto, Germany). Twenty-five contiguous 5.0-mm axial slices with 3.44 mm2 in-plane resolution were obtained. All subjects underwent two resting-state scans (i.e., eyes closed (EC) and eyes fixating on a cross (EF)), followed by the MID tasks. The fMRI scans for resting-state and the MID task were performed in a 4.68-min (120 volumes) and in two runs of each 9.56 min (490 volumes in total) for each subject. In this study, we used only EF data among two resting-state scans because it represents more appropriate baseline for task-related FC. After functional image scans, we also acquired structural T1 image for each subject in the same scanner. T1-wighted images were acquired using a 3D magnetization-prepared rapid-acquisition gradient echo (MPRAGE) sequence with following imaging parameters (TR = 11.6 s, TE = 4.76 ms, FOV = 23 cm, flip angle = 15°, 208 slices, 0.45 × 0.45 × 0.9 mm3).
2.4. Data preprocessing
The first four time points of resting-state data were discarded to avoid the instability of the initial MRI signal. Similarly, the first three time points of the MID task data were discarded. Preprocessing steps (implemented in SPM8 (http://www.fil.ion.ucl.ac.uk/spm/)), which included slice-acquisition timing, motion correction, and spatial normalization, were conducted according to a standard template provided by the Montreal Neurological Institute (MNI). The normalized images were smoothed with a 6-mm Gaussian kernel. For the resting-state data, linear detrending and band-pass filtering (0.01–0.08 Hz) were performed using REST V1.7 (http://www.restfmri.net/; Song et al., 2011b). Additionally, head motion parameters, averaged signals from white matter and cerebrospinal fluid, and global brain signals were regressed out to remove possible spurious variances (Fox et al., 2005, 2009).
2.5. Functional connectivity analysis
FC analyses were conducted in voxel-wise and ROI-wise manners in terms of a priori and exploratory analysis, respectively. Voxel-wise FC was calculated using the correlations between NA seeds and the beta-series data in all of the other voxels in the whole brain. For exploratory ROI-wise FC analyses, the correlations between ROIs was conducted on a 1-to-1 (edge-wise) and N-to-1 (region-wise) basis. The 1-to-1 connectivity analysis was defined as the connections between each pair of ROIs, and N-to-1 connectivity analysis was defined as the sum of each region's connectivity with all other regions. A flow chart of data analysis is provided (Fig. 1A).
Fig. 1.
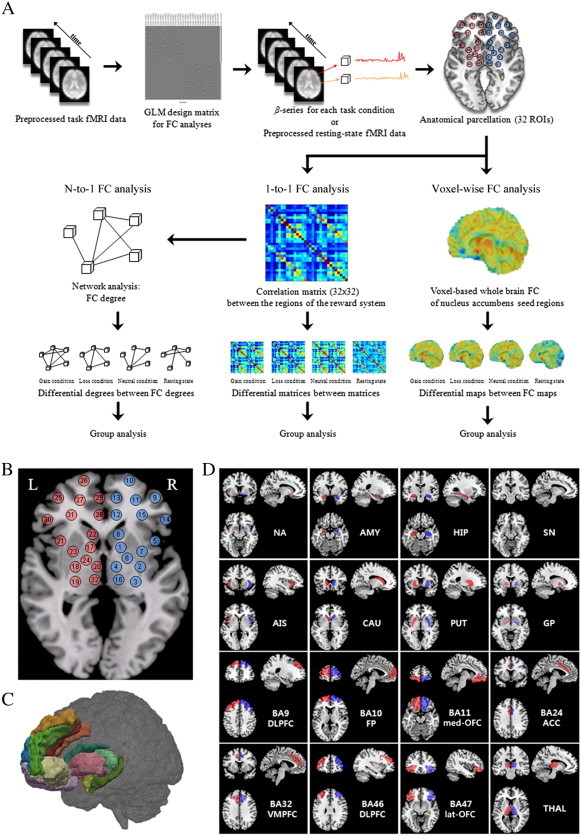
A flowchart of data analysis and region of interest (ROI) used as nodes in the network analysis. (A) Functional connectivity analyses were conducted in both voxel-wise and ROI-wise manners for each behavioral state. After task- and resting-state fMRI data preprocessing, we applied the anatomical template for regional parcellation. Voxel-wise functional connectivity was estimated by calculating the correlations between the average time series of the nucleus accumbens seed region and the time-series data from all other voxels in whole brain. All correlation maps were transformed to the normal distribution by Fisher's z transform for further statistical inference. For ROI-wise functional connectivity computing the correlations between 32 ROIs, network functional connectivity was conducted N-to-1 (region-wise) and 1-to-1 (edge-wise) basis. From each ROI, we extracted mean beta-series to analyze functional connectivity using Person's R correlation coefficient in each behavioral state. N-to-1 connectivity was defined as the sum of each region's connectivity with all other regions, while 1-to-1 connectivity was defined as the connections between each pair of ROIs. Finally, between-group comparisons were performed. (B) Schematic representation of the 32 regions comprising the corticostriatal reward network considered in the functional connectivity analysis. Thirty-two redefined regions are shown on (C) a semi-transparent 3D rendering of an MRI scan of the brain and on (D) a single subject T1 data.
2.5.1. Whole-brain voxel-wise connectivity analysis
FC maps were created for each participant using a beta-series correlation analysis approach described previously (Rissman et al., 2004) for which the validity has been confirmed (Fornito et al., 2011; Rissman et al., 2004; Ye et al., 2011). For this analysis, a new GLM design matrix using separate covariates was constructed to model hemodynamic responses in a particular stage (specific cue) for each single trial. The parameter estimates (beta values) of cues were extracted to form a set of cue-specific beta-series data, which were averaged across voxels within the NA seed ROIs defined using Anatomical Automatic Labeling (AAL) atlas (Tzourio-Mazoyer et al., 2002), and then correlated with the beta-series of every other voxel in the whole brain for each participant using Pearson's correlation. The FC map was created separately for the NA seed in each hemisphere for each task condition. FC maps for resting-state were also produced by averaging the time series in the NA seed and then computing the Pearson's correlation between the averaged seed time series and those from each voxel in the whole brain. Therefore, four FC maps (i.e., a specific FC map for gain condition, loss condition, neutral condition, and resting-state) were made for the NA seed in each hemisphere for each subject. All correlation maps were transformed to the normal distribution by Fisher's z transform. To make FC maps for the gain (loss) anticipation contrast, FC maps of the gain (loss) condition were subtracted from those of the neutral condition. Group-level analyses were carried out using a random-effects model implemented in SPM8. A 2 × 2 full-factorial design [group (controls versus patients) by hemisphere (right and left)] was performed for each behavioral state separately. Between-group comparisons were restricted to (i.e., were masked by) voxels showing significant connectivity with the NA seed within either controls or patients depending on the specific behavioral state as a mask image. The mask image was thresholded at p < 0.001, and a topological cluster-size false-discovery rate (FDR) of p < 0.05 was then used to control for multiple comparisons across the whole brain (Chumbley and Friston, 2009; Chumbley et al., 2010; Fig. 2). Significant areas for between-group effects were reported by thresholding individual voxels at p < 0.005 (uncorrected) and then applying a subsequent cluster-size threshold based on Monte Carlo simulations using AlphaSim, which resulted in a corrected threshold of p < 0.01 (Fig. 3). To investigate changes in FC of the NA between resting-state and task-performance state in the two groups, a 2 × 2 full-factorial design was also used for the FC difference map obtained by subtracting the gain (loss) anticipation map from the resting-state map for two groups. This analysis was limited to only those regions showing significant connectivity with the NA within either controls or patients during resting-state.
Fig. 2.
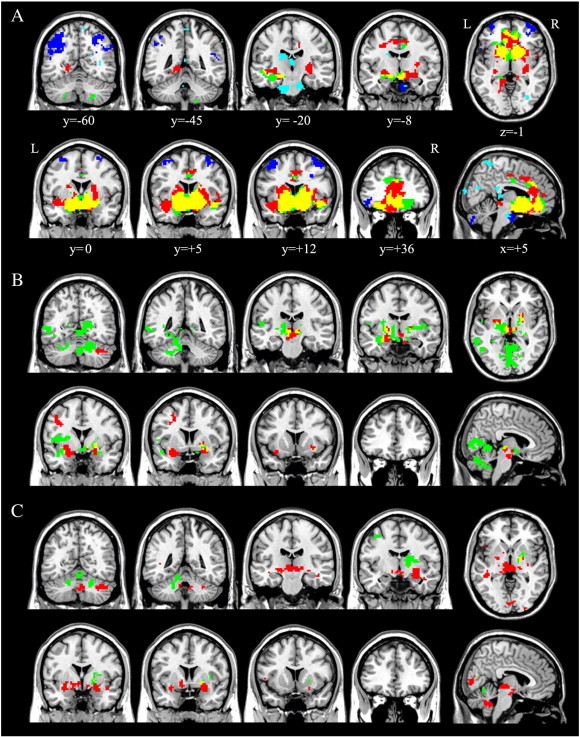
Significant within-group functional connectivity maps of the nucleus accumbens seed region during (A) resting-state, (B) gain anticipation, and (C) loss anticipation. Red indicates positive correlation maps in healthy controls; green, positive correlation maps in patients with OCD; yellow, the spatial overlap of positive correlation maps between two groups; blue, negative correlation maps in healthy controls; cyan, negative correlation maps in patients with OCD; L, left hemisphere; R, right hemisphere. Results are displayed at p < 0.05, topological FDR corrected. (For interpretation of the references to color in this figure legend, the reader is referred to the web version of this article.)
Fig. 3.
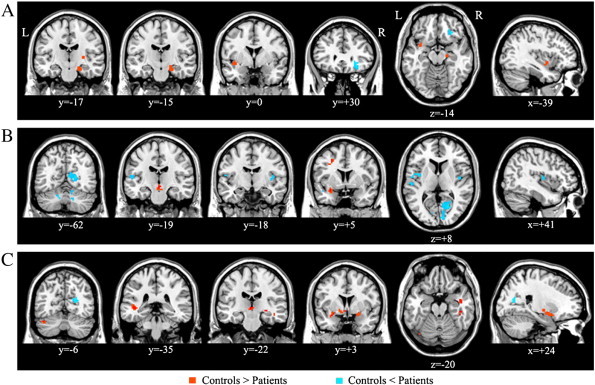
Significant between-group differences in ventral striatum functional connectivity. This figure indicates significant group differences in voxel-wise functional connectivity of the nucleus accumbens seed during (A) resting-state, (B) gain anticipation and (C) loss anticipation. Results are displayed at a corrected p < 0.01, determined by Monte Carlo simulation using AlphaSim.
2.5.2. Exploratory ROI-wise connectivity analysis
2.5.2.1. Regions of interest
Based on literature investigating the functional neuroanatomy of incentive processing (Camara et al., 2009; Haber and Knutson, 2010; Milad and Rauch, 2012), the following brain regions belonging to the corticostriatal-limbic reward network were considered to be of particular interest: NA, AMY, HIP, substantia nigra (SN), AIS, caudate nucleus (CAU), putamen (PUT), globus pallidus (GP), Brodmann's area (BA) 9 (BA9) of the DLPFC, frontopolar cortex (FP, BA10), med-OFC (BA11), ventral ACC (BA24), dorsal ACC (BA32), BA 46 of DLPFC, lat-OFC (BA47), and thalamus (THAL). Thus, 16 seed regions were defined in each hemisphere (32 seed regions in total). To improve functional specificity, these ROIs were defined based on the AAL atlas for subcortical areas (Tzourio-Mazoyer et al., 2002) and the BA atlas for the frontal areas, except for the AIS which was manually refined from a previous study (Song et al., 2011a; Fig. 1B–D).
2.5.2.2. 1-to-1 connectivity analysis
After extracting the 32 ROIs for each subject, the FC between each pair of the 32 ROIs was computed using Pearson's correlation. A 32 × 32 matrix was obtained for each subject and each condition, with each element representing the strength of the FC between the two corresponding brain regions within the network. The resulting correlation coefficients were then normalized to z-scores with Fisher's r-to-z transformation. A network-based statistic (NBS) approach, as proposed by Zalesky et al. (2010a), was used to identify impaired sub-networks in patients for each behavioral state and FC differences between behavioral states (see Supplementary material).
2.5.2.3. N-to-1 connectivity analysis
The analysis method described by Jiang et al. (2004) was applied. Based on graph theory, all the ROIs were referred to as “nodes” and the connections among them were considered the “links” in the network. The total connectivity degree Γi of a node i in a graph was the sum of all the connectivity degrees between i and all other nodes. This describes the amount of information received by node i from a particular network, specifically, the corticostriatal-limbic network in this study. The Γ value of each ROI was calculated and further normalized by dividing the sum of degrees of all considered nodes in the network, denoted by . The differences in for each ROI between the two groups for each behavioral state were tested using two-sample t-tests. Additionally, two-sample t-tests were used to compare the difference (task minus rest) in the two groups. The significance threshold for between-group differences was set at p < 0.05 and corrected for multiple comparisons based on permutation testing using Ptest software with 10,000 permutations (Camargo et al., 2008). The procedures and corresponding mathematical explanations for the analysis are provided in the Supplementary material.
3. Results
3.1. Voxel-wise connectivity
During resting-state in both groups, the NA was functionally connected in a positive manner to several brain regions including the bilateral OFC, AIS, AMY, HIP, THAL, SN, ACC, middle cingulate cortex, and BG (Fig. 2A). The spatial distribution of these brain regions is consistent with the so-called reward system (Haber and Knutson, 2010). Compared with patients, healthy controls demonstrated greater FC of the NA to the right PUT, parahippocampus, and left posterior insula, whereas OCD patients demonstrated greater FC of the NA to the right lat-OFC (BA47; Fig. 3A). A number of significant group differences for each behavioral state were found in several brain regions (Table 2). During gain anticipation in both groups, the NA showed significant FC with the AMY, HIP, THAL, insula, BG, and cerebellum (Fig. 2B). Additionally, OCD patients showed a pattern of significantly increased FC of the NA with the posterior insula and occipital regions. Healthy controls had greater FC of the NA with the left AMY positioned adjacent to the AIS, middle frontal cortex, and midbrain. OCD patients had greater FC of the NA to the posterior insula, occipital cortex, and the cerebellum (Fig. 3B). During loss anticipation, the NA of healthy controls was functionally connected to brain regions similar to the FC map during gain anticipation, whereas OCD patients showed a set of regions that mostly did not overlap those of healthy controls, including the striatum, THAL, and cerebellum (Fig. 2C). Healthy controls had greater FC of the NA to the bilateral AMY positioned adjacent to the AIS, left mediodorsal THAL, middle temporal cortex, and the cerebellum, whereas OCD patients had greater FC of the NA to the occipital cortex (Fig. 3C). When comparing two groups on FC difference maps between resting-state and loss anticipation, significant group differences were found in FC of the NA to the med-OFC and rostral ACC (Fig. 4).
Table 2.
Regions demonstrating significant differences between the two groups in voxel-wise functional connectivity with the nucleus accumbens seed in each behavioral state.
| Region | L/R | MNI coordinate |
||
|---|---|---|---|---|
| x,y,z | t | z | ||
| Resting-state | ||||
| Positive network | ||||
| Controls > patients | ||||
| Putamen | R | 27, − 21, 3 | 5.05 | 4.6 |
| Parahippocampus | R | 21, − 18, − 18 | 3.77 | 3.59 |
| Posterior insula | L | − 39, 0, − 6 | 3.58 | 3.42 |
| Controls < patients | ||||
| Cerebellum | L | − 21, − 81, − 54 | 4.58 | 4.27 |
| Orbitofrontal cortex | R | 27, 30, − 9 | 4.29 | 4.03 |
| Gain anticipation | ||||
| Controls > patients | ||||
| Amygdala | L | − 33, 9, − 15 | 4.27 | 4.01 |
| Middle frontal cortex | L | − 27, 6, 45 | 3.63 | 3.46 |
| Midbrain (Substantia nigra) | L | 0, − 18, − 12 | 3.29 | 3.16 |
| Controls < patients | ||||
| Calcarine | R | 24, − 69, 15 | 5.07 | 4.66 |
| Cerebellum | R | 15, − 66, 3 | 4.48 | 4.18 |
| Calcarine | L | − 6, − 54, 3 | 4.10 | 3.87 |
| Posterior insula | L | − 39, 0, 12 | 4.06 | 3.83 |
| Cerebellum | L | − 15, − 51, − 12 | 3.74 | 3.56 |
| Posterior insula | R | 45, − 6, 6 | 3.53 | 3.38 |
| Temporal pole | L | − 39, 0, − 18 | 3.35 | 3.22 |
| Loss anticipation | ||||
| Controls > patients | ||||
| Globus pallidus, Amygdala | R | 30, − 18, − 6 | 4.70 | 4.37 |
| Middle temporal cortex | R | 42, − 6, − 21 | 4.55 | 4.24 |
| Thalamus | L | − 3, − 24, 0 | 4.53 | 4.23 |
| Middle temporal cortex | L | − 42, − 30, 0 | 4.33 | 4.06 |
| Thalamus | L | − 3, 0, − 3 | 4.21 | 3.96 |
| Cerebellum | R | 48, − 57, − 36 | 3.85 | 3.66 |
| Inferior frontal cortex | L | − 48, 18, 8 | 3.78 | 3.59 |
| Fusiform | R | 42, − 27, − 21 | 3.68 | 3.51 |
| Cerebellum | L | − 42, − 66, − 27 | 3.67 | 3.50 |
| Amygdala | L | − 33, 6, − 15 | 3.67 | 3.50 |
| Controls < patients | ||||
| Calcarine | R | 24, − 69, 15 | 4.09 | 3.86 |
Abbreviations: L, left; R, right.
Fig. 4.
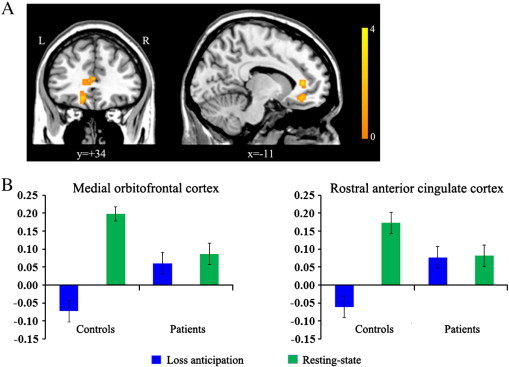
Regions showing significant group differences on FC difference maps between rest and task. When comparing two groups on FC difference maps between rest and loss anticipation, significant group differences were found in functional connectivity of the NA to the med-OFC (x, y, z = − 15, 39, -9; t-/z-value = 4.09/3.54) and rostral ACC (x, y, z = − 9, 39, 6; t-/z-value = 3.54/3.38). Panel B indicates the connectivity strength of the NA to the med-OFC and rostral ACC during loss anticipation and resting-state in each group. We extracted the connectivity strength of the NA to these two regions for each hemispheric seed ROI and each condition, and then these values were averaged for left and right hemispheres for each subject. OCD patients showed less modulation of FC between these two states than controls. Error bars represent standard error from the mean.
Networks that were negatively correlated with the NA were also assessed for both groups. During resting-state, only healthy controls exhibited a negative correlation between the NA and regions constituting the task-positive network (TPN; Fig. 2A; Fig. S2). Compared with controls, OCD patients showed increased FC in TPN regions (Fig. S2). There were no significant negative correlations with the NA for other conditions in either group.
3.2. Brain–behavior associations
Voxel-wise linear regression analyses in SPM8 were performed to assess the extent to which patients' overall symptom severity (total Y-BOCS score) may be associated with the FC strength of the NA for each state. Correlations were considered significant if they exceeded p < 0.001 uncorrected and reflected a cluster size of at least 18 voxels at p < 0.01 (AlphaSim corrected). During resting-state, OCD patients' overall symptom severity was positively correlated with FC between the NA and med-OFC (x, y, z = 0, 48, − 27; z-score, 3.80) and negatively correlated with FC between the NA and lat-OFC (x, y, z = 21, 21, − 15; z-score, 5.39; Fig. 5).
Fig. 5.
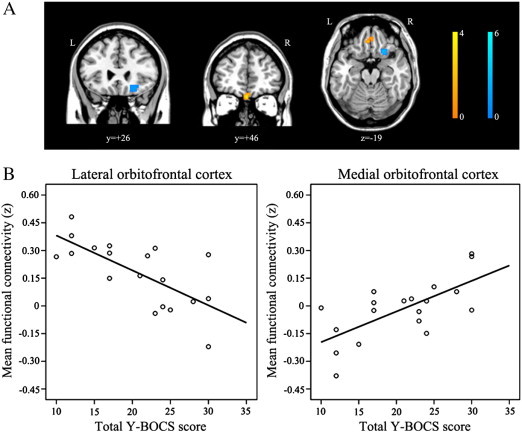
Correlations between the functional connectivity strength of the nucleus accumbens to the orbitofrontal cortex and patients' total Y-BOCS scores (p < 0.001) during resting-state. (A) During resting-state, patient's overall symptom severity was correlated positively with the FC between the NA and med-OFC (warm color) and negatively with the FC between the NA and lat-OFC (cold color) respectively. (B) We extracted the connectivity strength between the nucleus accumbens and OFC regions showing such correlations using Marsbar and then assessed Pearson's correlation between the strength and Y-BOCS scores using SPSS. (For interpretation of the references to color in this figure legend, the reader is referred to the web version of this article.)
3.3. Exploratory ROI-wise connectivity
Analysis using 1-to-1 connectivity in the reward network model found significant group differences in FC between several region pairs (Fig. 6A–C; Table S1). While OCD patients exhibited significantly increased connectivity in several region pairs relative to controls, particularly in FC between PFC regions and BG during resting-state and between the striatum and limbic areas during gain anticipation, they showed decreased connectivity between the PFC and caudate during loss anticipation (Fig. 6A–C). The differences in among ROIs between the two groups were provided using N-to-1 connectivity analysis (Fig. 6D; Table S2). While OCD patients had significant increases in value of the bilateral lat-OFC during resting-state and of the right SN during gain anticipation, they showed significant declines in value of the left NA and right med-OFC (BA11) during gain anticipation and of the right DLPFC (BA9) during loss anticipation. Correlation analyses were also conducted on connectivity values showing significant group differences among all analyses and patients' overall symptom severity using SPSS. However, there were no significant associations between connectivity measures and symptom severity. More detailed results and discussions for exploratory ROI-wise connectivity analysis were provided in the Supplementary material.
Fig. 6.
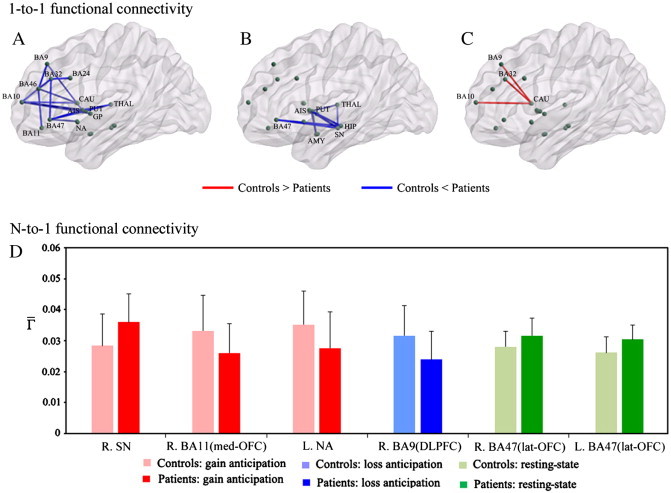
Results from exploratory ROI-wise connectivity analyses. Top figures indicate significant group differences in region-wise (1-to-1) functional connectivity during (A) resting-state, (B) gain anticipation, and (C) loss anticipation. To localize specific pairs of brain regions in which functional connectivity was altered in patients, we used a network-based-statistic approach (NBS). Bottom panel (D) indicates significant group differences in total (N-to-1) functional connectivity degree of each brain region for each behavioral state. To determine significant differences in the two groups, we performed permutation-based multiple comparison correction (p < 0.05). R, right; L, left; med, medial; lat, lateral; BA, Brodmann area; NA, nucleus accumbens; SN, substantia nigra; OFC, orbitofrontal cortex; DLPFC, dorsolateral prefrontal cortex. AMY, amygdala; HIP, hippocampus; AIS, anterior insula; CAU, caudate nucleus; PUT, putamen; GP, globus pallidus; THAL, thalamus. Please see Fig. 1 for abbreviations.
4. Discussion
This is the first study to investigate changes in the FC of the corticostriatal-limbic reward network, a system relevant to both the pathophysiology of OCD and incentive processing in unmedicated patients with OCD, during the MID task and resting-state. The main findings of this study were as follows: (i) OCD patients had significantly increased FC of NA with the lat-OFC and significantly decreased FC of NA with the insula during resting-state; (ii) patients' overall symptom severity correlated with the strength of FC between the NA and OFC regions during resting-state; (iii) during incentive processing, OCD patients showed decreased FC of NA with the AMY; (iv) OCD patients showed aberrant NA connectivity modulation between rest and task, particularly in FC of the NA with the med-OFC and rostral ACC; (v) consistent with the findings from voxel-wise FC analysis, exploratory ROI-wise analyses also revealed significantly increased FC between the NA and lat-OFC in patients during resting-state.
4.1. Ventral striatal functional connectivity
During resting-state, the pattern of voxel-wise FC to the NA seed was quite similar to the reward network reported in previous studies (Camara et al., 2009; Haber and Knutson, 2010; Milad and Rauch, 2012). The current findings reveal that OCD patients had increased FC between the NA and lat-OFC compared with controls. A preponderance of evidence for structural and functional abnormalities in this region in OCD patients (Kwon et al., 2009; Saxena and Rauch, 2000) suggests that the OFC is integral to the neurobiological model of this disorder (Chamberlain et al., 2008; Saxena et al., 2001). Additionally, this region is critical for adaptive behavior. However, previous studies have generally associated the OFC with OCD pathophysiology without an explicit distinction between the differential roles of the med-OFC and lat-OFC. This is an important distinction, as recent neuroimaging studies have demonstrated functional subdivisions of the OFC (Kahnt et al., 2012; Kringelbach and Rolls, 2004). The lat-OFC is thought to process negative valence (punishment) and behavioral responses, particularly behavioral inhibition in a motivational context (Ursu et al., 2008), whereas the med-OFC is thought to process positive valence (reward) and emotional processing (Elliott et al., 2000; O'Doherty et al., 2001).
The current findings show that during resting-state, the FC strength of the NA to the med-OFC was positively correlated with patients' symptom severity, whereas the FC of the NA to a more laterally placed area of the OFC was inversely associated with symptom severity. Based on the distinct roles of the two OFC subregions, the FC strength between the NA and lat-OFC in OCD patients during resting-state may be associated with processing related to the inhibition of their clinical symptoms and/or negative affective states associated with these symptoms. FC strength between the NA and med-OFC may be related to affective states associated with the clinical symptoms. Previous studies showing that larger changes in OCD scores are correlated with lower OFC activity during symptom provocation (Adler et al., 2000; Rauch et al., 1994) suggest that the OFC may play an inhibitory role in OCD. Using resting-state FC, Harrison et al. (2009) recently reported greater FC of the NA with both the anterolateral (BA47) and med-OFC in OCD patients. Particularly, dysfunction in the lat-OFC is considered a vulnerability marker of OCD, as such activity has been identified in unaffected relatives (Chamberlain et al., 2008). Therefore, although it is suggested here that the lat-OFC plays a crucial role in the pathophysiology of OCD, further studies should clarify the specific individual roles of the lat- and med-OFC in subgroups of patients with high and low levels of OCD symptoms.
Recently, researchers have emphasized the central role of brain regions such as the AMY, HIP, and insula, which are associated with affective/motivational processing in corticostriatal circuits, in the pathophysiology of OCD (Kwon et al., 2009; Menzies et al., 2008; Milad and Rauch, 2012). During gain and loss anticipation states, the NA in healthy controls was functionally connected to large parts of the affective network (i.e., limbic system) including the AMY, HIP, SN, THAL, and BG, whereas FC maps of OCD patients were quite different from those of controls. OCD patients showed increased FC between the NA and occipital regions but decreased FC between the NA and AMY during both gain and loss anticipation. Neural responses in sensory regions, including the occipital cortex, are modulated by attention (O'Connor et al., 2002), and it is thought that OCD patients focus their attention on incentive cues. An abnormal amygdala response to emotional stimuli was reported in OCD patients, albeit with inconsistent results, showing both hyper- (Cardoner et al., 2011) and hypo-responsiveness (Britton et al., 2010). Consistent with a previous study showing less amygdala activation in OCD patients in response to multiple emotional stimuli (Britton et al., 2010), subjects in the present study exhibited decreased FC in the AMY to both incentive cues. OCD patients also showed increased FC between the NA and posterior insula during gain anticipation, but the FC between these regions was decreased during resting-state. The posterior insula is known to be a primary interoceptive brain region, and it plays an important role in the sense of the physiological condition of the entire body (Craig, 2002). In this regard, aberrant FC in the posterior insula may be involved in deficits of homeostatic processes according to behavioral states.
A negatively correlated (anti-correlation) network with the NA seed was observed in healthy controls only during resting-state (Fig. 2); this closely matches the TPN, which is anti-correlated with the DMN. However, the anti-correlation network of the OCD group, including the occipital region, cerebellum, and THAL, generally did not overlap that of controls (Fig. 2; Fig. S2). These differences in anti-correlation network patterns resulted in significant group differences in TPN regions when comparing the FC difference maps between task and rest in the two groups (Fig. S2). However, several researchers have recommended caution during interpretation of anti-correlations when using global signal regression (Chang and Glover, 2009; Murphy et al., 2009) because there has been the debate about enhanced anti-correlation networks following global signal regression (Fox et al., 2009; Murphy et al., 2009). Therefore, further studies should confirm this finding in the anti-correlation network using other noise-reduction methods such as the component base noise-reduction method, which does not rely on global signal regression (Chai et al., 2012).
4.2. Methodological considerations in ventral striatal functional connectivity studies
There have been several studies demonstrating changes of ventral striatal FC during resting-state in OCD (Fitzgerald et al., 2011; Harrison et al., 2009, 2013; Sakai et al., 2011). Harrison et al. (2009) reported heightened connectivity of the inferior VS (VSi), corresponding to the NA, with both the anterolateral (BA 47) and medial portion of OFC in medicated OCD patients, while Sakai et al. (2011) demonstrated increased FC of the superior VS (VSs), corresponding to the ventral caudate, with the med-OFC region in non-medicated OCD patients. Fitzgerald et al. (2011) failed to show increased FC of the NA with the OFC in patients. Discrepancies and similarities between previous findings and our results may stem from differences in resting-state condition, ROI definition, and characteristics of the sample (i.e., symptom severity and symptom dimension). First, the strength of FC can be affected by resting-state conditions (i.e., eyes open (EO), EC, or EF) (Patriat et al., 2013; Yan et al., 2009). While three of the previous studies used EC resting-state data (Harrison et al., 2009, 2013; Sakai et al., 2011), Fitzgerald et al. (2011) and this study used EF resting-state data. Second, the spatial differences of seeds (e.g., seed size or location) can also influence the FC strength (Cole et al., 2010; Wang et al., 2009; Zalesky et al., 2010b). While the NA seed ROIs in this study was anatomically defined using AAL atlas, other studies used spherical seed ROIs as described by Di Martino et al. (2008). Third, differences in symptom severity and symptom dimensions in patients between the present and previous studies may have resulted in different strengths of FC. A significantly greater FC between the VS and anterolateral OFC regions was found in patients with moderate symptoms (the mean total Y-BOCS score < 23, Harrison et al., 2009, 2013), while it wasn't observed in patients with severe symptoms (the mean total Y-BOCS score > 24, Sakai et al., 2011). Interestingly, this idea was supported by our findings from the correlation analysis; FC strength of the NA to the med-OFC was positively correlated with total Y-BOCS score, whereas FC strength of the NA to the lat-OFC was negatively correlated with total Y-BOCS score during resting-state. Lastly, small sample size, heterogeneity of symptom dimensions, and effects of medication in patients may have caused limited power to detect the difference in the FC maps of the NA between patients and controls in previous studies. To address this issue, Harrison et al. (2013) recently investigated the influence of major OCD symptom dimensions on FC maps of VSi and dorsal caudate seeds in a large sample of medicated OCD patients (n = 74) and controls (n = 74). Similar to their past findings (Harrison et al., 2009), they found increased FC of the NA to the anterolateral OFC and med-OFC regions in OCD. They also reported reduced FC of the NA to the insula in OCD. Our findings are consistent with these results, showing increased FC of the NA to the anterolateral OFC and decreased FC of the NA to the insula during resting-state. Harrison et al. (2013) also demonstrated distinct neuroanatomical relationships between certain symptom dimensions and the FC of corticostriatal systems. Taken with the aforementioned results and our current findings, the increased FC of the VS to the OFC regions may be a common connectivity alteration in OCD regardless of the effects of particular symptom dimensions (Harrison et al., 2013) and medication.
4.3. Modulation of functional connectivity during resting and task states
We investigated how the resting-state FC of the NA changed in response to task demands in the two groups. Significant group differences on FC difference maps between rest and task were found in FC of the NA to the med-OFC and rostral ACC on FC difference maps between resting-state and loss anticipation. When extracting the connectivity strength within these regions for each condition (Fig. 4B), OCD patients, unlike controls, had less modulation of FC between these regions. This suggests that functional interactions of these regions persist between resting-state and loss anticipation (task-performance state). These two regions are involved in emotional processing and are part of the DMN. Some studies using resting-state FC reported positive functional connections between the NA and regions of the DMN (Duan et al., 2012; Kelly et al., 2009). Previous functional imaging studies using GLM analysis reported that OCD patients showed reduced DMN deactivation during task performance, particularly in the med-OFC (Fitzgerald et al., 2010; Stern et al., 2011). Thus, our current finding may be related to results showing FC deficits in the DMN of OCD patients (Jang et al., 2010).
4.4. Connectivity between regions belonging to the corticostriatal-limbic network as exploratory ROI-wise analysis
In 1-to-1 connectivity analysis, OCD patients show increased FC in regional pairs between the BG and PFC regions during resting-state and between the striatum and limbic regions during gain anticipation. Particularly, increased FC between the NA and lat-OFC (BA47) during resting-state was found in OCD patients, which is consistent with results from voxel-wise FC analyses. The between-group comparisons in N-to-1 connectivity showed an increased value for the lat-OFC during resting-state and declines in values in the NA and med-OFC, main areas associated with reward processing, during gain anticipation in OCD patients. Interestingly, abnormalities in FC between the NA and lat-OFC in patients were found in both voxel-wise and exploratory ROI-wise FC analyses. Taken together, this result suggests that altered FC of the lat-OFC with other regions within corticostriatal-limbic network is a reliable pathophysiology of OCD that is consistently found regardless of which analytic method is used.
4.5. Limitations
There are some limitations in this study. First, although patients who had comorbid depressive disorder were excluded from this study, depression symptoms in patients could have confounding effects. However, our main findings remained unchanged when the data were reanalyzed with the inclusion of BDI as a covariate, showing altered FC of the NA with the lat-OFC and insula during resting-state and with the AMY during incentive processing. Second, small sample size and heterogeneity of symptom dimensions could have influenced the present findings. However, our findings were consistent with results from previous studies that examined the effects of symptom dimensions on the FC in a large OCD sample, showing increased FC between the NA and OFC regions and reduced FC between the NA and insula during resting-state (Harrison et al., 2013). Finally, although using seed ROIs defined by brain atlases is prevalent, spatial differences between seed ROIs (i.e., seed size) for exploratory ROI-wise connectivity analysis could have impacts on FC (Cole et al., 2010; Wang et al., 2009; Zalesky et al., 2010b).
5. Conclusions
Our results reveal specific abnormalities in FC of the NA in OCD, showing increased FC of the NA to the lat-OFC during resting-state and decreased FC of the NA to the AMY during incentive processing. These findings provide direct evidence of altered FC in corticostriatal-limbic network during incentive processing and resting-state, particularly deficits in striatal–amygdala and striatal–orbitofrontal interactions respectively. Further, our findings suggest that OCD patients may have deficient modulation of FC within the corticostriatal-limbic network associated with affective and motivational states. These connectivity abnormalities may underpin some of affective and motivational disturbances observed in OCD.
Funding information
This research was supported by the National Research Foundation of Korea (NRF) Grant funded by the Korea Government (MEST) (no. 2011-0015639); and a grant of the Korea Health Technology R&D Project, Ministry of Health & Welfare, Republic of Korea (A110094); and a grant (2009K001270) from the Brain Research Center of the 21st Century Frontier Research Program funded by the Ministry of Education, Science and Technology, the Republic of Korea. These funding bodies had no specific role in the design and conduct of the study; collection, analysis and interpretation of data; in the writing of the report and in the decision to submit the article for publication.
Acknowledgments
The authors would like to thank our patients and their families as well as the staff at the Clinical Cognitive Neuroscience Center (CCNC) for their generous contributions to this research. The authors would also like to thank Chun Kee Chung, Min-Sup Shin, Sang Jeong Kim and Yeon Ho Joo for helpful comments, Ji Yeon Han and Bon-Mi Gu for their invaluable help on the task design and data collection, Kang-Ik Kevin Cho and Da-Jung Shin for English revision of the manuscript, Sang-yoon Jamie Jung for comments and support during the review process, and Yong He, Jinhui Wang, Xin-di Wang, and Mingrui Xia for their development of GRETNA and BrainNet Viewer.
Footnotes
This is an open-access article distributed under the terms of the Creative Commons Attribution-NonCommercial-No Derivative Works License, which permits non-commercial use, distribution, and reproduction in any medium, provided the original author and source are credited.
Appendix A. Supplementary data
Supplementary materials for more detailed methods, results, and discussion.
References
- Adler C.M., McDonough-Ryan P., Sax K.W., Holland S.K., Arndt S., Strakowski S.M. FMRI of neuronal activation with symptom provocation in unmedicated patients with obsessive compulsive disorder. Journal of Psychiatric Research. 2000;34:317–324. doi: 10.1016/s0022-3956(00)00022-4. [DOI] [PubMed] [Google Scholar]
- Arbabshirani M.R., Havlicek M., Kiehl K.A., Pearlson G.D., Calhoun V.D. Functional network connectivity during rest and task conditions: a comparative study. Human Brain Mapping. 2013 doi: 10.1002/hbm.22118. in press. [DOI] [PMC free article] [PubMed] [Google Scholar]
- Atmaca M., Yildirim H., Koc M., Korkmaz S., Ozler S., Erenkus Z. Do defense styles of ego relate to volumes of orbito-frontal cortex in patients with obsessive–compulsive disorder? Psychiatry Investigations. 2011;8:123–129. doi: 10.4306/pi.2011.8.2.123. [DOI] [PMC free article] [PubMed] [Google Scholar]
- Britton J.C., Stewart S.E., Killgore W.D., Rosso I.M., Price L.M., Gold A.L., Pine D.S., Wilhelm S., Jenike M.A., Rauch S.L. Amygdala activation in response to facial expressions in pediatric obsessive–compulsive disorder. Depression and Anxiety. 2010;27:643–651. doi: 10.1002/da.20718. [DOI] [PMC free article] [PubMed] [Google Scholar]
- Camara E., Rodriguez-Fornells A., Ye Z., Münte T.F. Reward networks in the brain as captured by connectivity measures. Frontiers in Neuroscience. 2009;3:350–362. doi: 10.3389/neuro.01.034.2009. [DOI] [PMC free article] [PubMed] [Google Scholar]
- Camargo A., Azuaje F., Wang H., Zheng H. Permutation-based statistical tests for multiple hypotheses. Source Code for Biology and Medicine. 2008;3:15. doi: 10.1186/1751-0473-3-15. [DOI] [PMC free article] [PubMed] [Google Scholar]
- Cardoner N., Harrison B.J., Pujol J., Soriano-Mas C., Hernández-Ribas R., López-Solá M., Real E., Deus J., Ortiz H., Alonso P., Menchón J.M. Enhanced brain responsiveness during active emotional face processing in obsessive compulsive disorder. The World Journal of Biological Psychiatry. 2011;12:349–363. doi: 10.3109/15622975.2011.559268. [DOI] [PubMed] [Google Scholar]
- Cavedini P., Gorini A., Bellodi L. Understanding obsessive–compulsive disorder: focus on decision making. Neuropsychology Review. 2006;16:3–15. doi: 10.1007/s11065-006-9001-y. [DOI] [PubMed] [Google Scholar]
- Chai X.J., Castañón A.N., Ongür D., Whitfield-Gabrieli S. Anticorrelations in resting state networks without global signal regression. NeuroImage. 2012;59:1420–1428. doi: 10.1016/j.neuroimage.2011.08.048. [DOI] [PMC free article] [PubMed] [Google Scholar]
- Chamberlain S.R., Fineberg N.A., Menzies L.A., Blackwell A.D., Bullmore E.T., Robbins T.W., Sahakian B.J. Impaired cognitive flexibility and motor inhibition in unaffected first-degree relatives of patients with obsessive–compulsive disorder. The American Journal of Psychiatry. 2007;164:335–338. doi: 10.1176/appi.ajp.164.2.335. [DOI] [PMC free article] [PubMed] [Google Scholar]
- Chamberlain S.R., Menzies L., Hampshire A., Suckling J., Fineberg N.A., del Campo N., Aitken M., Craig K., Owen A.M., Bullmore E.T., Robbins T.W., Sahakian B.J. Orbitofrontal dysfunction in patients with obsessive–compulsive disorder and their unaffected relatives. Science. 2008;321:421–422. doi: 10.1126/science.1154433. [DOI] [PubMed] [Google Scholar]
- Chang C., Glover G.H. Effects of model-based physiological noise correction on default mode network anti-correlations and correlations. NeuroImage. 2009;47:1448–1459. doi: 10.1016/j.neuroimage.2009.05.012. [DOI] [PMC free article] [PubMed] [Google Scholar]
- Choi W.H., Son J.W., Kim Y.R., Oh J.H., Lee S.I., Shin C.J., Kim S.K., Ju G., Lee S., Jo S., Ha T.H. An FMRI study investigating adolescent brain activation by rewards and feedback. Psychiatry Investigations. 2013;10:47–55. doi: 10.4306/pi.2013.10.1.47. [DOI] [PMC free article] [PubMed] [Google Scholar]
- Chumbley J.R., Friston K.J. False discovery rate revisited: FDR and topological inference using Gaussian random fields. NeuroImage. 2009;44:62–70. doi: 10.1016/j.neuroimage.2008.05.021. [DOI] [PubMed] [Google Scholar]
- Chumbley J., Worsley K., Flandin G., Friston K. Topological FDR for neuroimaging. NeuroImage. 2010;49:3057–3064. doi: 10.1016/j.neuroimage.2009.10.090. [DOI] [PMC free article] [PubMed] [Google Scholar]
- Cole D.M., Smith S.M., Beckmann C.F. Advances and pitfalls in the analysis and interpretation of resting-state FMRI data. Frontiers in Systems Neuroscience. 2010;4:8. doi: 10.3389/fnsys.2010.00008. [DOI] [PMC free article] [PubMed] [Google Scholar]
- Craig A.D. How do you feel? Interoception: the sense of the physiological condition of the body. Nature Reviews Neuroscience. 2002;3:655–666. doi: 10.1038/nrn894. [DOI] [PubMed] [Google Scholar]
- Denys D., Zohar J., Westenberg H.G. The role of dopamine in obsessive–compulsive disorder: preclinical and clinical evidence. The Journal of Clinical Psychiatry. 2004;65:11–17. [PubMed] [Google Scholar]
- Denys D., Mantione M., Figee M., van den Munckhof P., Koerselman F., Westenberg H., Bosch A., Schuurman R. Deep brain stimulation of the nucleus accumbens for treatment-refractory obsessive-compulsive disorder. Archives of General Psychiatry. 2010;67:1061–1068. doi: 10.1001/archgenpsychiatry.2010.122. [DOI] [PubMed] [Google Scholar]
- Di Martino A., Scheres A., Margulies D.S., Kelly A.M., Uddin L.Q., Shehzad Z., Biswal B., Walters J.R., Castellanos F.X., Milham M.P. Functional connectivity of human striatum: a resting state FMRI study. Cerebral Cortex. 2008;18:2735–2747. doi: 10.1093/cercor/bhn041. [DOI] [PubMed] [Google Scholar]
- Duan X., He S., Liao W., Liang D., Qiu L., Wei L., Li Y., Liu C., Gong Q., Chen H. Reduced caudate volume and enhanced striatal-DMN integration in chess experts. NeuroImage. 2012;60:1280–1286. doi: 10.1016/j.neuroimage.2012.01.047. [DOI] [PubMed] [Google Scholar]
- Elliott R., Dolan R.J., Frith C.D. Dissociable functions in the medial and lateral orbitofrontal cortex: evidence from human neuroimaging studies. Cerebral Cortex. 2000;10:308–317. doi: 10.1093/cercor/10.3.308. [DOI] [PubMed] [Google Scholar]
- Figee M., Vink M., de Geus F., Vulink N., Veltman D.J., Westenberg H., Denys D. Dysfunctional reward circuitry in obsessive–compulsive disorder. Biological Psychiatry. 2011;69:867–874. doi: 10.1016/j.biopsych.2010.12.003. [DOI] [PubMed] [Google Scholar]
- Fitzgerald K.D., Stern E.R., Angstadt M., Nicholson-Muth K.C., Maynor M.R., Welsh R.C., Hanna G.L., Taylor S.F. Altered function and connectivity of the medial frontal cortex in pediatric obsessive–compulsive disorder. Biological Psychiatry. 2010;68:1039–1047. doi: 10.1016/j.biopsych.2010.08.018. [DOI] [PMC free article] [PubMed] [Google Scholar]
- Fitzgerald K.D., Welsh R.C., Stern E.R., Angstadt M., Hanna G.L., Abelson J.L., Taylor S.F. Developmental alterations of frontal–striatal–thalamic connectivity in obsessive–compulsive disorder. Journal of the American Academy of Child and Adolescent Psychiatry. 2011;50:938–948. doi: 10.1016/j.jaac.2011.06.011. (e3) [DOI] [PMC free article] [PubMed] [Google Scholar]
- Fornito A., Yoon J., Zalesky A., Bullmore E.T., Carter C.S. General and specific functional connectivity disturbances in first-episode schizophrenia during cognitive control performance. Biological Psychiatry. 2011;70:64–72. doi: 10.1016/j.biopsych.2011.02.019. [DOI] [PMC free article] [PubMed] [Google Scholar]
- Fox M.D., Snyder A.Z., Vincent J.L., Corbetta M., Van Essen D.C., Raichle M.E. The human brain is intrinsically organized into dynamic, anticorrelated functional networks. Proceedings of the National Academy of Sciences of the United States of America. 2005;102:9673–9678. doi: 10.1073/pnas.0504136102. [DOI] [PMC free article] [PubMed] [Google Scholar]
- Fox M.D., Zhang D., Snyder A.Z., Raichle M.E. The global signal and observed anticorrelated resting state brain networks. Journal of Neurophysiology. 2009;101:3270–3283. doi: 10.1152/jn.90777.2008. [DOI] [PMC free article] [PubMed] [Google Scholar]
- Gu B.M., Park J.Y., Kang D.H., Lee S.J., Yoo S.Y., Jo H.J., Choi C.H., Lee J.M., Kwon J.S. Neural correlates of cognitive inflexibility during task-switching in obsessive–compulsive disorder. Brain. 2008;131(Pt 1):155–164. doi: 10.1093/brain/awm277. [DOI] [PubMed] [Google Scholar]
- Haber S.N., Knutson B. The reward circuit: linking primate anatomy and human imaging. Neuropsychopharmacology. 2010;35:4–26. doi: 10.1038/npp.2009.129. [DOI] [PMC free article] [PubMed] [Google Scholar]
- Han J.Y., Kang D.H., Gu B.M., Jung W.H., Choi J.S., Choi C.H., Jang J.H., Kwon J.S. Altered brain activation in ventral frontal–striatal regions following a 16-week pharmacotherapy in unmedicated obsessive–compulsive disorder. Journal of Korean Medical Science. 2011;26:665–674. doi: 10.3346/jkms.2011.26.5.665. [DOI] [PMC free article] [PubMed] [Google Scholar]
- Harrison B.J., Soriano-Mas C., Pujol J., Ortiz H., López-Solà M., Hernández-Ribas R., Deus J., Alonso P., Yücel M., Pantelis C., Menchon J.M., Cardoner N. Altered corticostriatal functional connectivity in obsessive–compulsive disorder. Archives of General Psychiatry. 2009;66:1189–1200. doi: 10.1001/archgenpsychiatry.2009.152. [DOI] [PubMed] [Google Scholar]
- Harrison B.J., Pujol J., Cardoner N., Deus J., Alonso P., López-Solà M., Contreras-Rodríguez O., Real E., Segalàs C., Blanco-Hinojo L., Menchon J.M., Soriano-Mas C. Brain corticostriatal systems and the major clinical symptom dimensions of obsessive–compulsive disorder. Biological Psychiatry. 2013;73:321–328. doi: 10.1016/j.biopsych.2012.10.006. [DOI] [PubMed] [Google Scholar]
- Huey E.D., Zahn R., Krueger F., Moll J., Kapogiannis D., Wassermann E.M., Grafman J.A. Psychological and neuroanatomical model of obsessive–compulsive disorder. Journal of Neuropsychiatry and Clinical Neurosciences. 2008;20:390–408. doi: 10.1176/appi.neuropsych.20.4.390. [DOI] [PMC free article] [PubMed] [Google Scholar]
- Jang J.H., Kim J.H., Jung W.H., Choi J.S., Jung M.H., Lee J.M., Choi C.H., Kang D.H., Kwon J.S. Functional connectivity in fronto-subcortical circuitry during the resting state in obsessive–compulsive disorder. Neuroscience Letters. 2010;474:158–162. doi: 10.1016/j.neulet.2010.03.031. [DOI] [PubMed] [Google Scholar]
- Jiang T., He Y., Zang Y., Weng X. Modulation of functional connectivity during the resting state and the motor task. Human Brain Mapping. 2004;22:63–71. doi: 10.1002/hbm.20012. [DOI] [PMC free article] [PubMed] [Google Scholar]
- Jung W.H., Kang D.H., Han J.Y., Jang J.H., Gu B.M., Choi J.S., Jung M.H., Choi C.H., Kwon J.S. Aberrant ventral striatal responses during incentive processing in unmedicated patients with obsessive–compulsive disorder. Acta Psychiatrica Scandinavica. 2011;123:376–386. doi: 10.1111/j.1600-0447.2010.01659.x. [DOI] [PubMed] [Google Scholar]
- Kahnt T., Chang L.J., Park S.Q., Heinzle J., Haynes J.D. Connectivity-based parcellation of the human orbitofrontal cortex. Journal of Neuroscience. 2012;32:6240–6250. doi: 10.1523/JNEUROSCI.0257-12.2012. [DOI] [PMC free article] [PubMed] [Google Scholar]
- Kaufmann C., Beucke J.C., Preuße F., Endrass T., Schlagenhauf F., Heinz A., Juckel G., Kathmann N. Medial prefrontal brain activation to anticipated reward and loss in obsessive–compulsive disorder. NeuroImage: Clinical. 2013;2:212–220. doi: 10.1016/j.nicl.2013.01.005. [DOI] [PMC free article] [PubMed] [Google Scholar]
- Kelly C., de Zubicaray G., Di Martino A., Copland D.A., Reiss P.T., Klein D.F., Castellanos F.X., Milham M.P., McMahon K. l-Dopa modulates functional connectivity in striatal cognitive and motor networks: a double-blind placebo-controlled study. Journal of Neuroscience. 2009;29:7364–7378. doi: 10.1523/JNEUROSCI.0810-09.2009. [DOI] [PMC free article] [PubMed] [Google Scholar]
- Knutson B., Fong G.W., Adams C.M., Varner J.L., Hommer D. Dissociation of reward anticipation and outcome with event-related fMRI. NeuroReport. 2001;12:3683–3687. doi: 10.1097/00001756-200112040-00016. [DOI] [PubMed] [Google Scholar]
- Kringelbach M.L., Rolls E.T. The functional neuroanatomy of the human orbitofrontal cortex: evidence from neuroimaging and neuropsychology. Progress in Neurobiology. 2004;72:341–372. doi: 10.1016/j.pneurobio.2004.03.006. [DOI] [PubMed] [Google Scholar]
- Kwon J.S., Jang J.H., Choi J.S., Kang D.H. Neuroimaging in obsessive–compulsive disorder. Expert Review of Neurotherapeutics. 2009;9:255–269. doi: 10.1586/14737175.9.2.255. [DOI] [PubMed] [Google Scholar]
- Menzies L., Chamberlain S.R., Laird A.R., Thelen S.M., Sahakian B.J., Bullmore E.T. Integrating evidence from neuroimaging and neuropsychological studies of obsessive–compulsive disorder: the orbitocorticostriatal model revisited. Neuroscience and Biobehavioral Reviews. 2008;32:525–549. doi: 10.1016/j.neubiorev.2007.09.005. [DOI] [PMC free article] [PubMed] [Google Scholar]
- Milad M.R., Rauch S.L. Obsessive–compulsive disorder: beyond segregated cortico-striatal pathways. Trends in Cognitive Sciences. 2012;16:43–51. doi: 10.1016/j.tics.2011.11.003. [DOI] [PMC free article] [PubMed] [Google Scholar]
- Murphy K., Birn R.M., Handwerker D.A., Jones T.B., Bandettini P.A. The impact of global signal regression on resting state correlations: are anti-correlated networks introduced? NeuroImage. 2009;44:893–905. doi: 10.1016/j.neuroimage.2008.09.036. [DOI] [PMC free article] [PubMed] [Google Scholar]
- Northoff G., Qin P., Nakao T. Rest-stimulus interaction in the brain: a review. Trends in Neurosciences. 2010;33:277–284. doi: 10.1016/j.tins.2010.02.006. [DOI] [PubMed] [Google Scholar]
- O'Connor D.H., Fukui M.M., Pinsk M.A., Kastner S. Attention modulates responses in the human lateral geniculate nucleus. Nature Neuroscience. 2002;5:1203–1209. doi: 10.1038/nn957. [DOI] [PubMed] [Google Scholar]
- O'Doherty J., Kringelbach M.L., Rolls E.T., Hornak J., Andrews C. Abstract reward and punishment representations in the human orbitofrontal cortex. Nature Neuroscience. 2001;4:95–102. doi: 10.1038/82959. [DOI] [PubMed] [Google Scholar]
- Page L.A., Rubia K., Deeley Q., Daly E., Toal F., Mataix-Cols D., Giampietro V., Schmitz N., Murphy D.G. A functional magnetic resonance imaging study of inhibitory control in obsessive–compulsive disorder. Psychiatry Research. 2009;174:202–209. doi: 10.1016/j.pscychresns.2009.05.002. [DOI] [PubMed] [Google Scholar]
- Patriat R., Molloy E.K., Meier T.B., Kirk G.R., Nair V.A., Meyerand M.E., Prabhakaran V., Birn R.M. The effect of resting condition on resting-state fMRI reliability and consistency: a comparison between resting with eyes open, closed, and fixated. NeuroImage. 2013;78:463–473. doi: 10.1016/j.neuroimage.2013.04.013. in press. [DOI] [PMC free article] [PubMed] [Google Scholar]
- Radua J., van den Heuvel O.A., Surguladze S., Mataix-Cols D. Meta-analytical comparison of voxel-based morphometry studies in obsessive–compulsive disorder vs other anxiety disorders. Archives of General Psychiatry. 2010;67:701–711. doi: 10.1001/archgenpsychiatry.2010.70. [DOI] [PubMed] [Google Scholar]
- Rauch S.L., Jenike M.A., Alpert N.M., Baer L., Breiter H.C., Savage C.R., Fischman A.J. Regional cerebral blood flow measured during symptom provocation in obsessive–compulsive disorder using oxygen 15-labeled carbon dioxide and positron emission tomography. Archives of General Psychiatry. 1994;51:62–70. doi: 10.1001/archpsyc.1994.03950010062008. [DOI] [PubMed] [Google Scholar]
- Remijnse P.L., Nielen M.M., van Balkom A.J., Cath D.C., van Oppen P., Uylings H.B., Veltman D.J. Reduced orbitofrontal–striatal activity on a reversal learning task in obsessive–compulsive disorder. Archives of General Psychiatry. 2006;63:1225–1236. doi: 10.1001/archpsyc.63.11.1225. [DOI] [PubMed] [Google Scholar]
- Rissman J., Gazzaley A., D'Esposito M. Measuring functional connectivity during distinct stages of a cognitive task. NeuroImage. 2004;23:752–763. doi: 10.1016/j.neuroimage.2004.06.035. [DOI] [PubMed] [Google Scholar]
- Sakai Y., Narumoto J., Nishida S., Nakamae T., Yamada K., Nishimura T., Fukui K. Corticostriatal functional connectivity in non-medicated patients with obsessive–compulsive disorder. European Psychiatry. 2011;26:463–469. doi: 10.1016/j.eurpsy.2010.09.005. [DOI] [PubMed] [Google Scholar]
- Saxena S., Rauch S.L. Functional neuroimaging and the neuroanatomy of obsessive–compulsive disorder. The Psychiatric Clinics of North America. 2000;23:563–586. doi: 10.1016/s0193-953x(05)70181-7. [DOI] [PubMed] [Google Scholar]
- Saxena S., Brody A.L., Ho M.L., Alborzian S., Ho M.K., Maidment K.M., Huang S.C., Wu H.M., Au S.C., Baxter L.R., Jr. Cerebral metabolism in major depression and obsessive–compulsive disorder occurring separately and concurrently. Biological Psychiatry. 2001;50:159–170. doi: 10.1016/s0006-3223(01)01123-4. [DOI] [PubMed] [Google Scholar]
- Song A., Jung W.H., Jang J.H., Kim E., Shim G., Park H.Y., Choi C.H., Kwon J.S. Disproportionate alterations in the anterior and posterior insular cortices in obsessive–compulsive disorder. PLoS One. 2011;6:e22361. doi: 10.1371/journal.pone.0022361. [DOI] [PMC free article] [PubMed] [Google Scholar]
- Song X.W., Dong Z.Y., Long X.Y., Li S.F., Zuo X.N., Zhu C.Z., He Y., Yan C.G., Zang Y.F. REST: a toolkit for resting-state functional magnetic resonance imaging data processing. PLoS One. 2011;6:e25031. doi: 10.1371/journal.pone.0025031. [DOI] [PMC free article] [PubMed] [Google Scholar]
- Stern E.R., Welsh R.C., Fitzgerald K.D., Gehring W.J., Lister J.J., Himle J.A., Abelson J.L., Taylor S.F. Hyperactive error responses and altered connectivity in ventromedial and frontoinsular cortices in obsessive–compulsive disorder. Biological Psychiatry. 2011;69:583–591. doi: 10.1016/j.biopsych.2010.09.048. [DOI] [PMC free article] [PubMed] [Google Scholar]
- Tzourio-Mazoyer N., Landeau B., Papathanassiou D., Crivello F., Etard O., Delcroix N., Mazoyer B., Joliot M. Automated anatomical labeling of activations in SPM using a macroscopic anatomical parcellation of the MNI MRI single-subject brain. NeuroImage. 2002;15:273–289. doi: 10.1006/nimg.2001.0978. [DOI] [PubMed] [Google Scholar]
- Ursu S., Clark K.A., Stenger V.A., Carter C.S. Distinguishing expected negative outcomes from preparatory control in the human orbitofrontal cortex. Brain Research. 2008;1227:110–119. doi: 10.1016/j.brainres.2008.06.033. [DOI] [PMC free article] [PubMed] [Google Scholar]
- van der Wee N.J., Stevens H., Hardeman J.A., Mandl R.C., Denys D.A., van Megen H.J., Kahn R.S., Westenberg H.M. Enhanced dopamine transporter density in psychotropic-naive patients with obsessive–compulsive disorder shown by [123I]{beta}-CIT SPECT. The American Journal of Psychiatry. 2004;161:2201–2206. doi: 10.1176/appi.ajp.161.12.2201. [DOI] [PubMed] [Google Scholar]
- Wang J., Wang L., Zang Y., Yang H., Tang H., Gong Q., Chen Z., Zhu C., He Y. Parcellation-dependent small-world brain functional networks: a resting-state fMRI study. Human Brain Mapping. 2009;30:1511–1523. doi: 10.1002/hbm.20623. [DOI] [PMC free article] [PubMed] [Google Scholar]
- Whiteside S.P., Port J.D., Abramowitz J.S. A meta-analysis of functional neuroimaging in obsessive–compulsive disorder. Psychiatry Research. 2004;132:69–79. doi: 10.1016/j.pscychresns.2004.07.001. [DOI] [PubMed] [Google Scholar]
- Yan C., Liu D., He Y., Zou Q., Zhu C., Zuo X., Long X., Zang Y. Spontaneous brain activity in the default mode network is sensitive to different resting-state conditions with limited cognitive load. PLoS One. 2009;4:e5743. doi: 10.1371/journal.pone.0005743. [DOI] [PMC free article] [PubMed] [Google Scholar]
- Ye Z., Hammer A., Camara E., Münte T.F. Pramipexole modulates the neural network of reward anticipation. Human Brain Mapping. 2011;32:800–811. doi: 10.1002/hbm.21067. [DOI] [PMC free article] [PubMed] [Google Scholar]
- Zalesky A., Fornito A., Bullmore E.T. Network-based statistic: identifying differences in brain networks. NeuroImage. 2010;53:1197–1207. doi: 10.1016/j.neuroimage.2010.06.041. [DOI] [PubMed] [Google Scholar]
- Zalesky A., Fornito A., Harding I.H., Cocchi L., Yücel M., Pantelis C., Bullmore E.T. Whole-brain anatomical networks: does the choice of nodes matter? NeuroImage. 2010;50:970–983. doi: 10.1016/j.neuroimage.2009.12.027. [DOI] [PubMed] [Google Scholar]
Associated Data
This section collects any data citations, data availability statements, or supplementary materials included in this article.
Supplementary Materials
Supplementary materials for more detailed methods, results, and discussion.