

Abstract
Human serum albumin (HSA) is a potent inhibitor of Aβ self-association and this novel, to our knowledge, function of HSA is of potential therapeutic interest for the treatment of Alzheimer’s disease. It is known that HSA interacts with Aβ oligomers through binding sites evenly partitioned across the three albumin domains and with comparable affinities. However, as of this writing, no information is available on the HSA-Aβ interactions beyond domain resolution. Here, we map the HSA-Aβ interactions at subdomain and peptide resolution. We show that each separate subdomain of HSA domain 3 inhibits Aβ self-association. We also show that fatty acids (FAs) compete with Aβ oligomers for binding to domain 3, but the determinant of the HSA/Aβ oligomer interactions are markedly distinct from those of FAs. Although salt bridges with the FA carboxylate determine the FA binding affinities, hydrophobic contacts are pivotal for Aβ oligomer recognition. Specifically, we identified a site of Aβ oligomer recognition that spans the HSA (494–515) region and aligns with the central hydrophobic core of Aβ. The HSA (495–515) segment includes residues affected by FA binding and this segment is prone to self-associate into β-amyloids, suggesting that sites involved in fibrilization may provide a lead to develop inhibitors of Aβ self-association.
Abbreviations: AD, Alzheimer’s Disease; BBB, Blood Brain Barrier; CNS, Central Nervous System; CSF, Cerebrospinal Fluid; FA, Fatty Acid; HSA, Human Serum Albumin; ICP, Inductively Coupled Plasma; MA, Myristic Acid; SL, Spin-Lock; RC, Random Coil; STD, Saturation Transfer Difference; STR, Saturation Transfer Reference; WG, Watergate water-suppression NMR technique
Introduction
Late-onset Alzheimer’s disease is associated with impairment in the clearance of the amyloid beta (Aβ) peptide (1–8). The Aβ peptide clearance from the brain relies on the Aβ transport through the blood-brain barrier promoted by agents that do not penetrate the blood-brain barrier, but bind Aβ in plasma. Such agents drive an equilibrium shift of Aβ from the brain toward the periphery, as posited by the peripheral-sink hypothesis (9). Because ∼90% of circulating plasma Aβ is bound to human serum albumin (HSA), HSA is a key mediator of Aβ clearance. The pivotal role of albumin in Aβ clearance is also confirmed by recent clinical investigations showing that low concentrations of albumin in plasma are associated with cognitive impairment (10,11). Moreover, albumin replacement through plasma dialysis has been proposed as a promising strategy for the treatment of mild Alzheimer’s disease (12). Given the physiological and potential therapeutic relevance of the Aβ-albumin interactions, the stoichiometry and affinity of the Aβ-albumin complexes have been recently investigated (13). These investigations have revealed that albumin selectively targets Aβ oligomers (denoted here as Aβn) rather than Aβ monomers (denoted here as Aβ1) (13). The Aβ oligomers are recognized by albumin through largely independent binding sites evenly partitioned across the three albumin domains (Fig. 1 a) and with comparable dissociation constants in the sub-μM range (13). Such degeneracy in the Aβ binding sites within albumin implies that each single albumin domain can be used as a model system to further probe the HSA/Aβ interactions. However, the binding sites for the Aβ oligomers within HSA have not been mapped beyond domain resolution, due to experimental challenges arising from the transient nature and the high molecular weight (MW) of the Aβ oligomers interacting with HSA.
Figure 1.
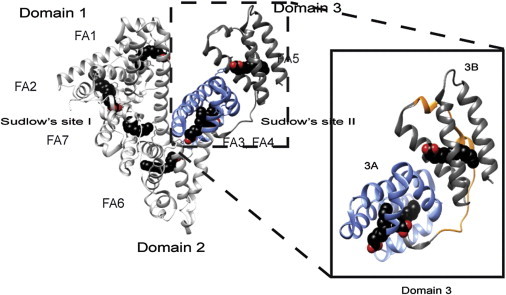
X-ray crystal structures of HSA-bound myristic acid (PDB:1E7G). Myristate molecules are shown in space-filling representation and are colored by atom: carbon (black), oxygen (red). Major drug binding sites are labeled as Sudlow’s sites I and II and their location in the 2A and 3A subdomains, respectively, is indicated. (Inset) Detail of the structures of domain-3, subdomains 3A (blue), 3B, and the HSA (495–515) segment (orange), for which the Aβ interactions were investigated here. To see this figure in color, go online.
Here, we show how the interactions of domain 3 of HSA with Aβ oligomers can be mapped at subdomain and peptide resolution. We specifically focus on domain 3 (i.e., HSA 381–585), because it remains well structured and soluble even when in isolation (13,14). In addition, domain 3 includes high-affinity fatty-acid (FA) binding sites and therefore it is a suitable construct to explore the competition between Aβ oligomers and FAs, such as myristic acid (MA). Because the binding of MA to domain 3 has been structurally well characterized (Fig. 1 b) (15–19), the MA-versus-Aβ competition is an effective approach to start mapping the Aβ/domain-3 interactions. However, given the presence of multiple MA binding sites and the possibility of indirect allosteric effects, competitive binding and inhibition experiments alone are not sufficient to narrow down the Aβ binding sites within domain 3. We therefore complement the FA-versus-Aβ competition experiments with comparative mutational analyses. Mutants include subdomain deletions (i.e., subdomains 3A and 3B) and point mutations within each subdomain at sites of FA binding. The combination of comparative mutational analyses and competition experiments monitored by NMR provides a viable experimental strategy to effectively circumvent the challenges in mapping interactions with large and transient Aβ oligomers.
Our results show that FAs compete with Aβ oligomer for binding to domain 3 of HSA and that, similarly to FAs, Aβ oligomers interact with both subdomains 3A and 3B, although not all the residues critical to bind FA interact with the Aβ oligomers. In addition, we took our reductionist approach one step further and we identified, using a combination of bioinformatics and fluorescence, a contiguous putative Aβ interaction site in subdomain 3B. The subdomain-3B peptide spanning the identified Aβ interaction site was synthesized and tested for self-association inhibitory potency. The selected domain-3 peptide inhibits Aβ self-association and interestingly matches well with a region of albumin prone to amyloid fibril formation. These results suggest the intriguing hypothesis that a subset of the putative sites of Aβ-binding proteins involved in intermolecular contacts during protein self-association may also serve as possible Aβ recognition and inhibition sites.
Materials and Methods
Aβ (12–28) peptide sample preparation
The Aβ (12–28) peptide used in this investigation was purchased from Pepnome (Zhuhai City, China) with a purity of 98%. Lyophilized peptide was dissolved in 50-mM acetate buffer-d4 at pH 4.7, with 10% D2O to a concentration of 1 mM. After the peptide was dissolved, the solution was filtered through an Ultrafree-MC filter (Millipore, Billerica, MA) with a 30-kDa cutoff in 5-min intervals at 3000 rpm to remove aggregates formed during the peptide lyophilization and dissolution processes (13,20–22). To induce aggregation a 1-M NaCl solution prepared in 50-mM acetate buffer at pH 4.7 was then added to the filtered peptide sample up to a final concentration of 40-mM NaCl, followed by a seven-day incubation period at room temperature (13,21).
Aβ (1–42) peptide sample preparation
The Alzheimer’s peptide Aβ (1–42) was purchased from EZBiolab (Carmel, IN) with a purity >95%. A stock Aβ (1–42) solution was prepared by dissolving 5 mg of the Aβ (1–42) peptide in 2.5 mL of 10 mM NaOH (13,22). This stock solution was sonicated twice using 2-min intervals followed by 2-min incubation on ice. Immediately after sonication, the stock Aβ (1–42) solution was divided into 100-μL aliquots and frozen at −20°C. A quantity of 100 μL of the Aβ (1–42) stock solution was thawed and sonicated twice for 2 min with 2-min incubation on ice in-between before each experiment. A quantity of 450 μL of wild-type domain 3, domain 3 bound to myristic acid, and domain-3 mutant proteins in 20-mM sodium phosphate buffer at pH 7.4 was added to the sonicated peptides for collection of NMR spectra at 700 MHz with a TCI CyroProbe (Bruker BioSpin, Billerica, MA) and at 37°C. During the time between NMR data acquisition sessions, the NMR samples were stored in a water bath at 37°C and were not stirred or mixed.
Trifluoroacetic acid removal from the Aβ samples
Although all peptides were commercially obtained with >95% purity, they all contained residual trifluoroacetic acid, which is routinely used in the final stage of peptide purification. To avoid potential biases, trifluoroacetic acid was removed from the Ab samples before the addition of the domain 3 using at least three lyophilization steps in the presence of 50–100 mM HCl (23).
Preparation of human serum albumin peptides
Human serum albumin (HSA) peptides, HSA (495–515), HSA (495–515) reversed, and HSA (530–550) were purchased from GenScript USA (Piscataway, NJ) as a dry powder with purity >95%. A quantity of 0.5-mM peptides stock solutions was prepared by dissolving the lyophilized powder in water and adding 50 mM NaOH until the peptides were fully solubilized. Peptides concentration was determined by measuring their UV absorbance at 280 nm using 1490 M−1 cm−1 as extinction coefficient.
Preparation of myristic-acid stock
Myristic acid (MA) dry powder (Sigma 490873; Sigma-Aldrich, St. Louis, MO) was dissolved in DMSO-d6 at 100 mM. Afterwards aliquots of myristic acid were diluted to 1.5 mM in 20 mM sodium phosphate, pH 7.4 at 70°C. The stock was then cooled to 55°C and stored at that temperature for use in subsequent experiments. The myristic acid concentration was confirmed based on the comparison of the methyl signal intensity of the myristic acid 1H-NMR spectra to the methyl intensity of an octanoic acid internal standard (Sigma 153753; Sigma-Aldrich).
Protein subcloning, expression, and purification
The domain-3 gene flanked by the NdeI restriction enzyme site and six histidines at the N-terminus was generated in the pet15B vector, as previously published in Milojevic and Melacini (13). The Y411AR410A, R485AS489A, and K525A mutants were generated following standard PCR protocols. The 3A subdomain was generated by mutating T496 into a stop codon using as a primer
The 3B construct was generated by mutating D494 and E495 into an NdeI restriction enzyme site. This was accomplished using the primer
Because the 3A subdomain was flanked by the NdeI site, digestion of this mutated DNA resulted in the excision of the 3A subdomain from the domain-3 sequence. Subsequent ligation generated a 3B subdomain DNA construct. The sequence of each constructs was confirmed through PCR-based sequencing. All proteins samples were expressed and purified as previously described in the literature (13,14).
NMR spectroscopy
One-dimensional saturation transfer difference (STD) and saturation transfer reference (STR) experiments were used to monitor the effect of domain-3 mutants and deletion constructs on the Aβ (12–28) samples. In the STD measurements, saturation is transferred through chemical exchange from the Aβ (12–28) oligomers to the monomeric, and thus NMR-detectable, Aβ (12–28). Hence, the STD signal probes the interactions of monomeric Aβ (12–28) polypeptide chains with the Aβ (12–28) assemblies. Albumin competes with monomeric Aβ (12–28) for binding to oligomeric Aβ (12–28), resulting in a loss of STD signal that is albumin-concentration dependent and is exploited to measure the effective average affinity of albumin for the Aβ (12–28) assemblies. A previously published experimental setup was used from Milojevic and Melacini (13), and therefore will not be further discussed here. The titration curves were fitted using a Scatchard-like model as previously explained (13). Due to the transient nature of the oligomers formed by the longer Aβ (1–42) peptide, the STD experiments were not performed for this longer peptide; however, the intensities of one-dimensional Watergate experiments are effective in probing aggregation of Aβ (1–42) (13,22). These experiments rely on the incorporation of a 30-ms-long spin-lock pulse before acquisition to suppress contributions from residual protein and selectively observe the monomeric and low MW Aβ signals. All experiments were acquired on an Avance 700 MHz spectrometer (Bruker BioSpin) equipped with a 5-mm TCI CyroProbe (Bruker BioSpin). The STD experiments were performed at 20°C, whereas one-dimensional watergate water-suppression NMR technique experiments were performed at 37°C. All spectra were processed with the program NMRPIPE (24) and analyzed with the software SPARKY (25).
Thioflavin T fluorescence
Thioflavin T (ThT) fluorescence spectra were recorded using a Safire fluorescence spectrometer (Tecan/Life Technologies, Carlsbad, CA) and 96-well plates (half-area) with 155-μL sample volumes (22,26). The concentration of Aβ (1–42) in all samples was 70 μM, whereas the concentration of inhibitory and control peptides, i.e., HSA (494–515) and HSA (594–515) reversed, respectively, was set to 120 μM. Measurements were performed in 30 mM HEPES buffer with 20 μM of the ThT dye at pH 7.4. As a control, individual ThT fluorescence spectra were collected for HSA peptides samples. These values were subtracted from the values obtained from the HSA peptides:Aβ mixtures. For each sample, at least three measurements were performed and the average values are reported. The error was calculated as the standard deviation of all measurements.
Bioinformatics analysis
Secondary structure elements and local (three residues) root mean-square deviation changes were calculated through the MOLMOL software (27) using Protein Data Bank codes PDB:1AO6 and PDB:1E7G for apo and MA-bound HSA (18), respectively. The Waltz algorithm (http://waltz.switchlab.org/) was used to predict domain-3 regions prone to amyloid formation (28). For the Waltz profile, the output with high sensitivity and pH 7 was chosen. The Waltz score was plotted against the residue number to show the residue-specific propensity of amyloid formation.
Results
Myristic acid and Aβ oligomers compete for binding to domain 3 of HSA
To probe the competition between MA and Aβ binding, we measured the potency of HSA domain 3 in inhibiting Aβ (1–42) self-association in the presence and absence of MA. For this purpose, we monitored the loss of Ab (1–42) one-dimensional NMR signal intensity versus time due to the formation of high-MW NMR-undetectable aggregates (Fig. 2 a). In these experiments, the contributions to the NMR signal arising from HSA are effectively edited out through a spin-lock relaxation filter. This is a distinct advantage of NMR relative to other spectroscopies, such as ThT fluorescence, because the ThT fluorophore binds to HSA and therefore the addition of HSA may affect the detected fluorescence signal. In addition, the Aβ (1–42) one-dimensional NMR signal intensity versus time profiles appear more reproducible than those obtained using ThT fluorescence (13,22,29), thus facilitating the quantitative evaluation of self-association inhibitors through comparative analyses.
Figure 2.
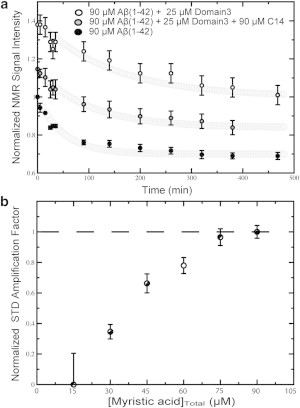
(a) Effect of myristic acid (MA) on the inhibition of Aβ (1–42) aggregation by HSA domain 3 (i.e., HSA 381–585). One-dimensional 1H-NMR signal intensities of 90 μM Aβ (1–42) recoded over time are shown in the absence (solid circles) and in the presence of domain 3 either in the apo form (open circles) or saturated with MA (shaded circles). The initial (t = 0) amplitude quantifies the NMR-detectable species present after the dead time of the experiment, i.e., the time interval elapsed between sample preparation and the beginning of the NMR data acquisition. The Aβ (1–42) concentration of 90 μM was chosen because, under our experimental conditions, it provides an optimal compromise between the signal/noise of each sampled spectrum and the time resolution of the decay. We recognize that this concentration is higher than those typically reported for in vivo Aβ (i.e., lower than nanomolar in human plasma (10)). However, our in vitro conditions allowed us to test the effect of albumin on a wide range of Aβ assemblies from monomers to fibrils, increasing the likelihood to mimic also the Aβ association states relevant in vivo. (b) STR and STD spectra for apo Domain 3 were subtracted from the respective spectra at each titration point.
Fig. 2 a shows that in the absence of HSA domain 3, the one-dimensional NMR signal of Aβ (1–42) is rapidly lost over time, until a plateau is reached with the original intensity reduced by ∼40%. Upon addition of substoichiometric amounts of apo HSA domain 3, the NMR signal intensity of Aβ (1–42) is dramatically increased both in the initial decay phase and in the final plateau region (Fig. 2 a), clearly indicating that the isolated domain-3 functions as an effective Aβ self-association inhibitor. However, when HSA domain 3 was added in the presence of excess MA, the inhibitory potency of domain 3 was significantly reduced, resulting in Aβ (1–42) signal intensities that are intermediate between those of the two previous profiles (Fig. 2 a). These variations in the one-dimensional NMR signal versus time profiles are attributable to either the competition between MA and Aβ (1–42) for binding to domain 3 and/or to potential interactions between free MA and Aβ (1–42). To rule out the latter explanation, we monitored the one-dimensional NMR signal of Aβ (1–42) over time in the absence and presence of 30 μM of MA and no significant differences were observed upon addition of 30 μM of MA (see Fig. S1 in the Supporting Material). This MA concentration exceeds the concentration of free MA expected under the conditions of Fig. 2 a (i.e., [HSA domain 3]Total = 25 μM and [MA]Total = 90 μM), because domain 3 is fully saturated by MA, as shown by saturation transfer difference NMR (Fig. 2 b) and the HSA domain 3:MA specific binding stoichiometry is 1:3. We therefore conclude that the data of Fig. 2 b point to competition between MA and Aβ (1–42) oligomers for binding to domain 3 of HSA.
The MA-versus-Aβ competition emerging from Fig. 2 a suggests that at least some of the domain-3 residues affected by MA binding are also critical for Aβ self-association inhibition. The residues affected by MA binding include those in direct contact with MA as well as those indirectly affected by MA through local conformational changes (see Fig. S2). Fig. S2 shows that the MA binding sites in domain 3 span both subdomains (i.e., 3A and 3B) and that the sites directly or indirectly affected by MA binding are scattered through domain 3. Considering the abundance and wide distribution of domain-3 sites affected by MA (see Fig. S2), we decided to further narrow down the location of sites critical for Aβ self-association inhibition by complementing the competition experiments of Fig. 2 with comparative mutational analyses.
The first set of mutants was designed to address the question as to whether Aβ binds both subdomains (i.e., 3A and 3B), similarly to MA, or it is selective for a single subdomain. For this purpose, we have subcloned, expressed, and purified separate 3A and 3B subdomain constructs and tested their interactions with two Aβ peptides, Aβ (12–28) and Aβ (1–42). The former peptide spans the central hydrophobic core of the Aβ peptide as well as key residues involved in HSA binding (13,21,22) and was included in the analyses, because unlike Ab (1–42), it forms stable soluble Aβ oligomers. Furthermore, the binding of Aβ (12–28) oligomers to albumin can be monitored by STD NMR experiments, resulting in albumin inhibition isotherms from which quantitative effective KD values for the Aβ oligomer:HSA complexes are obtained based on Scatchard-like models, as previously explained (13). In addition, the Aβ (12–28) STD-versus-[HSA] inhibition profiles exhibit a clear plateau whose starting point provides an estimation of the effective concentration of protein (i.e., HSA) necessary to saturate the Aβ (12–28) oligomers binding sites (13).
Subdomains 3A and 3B are minimal structural units that retain potency in inhibiting Aβ self-association
Fig. 3, a and b, shows the concentration-dependent STD-monitored Aβ (12–28) self-association inhibition profiles measured for subdomains 3A and 3B. The STD-monitored titration data (Fig. 3, a and b) display a typical dose-response pattern in which ISTD/ISTR decrease progressively as the subdomain concentration increases, until a saturation plateau is reached, indicating that both subdomains span specific Aβ oligomers binding sites. These interactions are compatible with at least two different stoichiometries for the domain 3:Aβn complexes. In the first stoichiometry, a single Aβ oligomer interacts with both subdomains. In this case, we expect that, in going from the integral domain 3 to the separate subdomains, the average effective number of Aβ oligomers bound per molecule of albumin construct, defined as nAβn, will remain largely unaffected, although the affinity may change. In the second putative stoichiometry, two distinct Aβ oligomers interact with the two subdomains. In this case, we expect that, in going from the integral domain 3 to the separate subdomains, nAβn should approximately halve.
Figure 3.
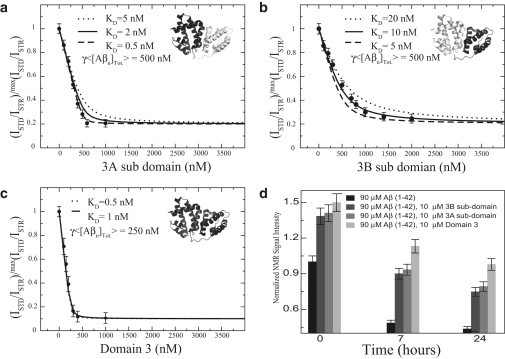
Inhibition of the Aβ self-association by domain 3 and its subdomain deletion mutants monitored by dose-response Aβ (12–28) STD-based profiles (a–c) and by Aβ (1–42) one-dimensional NMR versus time (d). (a–c) Effect of the subdomain deletion mutants (i.e., 3A and 3B) and the full-length domain 3, respectively, on the relative ISTD/ISTR ratios measured for a filtered 1-mM Aβ (12–28) peptide sample aggregated through addition of 40 mM of NaCl. (Dotted, dashed, and solid lines) Dose-response curves backcalculated using a Scatchard-like model. In each panel the structure of domain 3 is shown (PDB:1A06); (black) construct used in the titration. 〈[Aβn]Tot〉: The average effective total concentration of albumin-binding competent Aβ oligomers and γ = nprotein/nAβn, where nprotein is the average effective number of albumin protein construct molecules (i.e., domain 3 or subdomain 3A or 3B) bound per Aβ oligomer and nAβn is the average effective number of Aβ oligomers bound per molecule of albumin protein construct. (d) 0.1 mM Aβ (1–42) samples were incubated with 10 μM of domain-3 constructs and changes in the intensities of the methyl region of one-dimensional watergate spectra with time are reported. All intensities were normalized to the 0.1-mM Aβ (1–42) sample acquired for the first incubation time point.
To discriminate between the two possible domain 3:Aβn stoichiometries discussed above, we also measured as a reference the Aβ (12–28) self-association inhibition STD profile for the integral domain 3 (Fig. 3 c). All three STD profiles of Fig. 3, a–c, were fitted to a Scatchard-like model, which provides the γ〈[Aβn]Tot〉 product (13), where 〈[Aβn]Tot〉 is the average effective total concentration of albumin-binding competent Aβ oligomers. Here, γ = nprotein/nAβn, where nprotein is the average effective number of albumin protein construct molecules (i.e., domain 3 or subdomain 3A or 3B) bound per Aβ oligomer, and nAβn is defined as above, i.e., the average effective number of Aβ oligomers bound per molecule of albumin construct (13). Because the measurements in Fig. 3, a–c, were recorded utilizing the same Aβ stock solution, 〈[Aβn]Tot〉 does not change appreciably in the inhibition STD profiles of domain 3 and subdomains 3A and 3B (Fig. 3, a–c). Similarly, nprotein is not expected to vary in going from panels a–c of Fig. 3 and to be ∼1, as previously reported (13). As a result, variations in the fitted γ〈[Aβn]Tot〉 product across the three panels of Fig. 3, a–c, report primarily on changes in nAβn, allowing us to differentiate between the two proposed putative stoichiometries for binding of Aβ oligomers to domain 3 of albumin.
The comparison of the STD profile in Fig. 3 c with those in Fig. 3, a and b, clearly shows that in going from domain 3 to the either one of the two separate subdomains, γ〈[Aβn]Tot〉 is doubled (Fig. 3, a–c), as expected if the nAβn value of domain 3 is approximately twice the nAβn value for the isolated 3A or 3B subdomains. These observations support the second stoichiometric pattern, whereby each subdomain binds a different Aβ (12–28) oligomer. This conclusion is also consistent with the inhibitory potencies measured for the two subdomains using the longer Aβ (1–42) peptide (Fig. 3 d). Fig. 3 d consistently indicates that domain 3 exhibits higher inhibition potency than the individual subdomains, corroborating that both subdomains, 3A and 3B, are involved in Aβ oligomer binding. Given that each subdomain interacts with Aβn, the next open question we focused on pertains to the specific Aβn contact sites within each HSA subdomain.
Comparison of Aβ and fatty acid binding modes: effects of hydrogen-bonding perturbing mutations
Given the competition between fatty acids (FAs) and Aβ oligomers supported by Fig. 2, we hypothesized that Aβ and FAs might share common binding determinants. To test this hypothesis, we investigated the interaction between Aβ and domain-3 mutants that hamper FA binding by removing side chains involved in hydrogen bonds to the FA carboxylate. For instance, the R410A/Y411A and R485A/S489A double mutations (Fig. 4, b and d) drastically reduce fatty-acid binding to subdomain 3A (see Fig. S3, a and b), whereas K525A (Fig. 4 f) markedly decreases FA binding to subdomain 3B (see Fig. S3 c) (17). Therefore, we tested the interactions of these three sets of domain-3 mutants (i.e., R410A/Y411A, R485A/S489A, and K525A) with Aβ oligomers. Fig. 4, a, c, and e, reports the STD-monitored titration of Aβ (12–28) with the R410A/Y411A, R485A/S489A, and K525A domain-3 mutants. The STD profiles shown in Fig. 4, a, c, and e (black dots), indicate that all three domain-3 mutants are active inhibitors of Aβ (12–28) self-association. Furthermore, no significant differences were observed when the titration profile of each mutant was compared to the corresponding profile for the wild-type domain 3 (Fig. 4, a, c, and e, red dots). These results suggest that mutations that disrupt the interactions of domain 3 with FAs (see Fig. S3) do not necessarily affect Aβ (12–28) oligomer binding, pointing to marked differences between the HSA binding determinants for FAs and those for the Aβ (12–28) oligomers. To confirm the validity of this conclusion for longer and more physiologically relevant Aβ peptides, we also tested the interactions between the three domain-3 mutants and Aβ (1–42).
Figure 4.
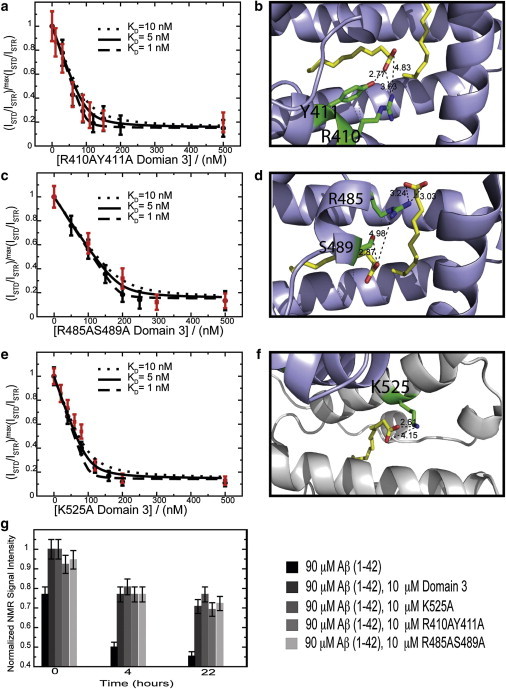
Inhibition of the Aβ self-association by fatty acid silencing domain-3 point mutants monitored by dose-response Aβ (12–28) STD-based profiles (a–f) and by Aβ (1–42) one-dimensional-NMR versus time (g). (a, c, and e) All ratios were normalized to their maximum value measured before protein addition. (Dashed, solid, and dotted lines correspond to dose-response curves backcalculated using a Scatchard-like model and KD values of 1, 5, and 10 nM, respectively.) (Red) In each panel, for reference purposes, the titration profile of wild-type domain 3, measured using the same Aβ (12–28) peptide batch as the mutated protein, is shown in red. (b, d, and f) Side chains of the mutated residues interacting with fatty acids. (Yellow) Bound fatty acids. (Dashed lines) Hydrogen bonds to the fatty acid; their lengths are reported in Ångstroms. For panel d, experiments were acquired at 700 MHz at 310 K in 20 mM potassium phosphate, pH 7.4, 10% D2O, 0.05% NaN3. A 50-ms-long spin lock was used to suppress residual protein signal. Color coding is as per the legend in the figure. To see this figure in color, go online.
The experiments on the Aβ (1–42) peptide (Fig. 4 g) confirmed the differences between the Aβ and FA binding modes already emerged from the STD experiments on Aβ (12–28) (Fig. 4, a, c, and e). Specifically, Fig. 4 g indicates that the incubation of Aβ (1–42) at 37°C results in peptide aggregation and consequent losses in the Aβ NMR signal over time. These signal losses are significantly reduced in the presence of wild-type domain 3 (Fig. 4 g). A similar reduction in aggregation is observed for all domain-3 mutants, suggesting that the mutations did not significantly perturb binding of the Aβ oligomers to domain 3 (Fig. 4 g), although they had a marked effect on FA binding (see Fig. S3) (17). We conclude that the mutated residues (i.e., R410, Y411, S489, R485, and K525), although involved in hydrogen bonds with albumin-bound FAs, are not part of the HSA domain-3 determinants for Aβ binding. To further dissect the domain-3 residues involved in Aβ binding, we focused on subdomain 3B, because it provides a minimal structural unit that still inhibits Aβ self-association (Fig. 3, a and d) and it includes only a single well-defined FA binding site.
Dissecting the subdomain-3B determinants for Aβ binding
As a first step toward narrowing down the Aβ binding sites within subdomain 3B, we verified that this construct retains FA binding capacity and that FA binding competes with Aβ binding. Fig. S4 a shows the STD amplification factor for a titration of MA into subdomain 3B. A clear dose-response pattern with plateau is observed, confirming that MA binds specifically to our 3B construct. Furthermore, Fig. S4 b, similarly to Fig. 2 a, clearly shows that MA binding decreases the Aβ self-association inhibitory potency of the 3B construct, indicating that the MA-versus-Aβ oligomer competition occurs also at the level of subdomain 3B. This observation suggests that the 3B residues interacting with the Aβ oligomers are either in direct contact with the FA (see Fig. S2, open circles) and/or are indirectly affected by FA binding through conformational changes (see Fig. S2, local root mean-square deviation).
To further screen for the 3B sites that recognize Aβ oligomers, we hypothesized that, because Aβ monomers and HSA compete for the same binding partner (i.e., Aβ oligomers), the recognition of Aβ oligomers by HSA should to some extent resemble the recognition of Aβ oligomers by Aβ monomers. Based on this hypothesis, HSA residues with high propensity to bind to Aβ oligomers and proto-fibrils should meet two additional criteria:
-
1).
They should fall in regions of HSA prone to adopt a β-strand conformation and to self-associate into amyloid fibrils. For instance, the Waltz algorithm (28) predicts that three distinct segments of subdomain 3B are likely to be involved in HSA self-association (Fig. 5 b), with the longest region spanning residues 494–515.
-
2).
Sites that recognize Aβ assemblies are likely to align in sequence with the Aβ residues involved in self-recognition. For instance, the central hydrophobic core of Aβ (i.e., L17VFFA21) is known to be critical for Aβ self-association and aligns well with several residues in the 494–515 segment of HSA (Fig. 5 c). Interestingly, the 494–515 region also includes several loci of FA-dependent conformational change (see Fig. S2). Overall, the 494–515 HSA segment emerges as a consensus sequence for Aβ oligomer binding, which is consistent with the MA competition data (see Fig. S4) and meets the two bioinformatic criteria of amyloid propensity and Aβ alignment (Fig. 5, b and c).
Based on these observations, we hypothesized that the HSA (494–515) peptide retains Aβ self-association inhibitory potency. To test this hypothesis, we measured the inhibitory potencies of the HSA (494–515) synthetic peptide using both the Aβ (12–28) and Aβ (1–42) systems. We also included in our measurements two negative controls, i.e., the reversed HSA (494–515) peptide, to check the specificity of the HSA peptide/Aβ interactions, and the HSA (530–550) peptide, which spans a region of subdomain 3B that does not meet our two bioinformatic criteria (Fig. 5, b and c).
Figure 5.
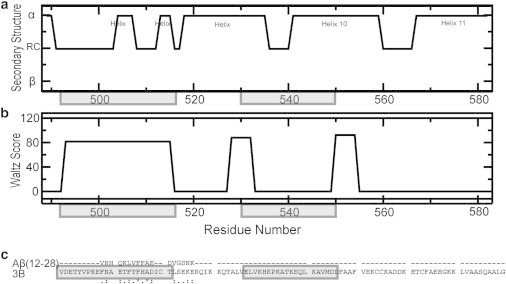
(a) Subdomain-3B secondary structure (PDB:1E7G). (b) WALTZ scores, which predict amyloid propensity (28). (c) CLUSTALW (http://www.genome.jp/tools/clustalw/) sequence alignment of subdomain 3B and Aβ (12–28). (Dashed line) Residues of no consensus; (stars) single, fully conserved residues; (semicolons) strong conserved residues; (dots) weak conserved residues. (Shaded) Domain-3 regions corresponding to the HSA peptides (494–515) and (530–550) used in Fig. 6.
Fig. 6 a shows the effect of the HSA (494–515) peptide on the Aβ (12–28) self-association as monitored by STD. The STD-versus-[HSA (494–515)] profile conforms to a clear dose-response pattern with a well-defined plateau (Fig. 6 a), pointing to specific interactions between this HSA peptide and Aβ (12–28). The specificity of these interactions is further confirmed by the dramatically reduced affinity for Aβ (12–28) observed for the reversed HSA (494–515) peptide (Fig. 6 a), which results in an effective Kd approximately one order-of-magnitude higher than that measured for the wild-type HSA (494–515) counterpart (Fig. 6 a). In addition, as expected, no Aβ (12–28) self-association inhibition was observed for the other negative control peptide, i.e., HSA (530–550) (Fig. 6 a), confirming the usefulness of the bioinformatic selection criteria.
Figure 6.
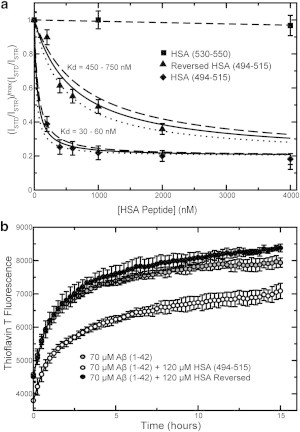
(a) Dose-response STD-based profiles for the inhibition of the Aβ (12–28) self-association by three HSA domain-3-derived peptides, i.e., HSA (494–515) (solid diamonds), HSA (494–515) with reversed sequence (solid triangles), and HSA (530–550) (solid squares). The latter two peptides serve as negative controls. (b) Inhibition of Aβ (1–42) aggregation by HSA (494–515) (open circles) and HSA (494–515) with reversed sequence (solid circles), as monitored by ThT fluorescence. (Shaded circles) Aggregation profile for Aβ (1–42) alone.
The results obtained for Aβ (12–28) (Fig. 6 a) were confirmed when the HSA peptides were tested on Aβ (1–42) (Fig. 6 b). The self-association of Aβ (1–42) was not monitored by NMR intensity losses because of the overlap between the NMR signals of the Aβ (1–42) and the HSA (494–515) peptides. The sharp and intense NMR lines of the flexible HSA (494–515) peptide are not easily edited out through a spin-lock relaxation filter without significant intensity losses for the Aβ (1–42) peptide as well, unlike the case of larger and well-structured HSA constructs. However, unlike full-length HSA, the HSA (494–515) peptide under our experimental conditions does not affect the fluorescence of ThT in the absence of Aβ (1–42) (see Fig. S5). We therefore resorted to ThT fluorescence to monitor the formation of cross-β amyloid assemblies (Fig. 6 b). Fig. 6 b shows that the HSA (494–515) peptide significantly reduces the ThT fluorescence arising from the Aβ (1–42) cross-β amyloids formed during a 15-h incubation period. This inhibitory effect is completely lost when the HSA (494–515) sequence is reversed (Fig. 6 b). Overall, the data for Aβ (12–28) and Aβ (1–42) (Fig. 6, a and b) consistently point to the HSA (494–515) region as a site of specific HSA/Aβ contacts, confirming our hypothesis based on the FA competition experiments and bioinformatic analyses (Fig. 5).
Discussion
The consensus model emerging from the data presented here provides unprecedented insight about the HSA:Aβ oligomer interactions well beyond the previously available domain resolution. We show that each separate subdomain of HSA domain 3 retains Aβ self-association inhibitory potency and is able to bind Aβ oligomers with a sub-μM affinity (Fig. 3). The FA binding sites are also located in both subdomains 3A and 3B (Fig. 1), and FAs compete with Aβ oligomers for binding to domain 3 (Fig. 2 and see Fig. S4). However, the determinant of the HSA/Aβ oligomers interactions is markedly distinct from those of FAs (Fig. 4). For FAs, although extensive hydrophobic contacts are common, it is the strength of hydrogen bonds/salt bridges formed between the albumin amino-acid side chains and the fatty acid carboxylate groups that determine the binding affinities (see Fig. S3) (15,16). For Aβ, the relevance of these specific polar/ionic interactions becomes marginal (Fig. 4), but hydrophobic contacts appear to play a pivotal role for Aβ oligomer recognition (Figs. 5 and 6). For instance, in the case of subdomain 3B, a site of Aβ oligomer recognition spans the HSA (494–515) region, which includes hydrophobic sites in contact with the aliphatic tail of MA and subject to changes in conformation upon FA binding (see Fig. S2). The (494–515) HSA region thus explains the competition between FA and Aβ oligomer for binding to HSA subdomain 3B, although at this stage we cannot rule out that other HSA sites may also contribute to the observed FA-versus-Aβn competition. Interestingly, the (494–515) segment also includes several residues that align to the central hydrophobic core sequence of Aβ (i.e.,L17VFFA21, Fig. 5 c).
The importance of the hydrophobic effect in the binding of Aβ oligomers is supported by the observation that several other Aβ binding proteins, such as sLRP (30), clusterin (31,32), and ApoE (33), are also involved in lipid binding. Additionally, it was recently shown that binding of Aβ to proteins not involved in lipid metabolism, such as ABAD and affibody ZAβ3, is accompanied by a favorable entropic change, consistent with hydrophobically driven protein:Aβ interactions (34–36). Furthermore, the solution structure of the complex between Aβ and the affibody ZAβ3 dimer revealed a large hydrophobic cavity, which is required for high Aβ affinity (36).
The observations that the HSA (494–515) peptide inhibits Aβ self-association (Fig. 6) and is also prone to self-association into cross-β fibrils (Fig. 5 b) suggest the hypothesis that protein segments prone to β-strand formation and self-association into amyloid deposits may also serve as sites that target Aβ oligomers at their growing loci, where Aβ monomers would otherwise bind. This notion is supported by the structure of the affibody ZAβ3 bound to Aβ, revealing that the Aβ peptide interacts with a β-strand of ZAb3 (36). Overall, the criteria of hydrophobicity, β-strand propensity, and involvement in protein:protein self-association emerging from our investigation of albumin:Aβn interactions will facilitate the initial screening for peptide regions that may serve as potential inhibitors of Aβ fibrilization. In addition, we anticipate that the methods and experimental approaches utilized here to map the albumin:Aβn interactions will be at least in part transferable to other amyloid inhibitory systems (30–39).
Acknowledgments
This work was made possible through the financial support of the National Science and Engineering Research Council of Canada.
Supporting Material
References
- 1.Mawuenyega K.G., Sigurdson W., Bateman R.J. Decreased clearance of CNS β-amyloid in Alzheimer’s disease. Science. 2010;330:1774. doi: 10.1126/science.1197623. [DOI] [PMC free article] [PubMed] [Google Scholar]
- 2.Miller Y., Ma B., Nussinov R. Polymorphism in Alzheimer Aβ amyloid organization reflects conformational selection in a rugged energy landscape. Chem. Rev. 2010;110:4820–4838. doi: 10.1021/cr900377t. [DOI] [PMC free article] [PubMed] [Google Scholar]
- 3.Zheng J., Ma B., Nussinov R. Molecular dynamics simulations of Alzheimer Aβ40 elongation and lateral association. Frontiers Biosci. 2008;13:3919–3930. doi: 10.2741/2980. [DOI] [PMC free article] [PubMed] [Google Scholar]
- 4.Brubaker W.D., Freites J.A., Martin R.W. Separating instability from aggregation propensity in γS-crystallin variants. Biophys. J. 2011;100:498–506. doi: 10.1016/j.bpj.2010.12.3691. [DOI] [PMC free article] [PubMed] [Google Scholar]
- 5.DeToma A.S., Salamekh S., Lim M.H. Misfolded proteins in Alzheimer’s disease and type II diabetes. Chem. Soc. Rev. 2012;41:608–621. doi: 10.1039/c1cs15112f. [DOI] [PMC free article] [PubMed] [Google Scholar]
- 6.Choi J.-S., Braymer J.J., Lim M.H. Design of small molecules that target metal-Aβ species and regulate metal-induced Aβ aggregation and neurotoxicity. Proc. Natl. Acad. Sci. USA. 2010;107:21990–21995. doi: 10.1073/pnas.1006091107. [DOI] [PMC free article] [PubMed] [Google Scholar]
- 7.Hindo S.S., Mancino A.M., Lim M.H. Small molecule modulators of copper-induced Aβ aggregation. J. Am. Chem. Soc. 2009;131:16663–16665. doi: 10.1021/ja907045h. [DOI] [PMC free article] [PubMed] [Google Scholar]
- 8.Zlokovic B.V. Clearing amyloid through the blood-brain barrier. J. Neurochem. 2004;89:807–811. doi: 10.1111/j.1471-4159.2004.02385.x. [DOI] [PubMed] [Google Scholar]
- 9.DeMattos R.B., Bales K.R., Holtzman D.M. Peripheral anti-A β antibody alters CNS and plasma A β clearance and decreases brain A β burden in a mouse model of Alzheimer’s disease. Proc. Natl. Acad. Sci. USA. 2001;98:8850–8855. doi: 10.1073/pnas.151261398. [DOI] [PMC free article] [PubMed] [Google Scholar]
- 10.Biere A.L., Ostaszewski B., Selkoe D.J. Amyloid β-peptide is transported on lipoproteins and albumin in human plasma. J. Biol. Chem. 1996;271:32916–32922. doi: 10.1074/jbc.271.51.32916. [DOI] [PubMed] [Google Scholar]
- 11.Llewellyn D.J., Langa K.M., Lang I.A. Serum albumin concentration and cognitive impairment. Curr. Alzheimer Res. 2010;7:91–96. doi: 10.2174/156720510790274392. [DOI] [PMC free article] [PubMed] [Google Scholar]
- 12.Boada M., Ortiz P., Páez A. Amyloid-targeted therapeutics in Alzheimer’s disease: use of human albumin in plasma exchange as a novel approach for Aβ mobilization. Drug News Perspect. 2009;22:325–339. doi: 10.1358/dnp.2009.22.6.1395256. [DOI] [PubMed] [Google Scholar]
- 13.Milojevic J., Melacini G. Stoichiometry and affinity of the human serum albumin-Alzheimer’s Aβ peptide interactions. Biophys. J. 2011;100:183–192. doi: 10.1016/j.bpj.2010.11.037. [DOI] [PMC free article] [PubMed] [Google Scholar]
- 14.Mao H., Gunasekera A.H., Fesik S.W. Expression, refolding, and isotopic labeling of human serum albumin domains for NMR spectroscopy. Protein Expr. Purif. 2000;20:492–499. doi: 10.1006/prep.2000.1330. [DOI] [PubMed] [Google Scholar]
- 15.Petitpas I., Grüne T., Curry S. Crystal structures of human serum albumin complexed with monounsaturated and polyunsaturated fatty acids. J. Mol. Biol. 2001;314:955–960. doi: 10.1006/jmbi.2000.5208. [DOI] [PubMed] [Google Scholar]
- 16.Curry S., Mandelkow H., Franks N. Crystal structure of human serum albumin complexed with fatty acid reveals an asymmetric distribution of binding sites. Nat. Struct. Biol. 1998;5:827–835. doi: 10.1038/1869. [DOI] [PubMed] [Google Scholar]
- 17.Simard J.R., Zunszain P.A., Hamilton J.A. Locating high-affinity fatty acid-binding sites on albumin by x-ray crystallography and NMR spectroscopy. Proc. Natl. Acad. Sci. USA. 2005;102:17958–17963. doi: 10.1073/pnas.0506440102. [DOI] [PMC free article] [PubMed] [Google Scholar]
- 18.Bhattacharya A.A., Grüne T., Curry S. Crystallographic analysis reveals common modes of binding of medium and long-chain fatty acids to human serum albumin. J. Mol. Biol. 2000;303:721–732. doi: 10.1006/jmbi.2000.4158. [DOI] [PubMed] [Google Scholar]
- 19.Sugio S., Kashima A., Kobayashi K. Crystal structure of human serum albumin at 2.5 Å resolution. Protein Eng. 1999;12:439–446. doi: 10.1093/protein/12.6.439. [DOI] [PubMed] [Google Scholar]
- 20.Jarvet J., Damberg P., Gräslund A. Reversible random coil to β-sheet transition and the early stage of aggregation of the Aβ(12–28) fragment from the Alzheimer peptide. J. Am. Chem. Soc. 2000;122:4261–4268. [Google Scholar]
- 21.Milojevic J., Esposito V., Melacini G. Understanding the molecular basis for the inhibition of the Alzheimer’s Aβ-peptide oligomerization by human serum albumin using saturation transfer difference and off-resonance relaxation NMR spectroscopy. J. Am. Chem. Soc. 2007;129:4282–4290. doi: 10.1021/ja067367+. [DOI] [PubMed] [Google Scholar]
- 22.Milojevic J., Raditsis A., Melacini G. Human serum albumin inhibits Aβ fibrilization through a “monomer-competitor” mechanism. Biophys. J. 2009;97:2585–2594. doi: 10.1016/j.bpj.2009.08.028. [DOI] [PMC free article] [PubMed] [Google Scholar]
- 23.Andrushchenko V.V., Vogel H.J., Prenner E.J. Optimization of the hydrochloric acid concentration used for trifluoroacetate removal from synthetic peptides. J. Pept. Sci. 2007;13:37–43. doi: 10.1002/psc.793. [DOI] [PubMed] [Google Scholar]
- 24.Delaglio F., Grzesiek S., Bax A. NMRPIPE: a multidimensional spectral processing system based on UNIX pipes. J. Biomol. NMR. 1995;6:277–293. doi: 10.1007/BF00197809. [DOI] [PubMed] [Google Scholar]
- 25.Kneller D.G., Kuntz I.D. UCSF SPARKY: an NMR display, annotation and assignment tool. J. Cell. Biochem. 1993;53:254. [Google Scholar]
- 26.Benseny-Cases N., Cócera M., Cladera J. Conversion of non-fibrillar β-sheet oligomers into amyloid fibrils in Alzheimer’s disease amyloid peptide aggregation. Biochem. Biophys. Res. Commun. 2007;361:916–921. doi: 10.1016/j.bbrc.2007.07.082. [DOI] [PubMed] [Google Scholar]
- 27.Koradi R., Billeter M., Wüthrich K. MOLMOL: a program for display and analysis of macromolecular structures. J. Mol. Graphics. 1996;14:29–32. doi: 10.1016/0263-7855(96)00009-4. 51–55. [DOI] [PubMed] [Google Scholar]
- 28.Maurer-Stroh S., Debulpaep M., Rousseau F. Exploring the sequence determinants of amyloid structure using position-specific scoring matrices. Nat. Methods. 2010;7:237–242. doi: 10.1038/nmeth.1432. [DOI] [PubMed] [Google Scholar]
- 29.Stanyon H.F., Viles J.H. Human serum albumin can regulate amyloid-β peptide fiber growth in the brain interstitium: implications for Alzheimer disease. J. Biol. Chem. 2012;287:28163–28168. doi: 10.1074/jbc.C112.360800. [DOI] [PMC free article] [PubMed] [Google Scholar]
- 30.Sagare A., Deane R., Zlokovic B.V. Clearance of amyloid-β by circulating lipoprotein receptors. Nat. Med. 2007;13:1029–1031. doi: 10.1038/nm1635. [DOI] [PMC free article] [PubMed] [Google Scholar]
- 31.Matsubara E., Frangione B., Ghiso J. Characterization of apolipoprotein J-Alzheimer’s Aβ interaction. J. Biol. Chem. 1995;270:7563–7567. doi: 10.1074/jbc.270.13.7563. [DOI] [PubMed] [Google Scholar]
- 32.Calero M., Rostagno A., Ghiso J. Apolipoprotein J (clusterin) and Alzheimer’s disease. Microsc. Res. Tech. 2000;50:305–315. doi: 10.1002/1097-0029(20000815)50:4<305::AID-JEMT10>3.0.CO;2-L. [DOI] [PubMed] [Google Scholar]
- 33.Petrlova J., Hong H.-S., Voss J.C. A differential association of Apolipoprotein E isoforms with the amyloid-β oligomer in solution. Proteins. 2011;79:402–416. doi: 10.1002/prot.22891. [DOI] [PMC free article] [PubMed] [Google Scholar]
- 34.Lustbader J.W., Cirilli M., Wu H. ABAD directly links Aβ to mitochondrial toxicity in Alzheimer’s disease. Science. 2004;304:448–452. doi: 10.1126/science.1091230. [DOI] [PubMed] [Google Scholar]
- 35.Hoyer W., Härd T. Interaction of Alzheimer’s A β peptide with an engineered binding protein—thermodynamics and kinetics of coupled folding-binding. J. Mol. Biol. 2008;378:398–411. doi: 10.1016/j.jmb.2008.02.040. [DOI] [PubMed] [Google Scholar]
- 36.Hoyer W., Grönwall C., Härd T. Stabilization of a β-hairpin in monomeric Alzheimer’s amyloid-β peptide inhibits amyloid formation. Proc. Natl. Acad. Sci. USA. 2008;105:5099–5104. doi: 10.1073/pnas.0711731105. [DOI] [PMC free article] [PubMed] [Google Scholar]
- 37.Raditsis A.V., Milojevic J., Melacini G. Aβ association inhibition by transferrin. Biophys. J. 2013;105:473–480. doi: 10.1016/j.bpj.2013.03.065. [DOI] [PMC free article] [PubMed] [Google Scholar]
- 38.Ramamoorthy A., Lim M.H. Structural characterization and inhibition of toxic amyloid-β oligomeric intermediates. Biophys. J. 2013;105:287–288. doi: 10.1016/j.bpj.2013.05.004. [DOI] [PMC free article] [PubMed] [Google Scholar]
- 39.Moreland J.L., Gramada A., Bourne P.E. The Molecular Biology Toolkit (MBT): a modular platform for developing molecular visualization applications. BMC Bioinformatics. 2005;6:21. doi: 10.1186/1471-2105-6-21. [DOI] [PMC free article] [PubMed] [Google Scholar]
Associated Data
This section collects any data citations, data availability statements, or supplementary materials included in this article.