

Abstract
Adolescence is characterized by significant neuromaturation, including extensive cortical thinning, particularly in frontal regions. The goal of this study was to examine the behavioral correlates of neurostructural development in early adolescence. Participants were 185 healthy 12- to 14-year-olds (44% female) recruited from local schools. Participants completed a comprehensive neuropsychological test battery and magnetic resonance imaging session. Cortical surface reconstruction and thickness estimates were performed via FreeSurfer. Age and cortical thickness were negatively correlated in 10 brain regions, 7 of which were in frontal areas (β = −.15 to −.25, ps ≤.05). Hierarchical linear regressions examined the influence of cortical thickness on working memory, attention, verbal learning and memory, visuospatial functioning, spatial planning and problem solving, and inhibition, controlling for age and intracranial volume. Thinner parietal cortices predicted better performances on tests of verbal learning and memory, visuospatial functioning, and spatial planning and problem solving (β = −.14 to −.24, ps ≤.05). Age, spanning from 12 to 14 years, accounted for up to 6% of cortical thickness, suggesting substantial thinning during early adolescence, with males showing more accelerated thinning than females between ages 12 and 14. For both males and females, thinner parietal association cortices corresponded with better neurocognitive functioning above and beyond age alone.
Keywords: Adolescence, Cortical thickness, FreeSurfer, Neurocognitive testing, Neuropsychology, Normal development
INTRODUCTION
The field of adolescent neuroimaging has greatly enhanced our understanding of how macrostructural and microstructural changes evolve in both gray matter and white matter tissue during this unique time of development. Large longitudinal investigations, many spanning childhood to adulthood, have found cortical gray matter tissue to undergo a subtraction process (Giedd et al., 1999; Giedd, Raznahan, Mills, & Lenroot, 2012; Jernigan, Trauner, Hesselink, & Tallal, 1991; Lenroot et al., 2007; Shaw et al., 2008; Sowell, Trauner, Gamst, & Jernigan, 2002), which may be accounted for by underused synaptic connections becoming eliminated (e.g., synaptic pruning) and white matter encroachment on gray matter due to increasing axonal myelination (Paus, 2005) resulting in decreased gray matter volume (Huttenlocher, 1990). White matter tissue volume, however, continues to increase more linearly well into late adolescence and early adulthood (Lebel & Beaulieu, 2011; Tamnes, Ostby, et al., 2010). The temporal pattern of continued white matter and gray matter tissue change appears to occur sooner for sensorimotor cortex than for association areas that are typically used for higher-order processing (e.g., prefrontal cortex). Furthermore, some cortical and subcortical gray matter structures decrease in volume, while others, such as the hippocampus, tend to show slight increases with age (Østby et al., 2009).
Regional brain maturation has been shown to differ between boys and girls. For example, girls have been shown to peak in cerebral gray matter volume approximately 1–2 years earlier than boys (Giedd et al., 2006; Lenroot et al., 2007). The mechanism behind this is unclear; however, it is suspected that the sexual dimorphic effects may be related to hormone levels at different stages of pubertal maturation (Bramen et al., 2012; Giedd et al., 2012; Panizzon et al., 2009).
Recent computational approaches allow for separating cortical thickness from surface area (Brown & Jernigan, 2012; Fischl & Dale, 2000; Winkler et al., 2010, 2012). The literature has suggested that cortical volume is driven more by surface area, whereas the number of cells that exist within organized perpendicular columns within the cortex (e.g., thickness) may be more sensitive (vs. volume), and reflective of age-related structural maturation such as cortical thinning and myelination (Brown & Jernigan, 2012; Østby et al., 2009).
Changes in cortical thickness are believed to be associated with neurocognitive performance, and several studies have found correlations between widespread cortical maturation and general intellectual functioning (Karama et al., 2009; Sowell et al., 2004). The rate of cortical thinning may be linked to intellectual functioning in teens (Shaw et al., 2006). In one of the earlier brain mapping studies to focus on cortical thinning, Gogtay and colleagues (2004) showed a multiphased progression of cortical thinning that first involved maturation of areas important for sensory functioning (ages 4–8), followed by parietal (ages 11–13) and frontal lobe (late adolescence) maturation in older stages of pubertal development, as more complex abilities such as language, attention, and executive functioning emerge. Such longitudinal data provided supporting evidence for regional brain development linked to neurocognitive trajectories that are typically observed throughout development. Few studies have examined how localized cortical thickness is related to particular neurocognitive abilities in adolescence during corresponding stages of development, although some work has been done in adult populations (Luders, Narr, Thompson, & Toga, 2009). Reduced volume and cortical thinning during adolescence have also been associated with better performance on individual cognitive tasks, including perceptual reasoning (Schilling et al., 2013), visual (Østby, Tamnes, Fjell, & Walhovd, 2012) and verbal memory (Sowell, Delis, Stiles, & Jernigan, 2001), verbal fluency (Porter, Collins, Muetzel, Lim, & Luciana, 2011), and executive functioning (Tamnes, Østby, et al., 2010).
Limited investigations have examined localized cortical thickness and associations with a comprehensive neuropsychological battery in adolescents, and many have focused on subtests of intelligence tests exclusively. In this study, we proposed to look at cortical thickness indices and associations with neurocognitive functioning spanning several domains, including memory, spatial processing, and executive functioning. We hypothesized that cortical regions would show thinning with increased age, particularly frontal regions, during this period of early adolescence, and we expected that this relationship would be different for males and females. Finally, and most importantly, we hypothesized that thinner cortices within this age range would be associated with better neurocognitive performance. Because frontal, parietal, and temporal regions are undergoing the most significant cortical thinning during this period (Gogtay et al., 2004), we expect the relationship between cortical thinning and cognitive performance will be strongest in these regions, as opposed to more posterior regions like the occipital lobe. Specifically, we hypothesized that thinner frontal regions would be associated with better working memory, sustained attention, spatial planning and problem solving, and inhibition; thinner parietal regions would be related to better visuospatial functioning and spatial planning and problem solving; and thinner temporal regions would relate to better verbal learning and memory.
MATERIALS AND METHODS
Participants
Participants were 185 healthy 12- to 14-year-olds (44% female) recruited through flyers sent to households of students attending San Diego area public middle schools. Extensive screening and background information were obtained from the youth, their biological parent, and one other parent or close relative. The study protocol was executed in accordance with the standards approved by the University of California, San Diego Human Research Protections Program.
Strict exclusionary criteria were: any neurological or DSM-IV (American Psychological Association, 1994) Axis I disorder, determined by the NIMH Diagnostic Interview Schedule for Children–version 4.0 (Shaffer, Fisher, Lucas, Dulcan, & Schwab-Stone, 2000); head trauma or loss of consciousness (>2 min); history of chronic medical illness; learning disability or mental retardation; use of medications potentially affecting the brain; premature birth (i.e., born before 35th gestational week); any suggestion of prenatal alcohol (>2 drinks during a given week) or illicit drug exposure; experience with alcohol or drugs, defined as ≥10 total days in their life on which drinking had occurred, or >2 drinks in a week; ≥1 lifetime experiences with marijuana and any use in the past 3 months; ≥5 lifetime cigarette uses; and any history of other intoxicant use (Squeglia et al., 2012; Squeglia, Spadoni, Infante, Myers, & Tapert, 2009); contraindication to magnetic resonance imaging (MRI) (e.g., braces); inadequate comprehension of English; and non-correctable sensory problems. In the final sample, there were forty-one 12-year-olds (51% female), ninety-six 13-year-olds (44% female), and forty-eight 14-year-olds (38% female).
Measures
Neuropsychological measures
A comprehensive neuropsychological battery was completed within 1 week of scanning to assess cognitive functioning on six cognitive domains: working memory, sustained attention, verbal learning and memory, visuospatial functioning, spatial planning and problem solving, and inhibition. Domains were determined by a factor analysis of the Z-scores of the 24 total neuropsychological test variables ascertained. Working memory was comprised of: Wechsler Intelligence Scale for Children-3rd edition (WISC-III; Wechsler, 1991) Digit Span digit forward and digit backward raw scores, and Wechsler Adult Intelligence Scale-4th edition (WAIS-IV; Wechsler, 2008) Letter-Number sequencing raw scores. Sustained attention consisted of: Digit Vigilance Test (Lewis, 1995) total time (seconds), WISC-III Coding raw score, and Delis-Kaplan Executive Function System (D-KEFS; Delis, Kaplan, & Kramer, 2001) Trails Conditions 1, 2, 3, and 4 (i.e., Visual Scanning, Number Sequencing, Letter Sequencing, Letter-Number Switching) time to complete (seconds). Verbal learning and memory consisted of California Verbal Learning Test-Children’s version (CVLT-C; List A Total 1–5 raw, Short Delay Free and Cued Recall raw, and Long Delay Free and Cued Recall raw scores. Visuospatial functioning was comprised of Rey-Osterrieth Complex Figure Copy and 30-min Delay Accuracy scores (Rey & Osterrieth, 1993), Wechsler Abbreviated Scale of Intelligence (WASI; Wechsler, 1999) Block Design raw scores, and Hooper Visual Organization Test (Hooper, 1958) raw total. Spatial planning and problem solving included the WISC-III Mazes total score, WASI Matrix Reasoning total score, and D-KEFS Towers total achievement score. Inhibition was comprised of D-KEFS Color-Word Interference Conditions 3 and 4 time to complete (seconds). All timed raw scores (i.e., Digit Vigilance, Trails, Color-Word Interference) were reversed-coded so that longer times corresponded to poorer performance. An overall Global Functioning score was calculated by averaging all of subtest Z-scores together.
Procedures
Imaging
High-resolution anatomical images were collected at the UC San Diego Center for functional MRI; images were acquired on a 3-Tesla CXK4 short bore Excite-2 MR system (General Electric, Milwaukee, WI) with an eight-channel phase-array head coil. Participants were placed comfortably on the scanner table and the head was stabilized within the head coil using foam cushions (NoMoCo Pillow, La Jolla, CA). Scan sessions involved a 10-s scout scan to assure good head placement and slice selection covering the whole brain, followed by a sagittally acquired high-resolution T1-weighted anatomical MRI (7:19 min, FOV 24 cm, 256 × 256 × 192 matrix, 0.94 × 0.94 × 1 mm voxels, 176 slices, repetition time = 20 ms, echo time = 4.8 ms; flip angle 12°).
Data analysis
Cortical thickness measurement
Cortical surface reconstruction and cortical thickness estimation were performed using FreeSurfer (version 5.0, surfer.nmr.mgh.harvard.edu). The FreeSurfer program uses a series of automated imaging algorithms to produce measures of cortical thickness. The process first involves intensity normalization, Talairach transformation, skull stripping, and labeling of the subcortical white matter. The white matter border is then tessellated by placing two triangles at each face (square) that separates white matter voxels from other voxels (i.e., gray matter). This initial coarse tessellation is then smoothed via surface deformation algorithm that is guided by local MRI intensity gradients to optimally place smooth gray/white and, by deforming outward, gray/cerebrospinal fluid borders at the location where the greatest shift in intensity defines the transition to the other tissue class (Dale, Fischl, & Sereno, 1999; Fischl & Dale, 2000; Fischl, Sereno, & Dale, 1999; Fischl et al., 2004). The smoothing produced from the spatial intensity gradients across tissue classes frees the surfaces from being reliant on the absolute signal intensity. Thus, this surface rendering process yields data that are not constrained to the voxel resolution of the original images, allowing for the quantification of submillimeter group differences (Fischl & Dale, 2000). Cortical thickness was calculated as the closest distance from the gray/white matter boundary to the gray matter/cerebral spinal fluid boundary at each vertex on the cortical surface (Fischl & Dale, 2000). The validity of the cortical thickness measurement procedures has been verified using manual measurements (Kuperberg et al., 2003; Salat et al., 2004) and histological analysis (Rosas et al., 2002).
One rater (L.M.S.), blind to participant characteristics, followed the reconstruction procedures (http://surfer.nmr.mgh.harvard.edu/fswiki/RecommendedReconstruction) to identify and correct any errors made during the cortical reconstruction. This involved verification of the Talairach transformation and of the automated skull stripping, as well as a coronal plane slice-by-slice inspection of the gray/white and gray/cerebrospinal fluid surfaces. Modifications to the surfaces were made as necessary to correct for tissue misclassifications (e.g., residual dura matter classified as cortex). Following inspection, an automated parcellation procedure divided each hemisphere into 32 independent cortical regions based on gyral and sulcal features (Desikan et al., 2006; Fischl et al., 2004). To reduce the number of statistical tests run, these regions were combined by lobe (i.e., frontal, parietal, temporal, and occipital) for each hemisphere. Cortical thickness estimates of each lobe were extracted for subsequent statistical analysis.
Statistical analyses
Cortical thickness values, averaged across each lobe, were imported from FreeSurfer to SPSS (Rel. 18.0.0. 2009. IBM, Chicago, IL) for each participant. To examine the effect of age on cortical thickness, hierarchical linear regressions were run, with age as a continuous independent variable (IV) predicting cortical thickness (dependent variable; DV), controlling for intracranial volume (ICV). To see if gender moderated the relationship with cortical thickness (DV), hierarchical linear regressions were run on all regions specifying age (IV), gender (IV), and the corresponding age by gender interaction term.
To examine the influence of cortical thickness on neuropsychological functioning for each cognitive domain and global summary score, hierarchical linear regressions were examined for cortical thickness (IV) in each brain lobe, controlling for age and ICV. Type I error was set at p <.05 per lobe. For lobes with significant findings, follow-up analyses were performed to determine the exact brain regions influencing the finding. The pattern of regressions was also tested for statistical significance using Fisher’s exact test to examine whether more relationships occurred in the predicted direction (i.e., thinner cortices would correspond to better cognitive functioning) than would have occurred by chance (Ghahramani, 1996). This was done to mitigate the consequences of the inflated error rate associated with multiple comparisons by examining whether the overall pattern of correlations was suggestive of the hypothesized relationship.
RESULTS
Cortical Thickness and Age
Ten brain regions showed correspondence between cortical thinness and increasing age between 12 and 14 years of age, and no region suggested cortical thickening across this period (see Figure 1). Areas where age was related to cortical thinning included: right isthmus cingulate (R2Δ = .04; p =.01; β = −.21), right medial orbitofrontal (R2Δ = .06; p =.001; β = −.25), right pars orbitalis (R2Δ = .03; p =.02; β = −.17), right posterior cingulate (R2Δ = .04; p =.008; β = −.20), right rostral middle frontal (R2Δ = .04; p =.004; β = −.21), right insula (R2Δ = .04; p =.006; β = −.21), left isthmus cingulate (R2Δ = .02; p =.05; β = −.15), left medial orbitofrontal (R2Δ = .03; p =.02; β = −.17), left rostral anterior cingulate (R2Δ = .05; p =.002; β = −.23), and left insula (R2Δ = .06; p =.001; β = −.25). See Figures 1 and 2.
Fig. 1.

Ten brain regions showed a relationship between thinner cortex and age between ages 12 and 14 (N = 185; 81 females, 104 males), with no brain region suggesting cortical thickening. *significant (p < .05) gender × age interactions (i.e., males and females showed different patterns across this age range).
Fig. 2.
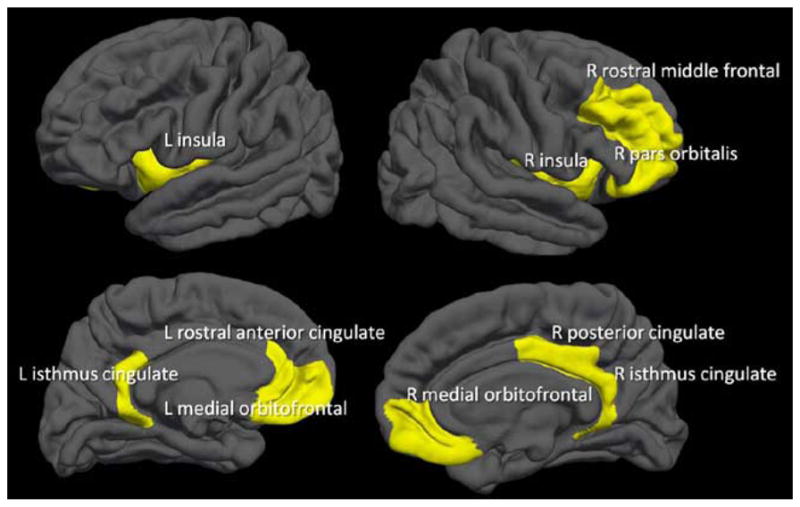
Brain regions showing cortical thinning over ages 12 to 14 (N = 185). Note: No regions showed cortical thickening.
Age × Gender Interaction on Cortical Thinning
Ten regions showed significant Age × Gender interactions (indicated by * in Figure 1). While both males and females showed thinning cortices over age as expected, the rate and trajectory varied between males and females. These areas included the right isthmus cingulate, right medial orbitofrontal, right pars orbitalis, right posterior cingulate, right rostral middle frontal, right insula, left caudal anterior cingulate, left medial orbitofrontal, left rostral anterior cingulate, and left insula.
Neuropsychological Functioning and Age
There was no significant relationship (p < .05) between age and performance in any of the six empirically derived cognitive domains.
Cortical Thickness and Neuropsychological Performance
Global functioning
Thinner left and right parietal lobes were related to better global cognitive performance (p < .05). Follow-up analyses revealed that thinner cortices in right inferior parietal (R2Δ = .02; p =.04; β = −.15), right superior parietal (R2Δ = .02; p =.04; β = −.16), and left inferior parietal (R2Δ = .04; p <.01; β = −.21) regions were related to better global cognitive performance. Cortical thickness was not related to cognitive performance in frontal, temporal, or occipital regions. No regions showed a positive relationship between cortical thickness and overall neuropsychological performance (see Table 1 and Figure 3).
Table 1.
Beta weights for brain regions showing a relationship between cortical thickness and neuropsychological performance (N = 185; p < .05)
| Brain lobe | Global | Working Memory | Attention | Verbal Learning and Memory | Visuospatial Functioning | Spatial Planning and Problem Solving | Inhibition |
|---|---|---|---|---|---|---|---|
| Parietal lobe | |||||||
| Right inferior parietal | −.15 | — | — | −.16 | −.20* | — | — |
| Right superior parietal | −.16 | — | — | −.24* | — | −.14 | — |
| Left inferior parietal | −.21* | — | — | −.18 | −.17 | — | — |
| Left superior parietal | — | — | — | — | −.16 | — | — |
Note. For all regions, thinner cortices corresponded to better neuropsychological performance (p <.05).
Asterisks indicates regions where results surpass Bonferroni corrections.
Fig. 3.
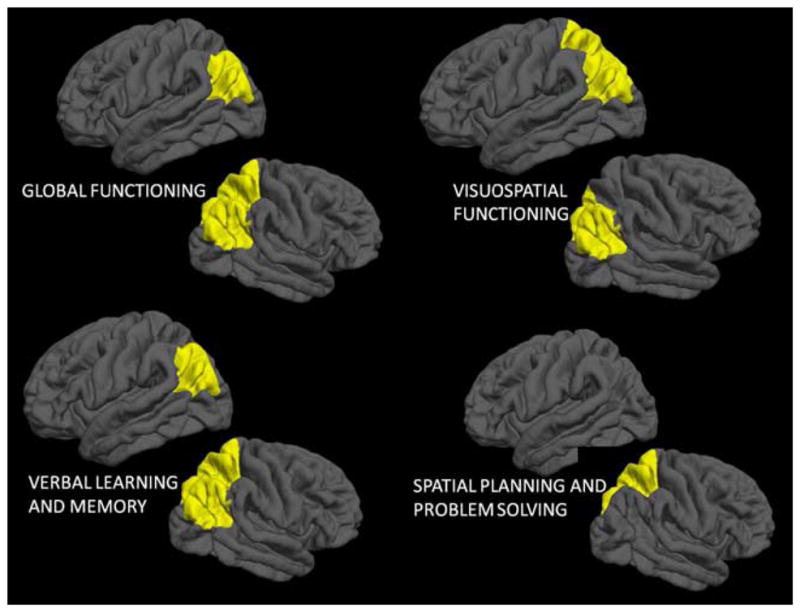
Cortical thinning related to improved global cognitive functioning, verbal learning and memory, visuospatial functioning, and spatial planning and problem solving in parietal regions in 12- to 14-year-old adolescents (N = 185).
Working memory
No brain lobes showed a significant relationship between cortical thickness and working memory.
Attention
No brain lobes showed a significant relationship between cortical thickness and attention performance.
Verbal learning and memory
Thinner cortices in the left and right parietal lobe related to better verbal learning and memory. Specifically, thinner right inferior parietal (R2Δ = .02; p =.04; β = −.16), right superior parietal (R2Δ = .06; p <.001; β = −.24), and left inferior parietal (R2Δ = .03; p =.02; β = −.18), lobes were related to better verbal learning and memory performance (see Table 1 and Figure 3).
Visuospatial functioning
Thinner cortices in the left and right parietal lobe related to better visuospatial functioning. Specifically, thinner right inferior parietal (R2Δ = .04; p <.01; β = −.20), left inferior parietal (R2Δ = .03; p =.02; β = −.17), and left superior parietal (R2Δ = .03; p =.03; β = −.16) lobes were related to better visuospatial functioning (see Table 1 and Figure 3).
Spatial planning/problem solving
Thinner cortices in the right parietal lobe were related to better spatial planning and problem solving abilities. Specifically, thinner right superior parietal (R2Δ = .02; p =.05; β = −.14) cortices were related to better spatial planning and problem solving (See Table 1 and Figure 3).
Inhibition
No brain lobes showed a significant relationship between cortical thickness and inhibition.
DISCUSSION
The present study aimed to elucidate the relationship between typical cortical thinning during adolescence and neuropsychological functioning in a sample of 185 healthy 12- to 14-year-old adolescents. As expected, several brain regions, predominantly in frontal areas, showed significant relationships between cortical thinning and age, within this age range. In no region was cortex thicker with older age. Gender moderated the effect of age on cortical thinning in several regions, with males showing more accelerated thinning than females between ages 12 and 14. Finally, we found thinner cortex in parietal association cortices was associated with better neurocognitive functioning globally, and in particular for verbal learning and memory, visuospatial functioning, and spatial planning and problem solving.
The pattern of cortical thinning in frontal regions observed in our sample of healthy adolescents may reflect findings from studies suggesting the elimination of unnecessary synaptic connections (Huttenlocher, 1990). As expected, rates of development differed for males and females in our sample. Males appeared to show more accelerated thinning of cortices over this age range, while females exhibited more attenuated thinning. This could be consistent with the idea that females tend to mature earlier in these regions than male counterparts, with females already having exhibited the most significant thinning in these regions as compared to males (Lenroot et al., 2007). These sexual dimorphic effects may be related to hormone levels at different stages of pubertal maturation (Bramen et al., 2012; Giedd et al., 2012; Panizzon et al., 2009).
While normative neuropsychological data has shown a consistent improvement in cognitive functioning over adolescence (Delis et al., 2001; Delis, Kramer, Kaplan, & Ober, 1994; Wechsler, 1997, 1999), the neural underpinnings of these improvements are less clear. In this study, we found that cortical thinning, particularly in parietal regions, may help explain this increase in both global and domain-specific neuropsychological functioning. Cortical thinning was related to better neuropsychological functioning in bilateral parietal cortices. This relationship was also found across specific cognitive domains, including verbal learning and memory, visuospatial functioning, and spatial planning and problem solving. No regions showed a significant relationship between cortical thickening and cognitive performance.
Synaptic pruning, white matter encroachment on gray matter due to increasing axonal myelination, and changes in the extracellular matrix are believed to underlie developmental changes and differences seen in gray matter volume between childhood to adulthood (Gogtay et al., 2004; Gogtay & Thompson, 2010; Sowell et al., 2002, 2003, 2004). Elimination of unnecessary synaptic connections and increases in myelination could be contributing to the neurocognitive improvements observed in this study. Specifically, these structural changes may be related to more efficient and speeded processing of information, which affected not only general intelligence, but also specific cognitive domains.
Of interest, all relationships between cortical thinning and neuropsychological functioning were in parietal regions and associated with enhanced cognitive performance. Posterior brain regions typically undergo neurodevelopment before frontal and temporal regions and may be a more stabilized marker of neuropsychological functioning at this developmental stage. Anterior regions of the brain continue to undergo significant neurodevelopment (as evidenced by our cortical thickness-age analyses), and, therefore, ongoing architectural changes during this window of development may obscure existing structural-functional relationships, particularly for higher-order cognitive demands where performance is more distributed throughout the brain.
This study had several notable strengths and limitations. This is one of the largest examinations (N = 185) of healthy adolescents that used both comprehensive neuropsychological test and 3T neuroimaging data. As opposed to previous research which primarily focused on overall intelligence or very specific neurocognitive domains, we examined the relationship between general intelligence and several neuropsychological domains over the entire brain to obtain a more complete picture of the brain structure-function relationship. However, each participant had data at only one time point, so we could not examine individual trajectories over this age range, and cannot infer causation or assert that cortical thinning is responsible for the observed improved behavioral performance. If strict Type I error corrections were applied, many of the regions would not have reached significance. To mitigate the consequences of the inflated error rate associated with multiple comparisons, we used Fischer’s exact test to see if the overall pattern of correlations was suggestive of the hypothesized relationship, and found that the results, when taken together, were highly consistent (p < .001). Finally, this study focused on gray matter maturation only. Future studies examining both gray and white matter maturation in tandem, as well as exploration of the effect of cortical thinning on affective development (Urošević, Collins, Muetzel, Lim, & Luciana, 2012) are warranted.
In summary, our findings support the idea that during early adolescence, the cortex is undergoing significant cortical thinning, particularly in parietal and frontal regions. In turn, thinner cortices relate to better global cognitive functioning, as well as improved functioning on domain-specific tasks of learning and memory, visuospatial functioning, and spatial planning and problem solving, above and beyond the effect of chronological age. Any insults to typical cortical thinning during this time period from substance use, traumatic brain injury, or medical illness could have implications on adolescents’ expected cognitive and behavioral functioning, or interruptions to cognitive functioning could likewise affect the cortical thinning process. Future research over a larger age range using longitudinal data is warranted to clarify the effect of age-related cortical thinning on cognitive functioning during adolescence.
Acknowledgments
Special thanks to the Youth at Risk lab: M. J. Meloy, Ph.D., Sonja Eberson, M.S., Norma Castro, M.S., Katy Bever, B.A., and the participating schools in the San Diego Unified School District and their families. This work was supported by grants from the National Institute of Alcohol Abuse and Alcoholism (S.F.T., R01 AA13419, U01 AA021692; L.M.S., F32 AA021610); the National Institute of Mental Health (L.M.S., T32 MH018399); and the National Institute of Drug Abuse (J.J., F32 DA032188).
Footnotes
The authors report no conflicts of interest.
Portions of this study were presented at the 2013 meeting of the International Neuropsychological Society conference.
References
- American Psychological Association. Diagnostic and Statistical Manual of Mental Disorders. 4. Washington, DC: American Psychiatric Association; 1994. (DSM-IV) [Google Scholar]
- Bramen JE, Hranilovich JA, Dahl RE, Chen J, Rosso C, Forbes EE, Sowell ER. Sex matters during adolescence: Testosterone-related cortical thickness maturation differs between boys and girls. PLoS One. 2012;7:e33850. doi: 10.1371/journal.pone.0033850. [DOI] [PMC free article] [PubMed] [Google Scholar]
- Brown TT, Jernigan TL. Brain development during the preschool years. Neuropsychology Review. 2012;22:313–333. doi: 10.1007/s11065-012-9214-1. [DOI] [PMC free article] [PubMed] [Google Scholar]
- Dale AM, Fischl B, Sereno MI. Cortical surface-based analysis. I. Segmentation and surface reconstruction. Neuroimage. 1999;9:179–194. doi: 10.1006/nimg.1998.0395. [DOI] [PubMed] [Google Scholar]
- Delis DC, Kramer JH, Kaplan E, Ober BA. Manual for the California Verbal Learning Test–Children’s Version. San Antonio, TX: The Psychological Corporation; 1994. [Google Scholar]
- Delis DC, Kaplan E, Kramer JH. The Delis-Kaplan Executive Function System: Examiner’s manual. San Antonio, TX: The Psychological Corporation; 2001. [Google Scholar]
- Desikan RS, Segonne F, Fischl B, Quinn BT, Dickerson BC, Blacker D, Killiany RJ. An automated labeling system for subdividing the human cerebral cortex on MRI scans into gyral based regions of interest. Neuroimage. 2006:968–980. doi: 10.1016/j.neuroimage.2006.01.021. [DOI] [PubMed] [Google Scholar]
- Fischl B, Dale AM. Measuring the thickness of the human cerebral cortex from magnetic resonance images. Proceedings of the National Academy of Sciences of the United States of America. 2000;97:11050–11055. doi: 10.1073/pnas.200033797. [DOI] [PMC free article] [PubMed] [Google Scholar]
- Fischl B, Sereno MI, Dale AM. Cortical surface-based analysis. II: Inflation, flattening, and a surface-based coordinate system. Neuroimage. 1999;9:195–207. doi: 10.1006/nimg.1998.0396. [DOI] [PubMed] [Google Scholar]
- Fischl B, van der Kouwe A, Destrieux C, Halgren E, Segonne F, Salat DH, Dale AM. Automatically parcellating the human cerebral cortex. Cerebral Cortex. 2004;14:11–22. doi: 10.1093/cercor/bhg087. [DOI] [PubMed] [Google Scholar]
- Ghahramani S. Fundamentals of probability. Upper Saddle River, New Jersey: Prentice Hall; 1996. [Google Scholar]
- Giedd JN, Blumenthal J, Jeffries NO, Castellanos FX, Liu H, Zijdenbos A, Rapoport JL. Brain development during childhood and adolescence: A longitudinal MRI study. Nature Neuroscience. 1999;2:861–863. doi: 10.1038/13158. [DOI] [PubMed] [Google Scholar]
- Giedd JN, Clasen LS, Lenroot R, Greenstein D, Wallace GL, Ordaz S, Chrousos GP. Puberty-related influences on brain development. Molecular and Cellular Endocrinology. 2006;254–255:154–162. doi: 10.1016/j.mce.2006.04.016. [DOI] [PubMed] [Google Scholar]
- Giedd JN, Raznahan A, Mills K, Lenroot RK. Review: Magnetic resonance imaging of male/female differences in human adolescent brain anatomy. Biology of Sex Differences. 2012;3(1):19. doi: 10.1186/2042-6410-3-19. [DOI] [PMC free article] [PubMed] [Google Scholar]
- Gogtay N, Giedd JN, Lusk L, Hayashi KM, Greenstein D, Vaituzis AC, Thompson PM. Dynamic mapping of human cortical development during childhood through early adulthood. Proceedings of the National Academy of Sciences of the United States of America. 2004;101:8174–8179. doi: 10.1073/pnas.0402680101. [DOI] [PMC free article] [PubMed] [Google Scholar]
- Gogtay N, Thompson PM. Mapping gray matter development: Implications for typical development and vulnerability to psychopathology. Brain and Cognition. 2010;72(1):6–15. doi: 10.1016/j.bandc.2009.08.009. [DOI] [PMC free article] [PubMed] [Google Scholar]
- Hooper HE. The Hooper Visual Organization Test manual. Los Angeles: Western Psychological Services; 1958. [Google Scholar]
- Huttenlocher PR. Morphometric study of human cerebral cortex development. Neuropsychologia. 1990;28:517–527. doi: 10.1016/0028-3932(90)90031-i. [DOI] [PubMed] [Google Scholar]
- Jernigan TL, Trauner DA, Hesselink JR, Tallal PA. Maturation of human cerebrum observed in vivo during adolescence. Brain. 1991;114(Pt 5):2037–2049. doi: 10.1093/brain/114.5.2037. [DOI] [PubMed] [Google Scholar]
- Karama S, Colom R, Johnson W, Deary IJ, Haier R, Waber DP, Evans AC. Cortical thickness correlates of specific cognitive performance accounted for by the general factor of intelligence in healthy children aged 6 to 18. Neuroimage. 2009;55(4):1443–1453. doi: 10.1016/j.neuroimage.2011.01.016. [DOI] [PMC free article] [PubMed] [Google Scholar]
- Kuperberg GR, Broome MR, McGuire PK, David AS, Eddy M, Ozawa F, Fischl B. Regionally localized thinning of the cerebral cortex in schizophrenia. Archives of General Psychiatry. 2003;60(9):878–888. doi: 10.1001/archpsyc.60.9.878. [DOI] [PubMed] [Google Scholar]
- Lebel C, Beaulieu C. Longitudinal development of human brain wiring continues from childhood into adulthood. [Research Support, Non-US Gov’t] Journal of Neuroscience. 2011;31(30):10937–10947. doi: 10.1523/JNEUROSCI.5302-10.2011. [DOI] [PMC free article] [PubMed] [Google Scholar]
- Lenroot RK, Gogtay N, Greenstein DK, Wells EM, Wallace GL, Clasen LS, Giedd JN. Sexual dimorphism of brain developmental trajectories during childhood and adolescence. Neuroimage. 2007;36(4):1065–1073. doi: 10.1016/j.neuroimage.2007.03.053. [DOI] [PMC free article] [PubMed] [Google Scholar]
- Lewis RF. Digit Vigilance Test. Odessa, FL: Psychological Assessment Resources; 1995. [Google Scholar]
- Luders E, Narr KL, Thompson PM, Toga AW. Neuroanatomical correlates of intelligence. Intelligence. 2009;37(2):156–163. doi: 10.1016/j.intell.2008.07.002. [DOI] [PMC free article] [PubMed] [Google Scholar]
- Østby Y, Tamnes CK, Fjell AM, Walhovd KB. Dissociating memory processes in the developing brain: The role of hippocampal volume andcortical thickness in recall after minutes versus days. Cerebral Cortex. 2012;22(2):381–390. doi: 10.1093/cercor/bhr116. [DOI] [PubMed] [Google Scholar]
- Østby Y, Tamnes CK, Fjell AM, Westlye LT, Due-Tønnessen P, Walhovd KB. Heterogeneity in subcortical brain development: A structural magnetic resonance imaging study of brain maturation from 8 to 30 years. Journal of Neuroscience. 2009;29(38):11772–11782. doi: 10.1523/JNEUROSCI.1242-09.2009. [DOI] [PMC free article] [PubMed] [Google Scholar]
- Panizzon MS, Fennema-Notestine C, Eyler LT, Jernigan TL, Prom-Wormley E, Neale M, Kremen WS. Distinct genetic influences on cortical surface area and cortical thickness. Cerebral Cortex. 2009;19(11):2728–2735. doi: 10.1093/cercor/bhp026. [DOI] [PMC free article] [PubMed] [Google Scholar]
- Paus T. Mapping brain maturation and cognitive development during adolescence. Trends in Cognitive Science. 2005;9(2):60–68. doi: 10.1016/j.tics.2004.12.008. [DOI] [PubMed] [Google Scholar]
- Porter JN, Collins PF, Muetzel RL, Lim KO, Luciana M. Associations between cortical thickness and verbal fluency in childhood, adolescence, and young adulthood. Neuroimage. 2011;55(4):1865–1877. doi: 10.1016/j.neuroimage.2011.01.018. [DOI] [PMC free article] [PubMed] [Google Scholar]
- Rey A, Osterrieth PA. Translations of excerpts from Andre Rey’s “Psychological examination of traumatic encephalopathy” and P.A. Osterrieth’s “The complex figure copy test”. In: Corwin J, Bylsma FW, translators. The Clinical Neuropsychologist. Vol. 7. 1993. pp. 3–21. [Google Scholar]
- Rosas HD, Liu AK, Hersch S, Glessner M, Ferrante RJ, Salat DH, Fischl B. Regional and progressive thinning of the cortical ribbon in Huntington’s disease. Neurology. 2002;58:695–701. doi: 10.1212/wnl.58.5.695. [DOI] [PubMed] [Google Scholar]
- Salat DH, Buckner RL, Snyder AZ, Greve DN, Desikan RS, Busa E, Fischl B. Thinning of the cerebral cortex in aging. Cerebral Cortex. 2004;14:721–730. doi: 10.1093/cercor/bhh032. [DOI] [PubMed] [Google Scholar]
- Schilling C, Kühn S, Paus T, Romanowski A, Banaschewski T, Barbot A, Gallinat J. Cortical thickness of superior frontal cortex predicts impulsiveness and perceptual reasoning in adolescence. Molecular Psychiatry. 2013;18:624–630. doi: 10.1038/mp.2012.56. [DOI] [PubMed] [Google Scholar]
- Shaffer D, Fisher P, Lucas CP, Dulcan MK, Schwab-Stone ME. NIMH Diagnostic Interview Schedule for Children Version IV (NIMH DISC-IV): Description, differences from previous versions, and reliability of some common diagnoses. Journal of the American Academy of Child and Adolescent Psychiatry. 2000;39:28–38. doi: 10.1097/00004583-200001000-00014. [DOI] [PubMed] [Google Scholar]
- Shaw P, Greenstein D, Lerch J, Clasen L, Lenroot R, Gogtay N, Giedd J. Intellectual ability and cortical development in children and adolescents. Nature. 2006;440(7084):676–679. doi: 10.1038/nature04513. [DOI] [PubMed] [Google Scholar]
- Shaw P, Kabani NJ, Lerch JP, Eckstrand K, Lenroot R, Gogtay N, Wise SP. Neurodevelopmental trajectories of the human cerebral cortex. Journal of Neuroscience. 2008;28(14):3586–3594. doi: 10.1523/JNEUROSCI.5309-07.2008. [DOI] [PMC free article] [PubMed] [Google Scholar]
- Sowell ER, Delis D, Stiles J, Jernigan TL. Improved memory functioning and frontal lobe maturation between childhood and adolescence: A structural MRI study. Journal of the International Neuropsychological Society. 2001;7(3):312–322. doi: 10.1017/s135561770173305x. [DOI] [PubMed] [Google Scholar]
- Sowell ER, Peterson BS, Thompson PM, Welcome SE, Henkenius AL, Toga AW. Mapping cortical change across the human life span. Nature Neuroscience. 2003;6(3):309–315. doi: 10.1038/nn1008. [DOI] [PubMed] [Google Scholar]
- Sowell ER, Thompson PM, Leonard CM, Welcome SE, Kan E, Toga AW. Longitudinal mapping of cortical thickness and brain growth in normal children. Journal of Neuroscience. 2004;24(38):8223–8231. doi: 10.1523/JNEUROSCI.1798-04.2004. [DOI] [PMC free article] [PubMed] [Google Scholar]
- Sowell ER, Trauner DA, Gamst A, Jernigan TL. Development of cortical and subcortical brain structures in childhood and adolescence: A structural MRI study. Developmental Medicine and Child Neurology. 2002;44(1):4–16. doi: 10.1017/s0012162201001591. [DOI] [PubMed] [Google Scholar]
- Squeglia LM, Pulido C, Wetherill RR, Jacobus J, Brown GG, Tapert SF. Brain response to working memory over three years of adolescence: Influence of initiating heavy drinking. Journal of Studies on Alcohol and Drugs. 2012;73(5):749–760. doi: 10.15288/jsad.2012.73.749. [DOI] [PMC free article] [PubMed] [Google Scholar]
- Squeglia LM, Spadoni AD, Infante MA, Myers MG, Tapert SF. Initiating moderate to heavy alcohol use predicts changes in neuropsychological functioning for adolescent girls and boys. Psychology of Addictive Behaviors. 2009;23(4):715–722. doi: 10.1037/a0016516. [DOI] [PMC free article] [PubMed] [Google Scholar]
- Tamnes CK, Ostby Y, Fjell AM, Westlye LT, Due-Tønnessen P, Walhovd KB. Brain maturation in adolescence and young adulthood: Regional age-related changes in cortical thickness and white matter volume and microstructure. Cerebral Cortex. 2010;20(3):534–548. doi: 10.1093/cercor/bhp118. [DOI] [PubMed] [Google Scholar]
- Tamnes CK, Østby Y, Walhovd KB, Westlye LT, Due-Tønnessen P, Fjell AM. Neuroanatomical correlates of executive functions in children and adolescents: A magnetic resonance imaging (MRI) study of cortical thickness. Neuropsychologia. 2010;48(9):2496–2508. doi: 10.1016/j.neuropsychologia.2010.04.024. [DOI] [PubMed] [Google Scholar]
- Urošević S, Collins P, Muetzel R, Lim K, Luciana M. Longitudinal changes in behavioral approach system sensitivity and brain structures involved in reward processing during adolescence. Developmental Psychology. 2012;48(5):1488–1500. doi: 10.1037/a0027502. [DOI] [PMC free article] [PubMed] [Google Scholar]
- Wechsler D. Wechsler Intelligence Scale for Children. 3. New York: The Psychological Corporation; 1991. [Google Scholar]
- Wechsler D. Wechsler Adult Intelligence Scale. 3. San Antonio, TX: The Psychological Corporation; 1997. [Google Scholar]
- Wechsler D. Wechsler Abbreviated Scale of Intelligence. San Antonio, TX: The Psychological Corporation; 1999. [Google Scholar]
- Wechsler D. Wechsler Adult Intelligence Scale. 4. San Antonio, TX: Pearson; 2008. [Google Scholar]
- Winkler AM, Kochunov P, Blangero J, Almasy L, Zilles K, Fox PT, Glahn DC. Cortical thickness or grey matter volume? The importance of selecting the phenotype for imaging genetics studies. Neuroimage. 2010;53(3):1135–1146. doi: 10.1016/j.neuroimage.2009.12.028. [DOI] [PMC free article] [PubMed] [Google Scholar]
- Winkler AM, Sabuncu MR, Yeo BT, Fischl B, Greve DN, Kochunov P, Glahn DC. Measuring and comparing brain cortical surface area and other areal quantities. Neuroimage. 2012;61(4):1428–1443. doi: 10.1016/j.neuroimage.2012.03.026. [DOI] [PMC free article] [PubMed] [Google Scholar]