

Significance
Mechanisms that control physiologic hematopoietic stem-cell (HSC) self-renewal remain largely unknown. Inhibition of retinoic acid (RA) signaling in HSCs maintained their primitive phenotype and function, and promoted their self-renewal. Moreover, bone marrow stroma’s expression of the cytochrome P450 retinoid-inactivating enzyme, CYP26, allowed HSC self-renewal by maintaining an environment low in retinoids. Thus, HSCs appear to be intrinsically programmed to undergo RA-mediated differentiation unless prevented from doing so by bone marrow niche CYP26. Modulation of RA signaling also holds promise for clinical HSC expansion.
Abstract
The high expression of aldehyde dehydrogenase 1, also known as retinaldehyde dehydrogenase, by hematopoietic stem cells (HSCs) suggests an important role for retinoic acid (RA) signaling in determining the fate of these cells. We found that primitive human bone marrow-derived CD34+CD38− cells not only highly express aldehyde dehydrogenase 1, but also the RA receptor α. Despite the up-regulation of early components of RA signaling, the downstream pathway remained inactive in the primitive CD34+CD38− cells. Primitive hematopoietic cells rapidly undergo terminal differentiation when cultured away from their microenvironment; however, we found that inhibition of RA signaling maintained their primitive phenotype and function, and promoted their self-renewal. HSCs reside in a complex microenvironment that enforces the balance between self-renewal and differentiation. The exact physiologic mechanisms by which the niche controls HSC fate remain elusive. The embryonic gonadal microenvironment has recently been shown to determine germ-cell fate by degrading RA through expression of the P450 retinoid-inactivating enzyme CYP26B1. We found that the bone marrow microenvironment similarly can control primitive hematopoietic cell fate via modulation of retinoid bioavailability. Accordingly, we found that bone marrow stromal cell CYP26 was also able to inactivate retinoids in serum, preventing RA signaling. Thus, primitive hematopoietic cells appear to be intrinsically programmed to undergo RA-mediated differentiation unless prevented from doing so by bone marrow niche CYP26. Modulation of RA signaling also holds promise for clinical HSC expansion, a prerequisite for the wide-scale use of these cells in regenerative medicine and gene therapy.
One of the best-studied hematopoietic stem-cell (HSC) markers is aldehyde dehydrogenase (ALDH), specifically the ALDH1 family of enzymes also known as retinaldehyde dehydrogenases (1). ALDH1 also is a marker for stem cells from most other tissues, and its expression decreases as stem cells differentiate (2). Although ALDH1’s precise function in stem-cell biology is unclear, the major biologic function of the ALDH1 family appears to be the biosynthesis of retinoic acid (RA), the active metabolite of vitamin A (retinol) (3). ALDH1 catalyzes the final step of this process, the oxidation of retinaldehyde to RA (3). Once synthesized, RA enters the nucleus and signals via a heterodimer formed by the RA receptor (RAR) and retinoid-X-receptor to drive transcription of target genes. Retinoids (vitamin A and RA) are primarily inactivated by the CYP26 enzyme family, members of cytochrome P450 system (4).
Although RA signaling is essential for the homeostasis of diverse biological systems (5), its role in hematopoiesis, and HSC biology in particular, is still unclear. Based on its ability to differentiate both normal (6) and malignant (7) promyelocytes, RA has become established as an integral part of current treatments for acute promyelocytic leukemia. In regard to the HSC compartment however, studies using murine or human umbilical cord blood HSCs show apparent contradictory roles for RA signaling. Murine models have shown that HSC expansion can be achieved either by activation of the RA pathway (8) or its inhibition via retroviral-mediated expression of dominant negative RARα (9). Inhibition of ALDH1 and, thus, presumably de novo synthesis of RA was shown to expand umbilical cord blood CD34+CD38− cells capable of long-term engraftment of immunodeficient mice (SCID-repopulating cells or SRCs) (10). Although somewhat discordant, these studies, together with the high expression of ALDH1 in HSCs, propose RA as an important physiologic signal for controlling HSC homeostasis.
Retinoid signaling has, in fact, been shown to play a critical role in determining the fate of stem-like cells in at least one other tissue: germ cells in the embryonic gonadal niche (11). RA produced by ALDH1 in the embryonic mesonephroi of both sexes induces germ cells to enter meiosis and initiate oogenesis. In the male embryonic gonad, Sertoli cells in the gonadal microenvironment inactivate RA through expression of CYP26B1, ultimately leading to spermatogenesis. Thus, germ cells appear to be intrinsically programmed to respond to retinoids by entering meiosis, unless specifically prevented from doing so by CYP26B1 expression in the microenvironment (11).
In the bone marrow, HSCs reside in a highly complex microenvironment that assures their survival, self-renewal, and differentiation (12). However, the microenvironment’s mechanisms responsible for maintaining HSC homeostasis remain unclear. Moreover, our limited current understanding of physiologic self-renewal of adult human bone marrow-derived HSCs (13) is based largely on data from murine models and umbilical cord blood (14–17). Here we show that primitive bone marrow CD34+CD38− hematopoietic cells express the early components of RA biosynthesis machinery and RARs, but the downstream pathway remains inactive. Activation of RA signaling is associated with a more differentiated state (CD34+CD38+), and inhibition of RA signaling results in expansion of human SRCs through self-renewal. In addition, similar to the gonadal niche, we show that the bone marrow stroma prevents downstream RA signaling and differentiation of primitive human CD34+CD38− cells by inactivating retinoids through the expression of CYP26.
Results
Primitive CD34+CD38− Cells Express Early, but Not Late, Components of the RA Signaling Pathway.
It is generally accepted that most human HSCs exhibit a CD34+CD38− phenotype. This compartment, although heterogeneous in nature, contains few assayable differentiated hematopoietic progenitor cells or colony-forming unit cells (CFU-Cs), which are enriched in the CD34+CD38+ cell fraction (17). In contrast, assayable primitive hematopoietic cells, such as cells capable of forming cobblestones after 8 wk of coculture with stromal cells (week 8 cobblestone area forming cells or CAFCW8) (18) and SRCs, are highly enriched in the CD34+CD38− cell fraction (19–21). Upon culture in the presence of growth factors, CD34+CD38− cells will proliferate and differentiate with the generation of “de novo” CFU-Cs (21); however, little self-renewal occurs, and HSC activity is rapidly exhausted (22).
To identify pathways that could regulate HSC fate, we first obtained genome-wide exon microarray data on CD34+CD38− and matched CD34+CD38+ cell populations from five normal bone marrow donors. Unbiased pathway analysis of these data uncovered the RA pathway as one of the top to show coordinate inactivation in the CD34+CD38− compared with CD34+CD38+ populations (Z score = −3.946, P = 3.9e−5; Fig. 1 and Table S1). Although the transcriptional levels of RARα were higher in the primitive CD34+CD38− cells than in the CD34+CD38+ cells, the expression levels of the majority of its downstream targets were down-regulated in CD34+CD38− cells (Fig. 1). As expected (1, 2), the transcriptional level of ALDH1A1 was also highly up-regulated in CD34+CD38− cells (Fig. 1). Therefore, despite that ALDH1A1, required for production of RA, and RARα were highly expressed, the downstream RA signaling pathway was in fact suppressed in CD34+CD38− cells.
Fig. 1.
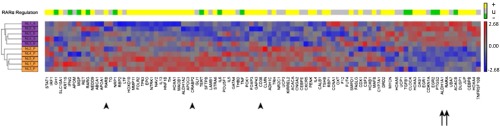
Heatmap of relative expression of RARA pathway genes in CD34+CD38− and CD34+CD38+ cells. The normalized transcriptional level of each of the known canonical RARA target genes is represented by its row-standardized Z score according to the red-blue color scale below. Unsupervised hierarchical clustering of the samples shows that the expression patterns of RARα pathway genes distinguishes CD34+CD38− cells (purple sample labels) from CD34+CD38+ cells (orange sample labels). Genes are ordered according to the unsupervised hierarchical clustering of their expression patterns across samples. The colored boxes above each column indicate whether that gene is canonically predicted to be activated by RARα (yellow boxes), inhibited by RARα (green boxes), or unknown (gray boxes). Arrows indicate genes known to be part of RA signaling machinery (ALDH1A1 and RARα), whereas arrowheads indicate classical targets of RA signaling pathway (RARβ, CARBP, CD38).
Inhibition of RA Signaling Results in Expansion of Primitive Hematopoietic Cells.
To test whether suppression of downstream RA signaling is critical to maintaining primitive hematopoietic cells, CD34+CD38− cells from normal human bone marrow were cultured in serum-free conditions containing thrombopoietin, stem-cell factor, and Flt3-ligand (TSF) with and without the pan-RAR inhibitor AGN194310 (AGN) (11, 23). Culture of the CD34+CD38− cells with TSF rapidly generated CFU-Cs, whose numbers reached a plateau at approximately day 21 (Fig. S1A). In vitro culture of the CD34+CD38− cells in TSF also resulted in increased numbers of CD34+CD38− cells (Fig. S1B) and the primitive CAFCW8 (Fig. S1C) over 7–14 d, but by days 21–28 of culture, only a fraction of CD34+CD38− cells and CAFCW8 remained. When AGN was added to the in vitro cultures, there was a relative lag in generation of CFU-Cs during the first 7–14 d compared with control cultures. Thereafter, the number of CFU-Cs from the AGN cultures expanded beyond the control cultures, resulting in a statistically higher overall output of CFU-C by day 28 (Fig. S1A). Inhibition of RAR signaling also significantly expanded CD34+CD38− cells (Fig. S1B) and CAFCW8 numbers (Fig. S1C) compared with TSF alone, whereas the addition of 0.1 µM all-trans retinoic acid reversed the effects of AGN (Fig. S1D).
Inhibition of RA Signaling Results in Expansion of SRCs.
The gold standard measure of human HSC function remains the ability to engraft, differentiate, and self-renew in immunodeficient mice (24). Sublethally conditioned (225 cGy) NOD/SCID-IL2Rγ−/−(NSG) mice were transplanted with limiting dilutions of CD34+CD38− cells before and after in vitro liquid culture. Human engraftment was measured in the bone marrow of recipient mice 18–20 wk after transplantation (Fig. 2, Fig. S2, and Tables S2 and S3). Using Poisson regression, the frequency of SRCs in the bone marrow CD34+CD38− cells was 1:1,758 (95% confidence interval 1:1,004–1:3,079) (Table S2). Culture of CD34+CD38− cells in TSF resulted in a slight increase in SRC frequency after 7 d (1.4 ± 0.3, mean ± SEM of fold increase over day 0) but exhaustion of SRCs by day 14 (Fig. 2A and Table S2). However, the presence of AGN in the liquid culture conditions resulted in a significant expansion of SRC numbers after 7 and 14 d, and relative maintenance after 21 d, compared with day 0 (Fig. 2A and Table S2). Superior SRC numbers in the AGN-treated cultures were confirmed in secondary transplantation experiments by using bone marrow from primary recipients (Table S3). In addition, mice transplanted with cells cultured in the presence of AGN had overall higher levels of engraftment compared with control conditions (Fig. 2B). Thus, inhibiting RA signaling maintains, and even promotes self-renewal of, bone marrow-derived primitive hematopoietic cells (CAFCW8s and SRCs).
Fig. 2.

Effects of inhibition of RA signaling on NSG engraftment. (A) CD34+CD38− cells cultured in the presence of TSF demonstrated a rapid decline of SRCs after 14 d (0.4 ± 0.1 fold of day 0). Culture in the presence of AGN for 7–14 d was associated with net SRC expansion compared with day (D) 0 (day 7: 4.1 ± 0.9, day 14: 1.6 ± 0.2, P = 0.03 and 0.04, respectively; AGN vs. D0). (B) Percentage of human engraftment in the bone marrow of individual NSG mice, 18–20 wk after transplantation of 2,000 CD34+CD38− cells or their output after liquid culture. Black diamonds represent individual mice, and line/number represents average. Data pools three independent experiments. P values shown are for TSF vs. TSF + AGN.
Bone Marrow Stromal CYP26 Inactivates Retinoids.
The microenvironment provided by stromal cells has been the best way to maintain primitive hematopoietic cell activity in vitro (25). Some stromal cell lines have been shown to maintain hematopoiesis in vitro for up to 8 wk (25, 26). Because fetal gonad microenvironment determines germ-cell fate through inactivating RA (11), we hypothesized that bone marrow stroma similarly maintains a retinoid-free environment for primitive hematopoietic cells. We used a RA-responsive luciferase reporter (27) to monitor the effects of stroma on the retinoid activity of serum-containing media. Luciferase activity induced by serum, which contains micromolar concentrations of retinoids (28), was significantly reduced by either pharmacological inhibition of RAR via AGN or by cotransfection with a dominant-negative RAR vector (RARαΔ403) (Fig. 3A) (9). Incubation of serum-containing media with bone marrow-derived stroma also significantly lowered luciferase activity (Fig. 3A).
Fig. 3.

Effects of stromal CYP26 on RA metabolism. (A) Quantification of RA activity using an RA response element-luciferase reporter. Relative firefly luciferase activity was normalized to Renilla for individual conditions. Data represent the mean ± SEM fold change from control media (RPMI 1640 + 10% FBS) of three independent experiments. (B) Expression of CYP26A1 and B1 mRNA levels in CD34+CD38− human hematopoietic cells from two normal volunteers (H1 and H2) as well as primary adherent human bone marrow stroma from five normals (S1–S5). Relative mRNA levels of CYP26A1 were calculated from real-time RT-PCR experiments. Two independent experiments are presented.
We found that adherent human stromal cells commonly used for maintaining in vitro hematopoiesis expressed CYP26 isoenzymes A1 and B1, but not C1 (Fig. 3B). OP-9 cells also highly expressed CYP26A1 and CYP26B1. Conversely, bone marrow CD34+CD38− cells expressed low levels of CYP26A1 (>20-fold less than bone marrow stroma) and no detectable CYP26B1 (Fig. 3B). Incubation of stromal cells with R115866, a specific inhibitor of all three CYP26 isoenzymes (29), rescued RA activity in stromal-conditioned media (Fig. 3A, fifth column). These results suggest that CYP26 activity is responsible for bone marrow stromal-mediated inactivation of RA activity.
Bone Marrow Stromal CYP26 Activity Contributes to the Maintenance of Primitive Hematopoietic Cells.
As expected, culture of CD34+CD38− cells on bone marrow stroma maintained their primitive phenotype (Fig. 4A, Middle) and their CAFCW8 activity (Fig. 4B, Center) for up to 21 d. The addition of the CYP26 inhibitor to the stromal coculture conditions resulted in accelerated loss of CD34+CD38− cells (Fig. 4A, Lower) and decreased numbers of CAFCW8 (Fig. 4B, Right) at day 21 of coculture. Inhibition of CYP26 in stroma-free cultures had no effect on the maintenance of CD34+CD38− cells. CYP26B1 knockdown via shRNA similarly reversed the protective effects of stroma on the CD34+CD38− cells (Fig. 4C). Most importantly, the addition of the CYP26 inhibitor to the stromal coculture conditions blocked the maintenance of SRCs (Fig. 4D). These findings demonstrate that CYP26-mediated inactivation of retinoids is at least in part responsible for maintenance of the primitive hematopoietic cells by bone marrow stroma.
Fig. 4.

Role of CYP26 in the maintenance of primitive hematopoietic progenitor cells by bone marrow stroma. (A) Flow cytometric analysis of human CD34+CD38− cells during serum-containing liquid cultures in the presence of TSF (Top), stroma cocultures (Middle) or stromal coculture + CYP26 inhibitor (Bottom). The data are representative of three experiments with similar results. Numbers between the brackets represent absolute number of cells cultured for this experiment. (B) Effects of stromal CYP26 on the maintenance of CAFCW8 cells during coculture of CD34+CD38− cells with or without CYP26 inhibitor for 21 d. Results are the mean ± SEM of three independent experiments. (C) Flow cytometric analysis of human CD34+CD38− cells during culture on bone marrow stroma infected with an empty vector (Stroma + empty vector) or bone marrow stroma infected with a vector containing shRNA targeting CYP26B1 (Stroma + CYP26 shRNA). Compared with empty vector, shRNA-containing lentivirus knocked down CYP26B1 mRNA levels by approximately 40%. The data are representative of three experiments with similar results. Numbers between the brackets represent absolute number of cells cultured for this experiment. (D) Percentage of human engraftment in the bone marrow of individual NSG mice, after transplantation of 2,000 CD34+CD38− cells or their output after culture on primary human bone marrow stroma for 21 d in the presence or absence of CYP26 inhibitor R115866. Black diamonds represent individual mice and line/number represents average. The SRC frequency per cultured CD34+CD38− equivalents was 1:1,471 in cultures without CYP inhibitor and <1:21,484 with CYP26 inhibitor, P = 0.01.
Discussion
The high expression of ALDH1 by CD34+CD38− cells suggests an important role for RA signaling in these cells. Moreover, we found these cells also highly express RARα. However, the role of RA signaling in normal hematopoiesis remains unclear with data showing that both RAR stimulation (8) and blockade (9) can produce self-renewal of primitive hematopoietic cells. The reasons for such apparently conflicting results, most of which are derived from mouse studies, is uncertain but perhaps could be explained by RA’s pleiotropic effects on different hematopoietic progenitors and RAR subtypes. Our data showing that downstream RAR signaling is down-regulated in CD34+CD38− cells compared with the more differentiated CD34+CD38+ cells is consistent with the data that RAR blockade maintains primitive hematopoietic cells. Moreover, we found that the pan-RAR inhibitor AGN promoted expansion of primitive hematopoietic CD34+CD38− cells, including CAFCW8s and SRCs.
AGN-mediated inhibition of RAR signaling also can determine germ-cell fate in vitro, mimicking the physiologic process that is regulated by the degradation of RA by embryonic Sertoli cell CYP26B1 (11). Thus, we hypothesized that CYP26-mediated lowering of retinoid levels might also be an important physiologic mechanism for determining HSC fate. Similar to its role in embryonic gonadal Sertoli cells (11), we found that CYP26 in bone marrow stromal cells inactivated retinoids present in serum-containing media; RAR signaling was reduced in a similar fashion to that observed with AGN or a dominant negative RAR, resulting in primitive hematopoietic cell maintenance and even expansion. Our data suggest that human HSCs are intrinsically programmed to undergo differentiation in response to RA, in part as a result of constitutive expression of early components of RA signaling pathway: ALDH1A1, which generates RA from vitamin A, and RARα. While in the bone marrow niche, HSCs are specifically prevented from undergoing differentiation by the microenvironment’s expression of CYP26 that maintains an environment low in retinoids (Fig. 5). Both the A1 and B1 CYP26 isoenzymes are highly expressed by the bone marrow stroma, whereas CD34+CD38+ cells express little or no A1 and B1 (Fig. 3B). Moreover, CYP26 inhibition in the absence of stroma had no effect on the maintenance of CD34+CD38− cells. It is likely that both the A1 and B1 CYP26 isoenzymes play a role in the microenvironment’s regulation of retinoids, because both isoenzymes are qualitatively similar retinoid hydroxylases with overlapping expression profiles (4).
Fig. 5.

Working model of retinoid signaling in the stem-cell niche. Retinoids are present in plasma at nanomolar (RA) to micromolar (vitamin A) concentrations (28). CYP26 enzymes present in the bone marrow stroma oxidize both RA and vitamin A to their inactive 4-oxo-congeners. Accordingly, the stem-cell niche represents a retinoid-low “sanctuary” that promotes HSC quiescence, maintenance, and self-renewal. Copyright and permission, Tim Phelps, Department of Art as Applied to Medicine, Johns Hopkins University, 2013.
Here we studied adherent stromal layers that optimally maintain primitive hematopoietic cell activity in vitro (25, 26). OP-9 cells have been shown to be mesenchymal stem cells capable of differentiation into a wide range of differentiated mesenchymal cells including fibroblasts, osteocytes, and adipocytes (26). Primary human bone marrow stroma has also been shown to be nearly a homogeneous population of mesenchymal progenitor cells (30). However, unlike adherent stromal cultures and male gonads where Sertoli cells are the main constituent of the microenvironment, the adult bone marrow niche is a rather complex milieu (12). Interestingly, major components of the bone marrow microenvironment, osteoblasts (31) and endothelial cells (32), also have been shown to express CYP26.
The process of physiological HSC self-renewal remains incompletely understood despite intense investigation. HoxB4 (14), Bmi1 (33), Wnt/β-catenin (16), Notch (34), and aryl hydrocarbon receptor antagonists (15) have all been shown to promote expansion of primitive mouse or umbilical cord blood hematopoietic cells. However, attempts at clinical translation produced expansion of differentiated umbilical cord blood hematopoietic progenitors in vitro, but HSC activity was lost (34). Moreover, there are few reports of successfully expanding adult human bone marrow-derived HSCs (13). Not only does it appear that the microenvironment’s control of RA availability regulates physiologic HSC fate, but these data also suggest that inhibition of RA signaling may be a potential therapeutic tool for human HSC expansion ex vivo. This report suggests that cytochrome P450 enzymes play a role in the bone marrow microenvironment. It is tempting to hypothesize that expression of various detoxifying enzymes is a general mechanism by which the bone marrow microenvironment protects normal, and probably malignant, HSCs not only from prodifferentiation signals, but also cytotoxic insults.
Materials and Methods
Human Samples.
Bone marrow was procured as excess material from the harvests of normal donors for allogeneic bone marrow transplantation. Specimens were collected by the Johns Hopkins Kimmel Cancer Center Specimen Accessioning Core. Appropriate informed consent was obtained from all donors before specimen collection, in accordance with the Declaration of Helsinki and under a research protocol approved by the Johns Hopkins Institutional Review Board.
Cell Isolation and Sorting.
Cell subsets were identified and isolated as we described (35). Briefly, mononuclear cells were isolated by density gradient centrifugation (Ficoll-Paque; GE Healthcare Life Sciences), and CD34-positive cells were then selected via magnetic beads and column by using manufacturer’s instructions (Miltenyi Biotec). Samples were then viably cryopreserved in 90% (vol/vol) FBS (Sigma) and 10% (vol/vol) dimethyl sulfoxide (DMSO) (Sigma) and stored until further use. After thawing and washing, cells were labeled with monoclonal fluorescein isothiocyanate (FITC)-conjugated anti-CD34 and allophycocyanin (APC)-conjugated anti-CD38 (all antibodies used are from BD Biosciences), and sorted by using a fluorescence-activated cell sorter (FACS) Aria II (Beckman Coulter).
Liquid Cultures.
Sorted CD34+CD38− cells were resuspended in Stemline II media (Sigma), supplemented with Penicillin/Streptomycin (P/S; Sigma), and growth factors [thrombopoietin 20 ng/mL, Stem Cell Factor 100 ng/mL, and Flt3 ligand 100 ng/mL (TSF) (all growth factors and cytokines are from Amgen)], and incubated at 37 °C. For some of the cultures, 10−6 M AGN194310 (23) (synthesized in house by the Johns Hopkins Chemistry Core) and 10−7 M all-trans RA (Sigma) were added. The cultures were sampled at various time points for cell counts, flow cytometry, CFU-C, CAFC, and transplantation assays.
Stromal Cells.
Stromal cell lines were cultured according to published protocols or as recommended by the American Type Culture Collection catalog. AFT024 were cultured in DMEM (Sigma) supplemented with 10% FBS and P/S at 33 °C, and OP-9 were cultured in α minimum essential medium (αMEM; Sigma), 20% FBS, and P/S at 37 °C. Primary human bone marrow stroma were derived from the plastic-adherent fraction of monocuclear bone marrow cells upon incubation with Iscove’s Modified Dulbecco’s Media (IMDM; Sigma) supplemented with 10% horse serum, 10% FBS, 10−5 M hydrocortisone 21-hemisuccinate, P/S, 10−4 M β-mercaptoethanol at 33 °C. Stromal cells were cultured until a confluent monolayer was obtained. At that time, sorted CD34+CD38− cells were plated on top of the stromal layer by using IMDM supplemented with 20% horse serum (Sigma), 10−5 M hydrocortisone 21-hemisuccinate (Sigma), P/S, 10−4 M β-mercaptoethanol (Sigma), IL-3 (10 ng/mL), and granulocyte colony stimulating factor (G-CSF) (20 ng/mL) as described (18). The stromal cocultures were incubated at 33 °C with or without 10−6 M R115866, a CYP26 inhibitor (29) (generously supplied by Johnson and Johnson R&D). Half of the media was replaced weekly, with cells harvested for analysis. For quantitative real-time reverse transcription PCR (RT-PCR) analysis, the adherent stromal layer was removed by using 0.05% Trypsin-EDTA (Sigma) followed by washing once with PBS.
CFU-C Assays.
Progenitor assays in methylcellulose were performed as we have described (36). Briefly, 2,000 CD34+CD38− or their progeny were resuspended in 1.32% (vol/vol) methylcellulose (Sigma) containing 30% (vol/vol) FBS, 1% (vol/vol) BSA (Sigma), 10% (vol/vol) phytohemagglutinin-stimulated lymphocyte-conditioned media, and 10−4 M 2-mercaptoethanol. Cells were plated in triplicate, incubated at 37 °C, and scored for presence of hematopoietic colonies 14 d later.
CAFC Assays.
CAFC assays were performed as we have described (37). Briefly, single-cell suspensions of AFT024 stromal cells were irradiated with 20 Gy by using a 137Cs irradiator (Mark-I-68; JL Shepherd and Associates), and 2 × 10⁴ cells were plated in a flat-bottom tissue culture-treated 96-well plate (BD Biosciences). Two days later, single-cell suspensions of approximately 500 CD34+CD38− hematopoietic cells or their progeny were overlaid on this stroma layer in twofold dilutions, 15 replicates per dilution to allow limiting dilution analysis. The culture media was refreshed weekly by replacing half of media with fresh media. CAFCs were scored at indicated time points through week 8. Wells were scored positive if at least one phase-dark hematopoietic clone (cobblestone, containing five or more cells) was observed. The frequency of CAFCs was then calculated by using Poisson statistics and L-Calc software (Stemcell Technologies) as described (38).
NSG Mouse Transplantation.
To calculate the number of SRCs, hematopoietic cells were transplanted in limiting dilution (for doses, see Table S2) into sublethally irradiated NSG mice as we described (35). Human hematopoiesis was analyzed in the bone marrow of recipient mice 18–20 wk after transplant. The harvested mouse bone marrow was treated with RBC lysis buffer (Sigma) and labeled with human CD45-APC and mouse CD45-FITC. The level of human engraftment was determined by the ratio between human-CD45+ cells and total (mouse and human) CD45+ cells. For statistical analysis of SRCs, animals having more than 0.1% human hematopoiesis were considered positive for human engraftment. One-tenth of femur bone marrow cellularity from primary recipient animals that showed positive human engraftment was injected into sublethally conditioned secondary NSG recipients via tail vain injection. The frequency of SRCs was calculated by using Poisson statistics. All mouse research was performed under a protocol approved by the Johns Hopkins Animal Care and Use Committee and complied with National Institutes of Health and American Veterinary Medical Association guidelines.
Microarray Analysis and Visualization of RA Target Gene Expression.
Whole transcriptome data were obtained on RNA isolated from normal bone marrow CD34+CD38− and matched CD34+CD38+ cell populations and analyzed with Human Exon 1.0 ST whole-genome microarrays (Affymetrix) (39). The obtained data represented the average of normalized, log2 transformed, robust multiarray analysis background corrected measures from all core metaprobe sets for each gene. The Ingenuity Pathway Analysis (IPA) Upstream Regulator module was used to identify which IPA upstream regulator pathways were activated or inactivated, as measured by the activation Z score (Ingenuity Systems). The corresponding one-sided P value for this Z score was calculated by assuming a normal distribution. The list of all known canonical RARA target genes and their predicted direction of regulation (activated, inactivated, or unknown) by RARA was obtained from the IPA software. For each gene, the row-standardized Z score for each sample was calculated, and these normalized expression measures were subjected to Euclidean distance based hierarchical clustering and visualization by heatmap using the Partek Genomic Suite software.
Quantitative RT-PCR.
RNA was extracted with the RNeasy kit (Qiagen) per manufacturer's instructions. Expression of CYP26 isoenzymes was assessed by real-time, one-step RT-PCR using sequence-specific primers (mouse CYP26A1: forward: acccacatgtcctccagaaa and reverse: agctgttccaaagtttccatgt; mouse CYP26B1: forward: caattccattggcgacatc and reverse: atcctggatcaccagttgga; mouse CYP26C1 forward: acttggcgcggttggt and reverse: agaggagcggctgaacac; mouse GAPDH: forward: cgtcccgtagacaaaatggt and reverse: ttgatggcaacaatctccac; human CYP26A1: forward: catgttctccagaaagtgcg and reverse: gggattcagtcgaagggtct; human CYP26B1: forward: gagcacctcgtgagc and reverse: aggtaactctccagggcctc; human CYP26C1: forward: cgtgtcccggatgctatac and reverse: ctgcgtggtcaaggaggt; and human GAPDH: forward: acccagaagactgtggatgg and reverse: tctagacggcaggtcaggtc) and a SYBR Green method (Bio-Rad). Gene expression was normalized to GAPDH mRNA. Relative quantification of mRNA levels was performed by using the 2-ΔΔC(T) method (40). All RT-PCRs were performed in duplicate and run on the ABI 7500 machine (Applied Biosystems).
RA Responsive Firefly Luciferase Assay.
To assess relative levels of RA activity, a pGL2-RA responsive element (RARE)-luciferase was used as described (27). The pGL2-RARE-luciferase and a Renilla plasmid was transfected into HEK293T cells by using Lipofectamine 2000 (Invitrogen) and the manufacturer’s protocol. Upon transfection, HEK293T cells were incubated with either fresh media [RPMI 1640 + 10% (vol/vol) FBS] with or without AGN or with stromal cell conditioned media. One day later, dual luciferase assay (firefly and Renilla) was performed per manufacturer’s protocols (Promega) and relative luciferase activity normalized to Renilla was used to assess RA activity.
Lentiviral Vectors and shRNA Clones.
shRNA-targeting CYP26B1 (Thermo Scientific) lentiviral vectors or the empty lentiviral vector pGIPZ were used to infect bone marrow stromal cells. Successfully infected cells were then sorted for GFP and used for further analysis.
Statistical Analysis.
Statistical analysis was performed by using two-tail unpaired student t test to compare the averages of two groups and calculate the P value.
Supplementary Material
Acknowledgments
We thank Dr. Saraswati Sukumar and Nguyen Nguyen for kindly providing us with the retinoic acid responsive luciferase reporter plasmid. This work was supported by the following funding entities: National Heart, Lung, and Blood Institute Grant 5T32HL007525-27, American Society of Hematology Research Fellow Award and Maryland Stem Cell Research Award (to G.G.), Maryland Stem Cell Research Award (to J.M.G. and S.Y.), and National Institutes of Health Grants P01 CA15396-26 and CA70790-12 (to R.J.J.).
Footnotes
The authors declare no conflict of interest.
*This Direct Submission article had a prearranged editor.
This article contains supporting information online at www.pnas.org/lookup/suppl/doi:10.1073/pnas.1305937110/-/DCSupplemental.
References
- 1.Jones RJ, et al. Characterization of mouse lymphohematopoietic stem cells lacking spleen colony-forming activity. Blood. 1996;88(2):487–491. [PubMed] [Google Scholar]
- 2.Balber AE. Concise review: Aldehyde dehydrogenase bright stem and progenitor cell populations from normal tissues: Characteristics, activities, and emerging uses in regenerative medicine. Stem Cells. 2011;29(4):570–575. doi: 10.1002/stem.613. [DOI] [PubMed] [Google Scholar]
- 3.Duester G. Families of retinoid dehydrogenases regulating vitamin A function: Production of visual pigment and retinoic acid. Eur J Biochem. 2000;267(14):4315–4324. doi: 10.1046/j.1432-1327.2000.01497.x. [DOI] [PubMed] [Google Scholar]
- 4.Topletz AR, et al. Comparison of the function and expression of CYP26A1 and CYP26B1, the two retinoic acid hydroxylases. Biochem Pharmacol. 2012;83(1):149–163. doi: 10.1016/j.bcp.2011.10.007. [DOI] [PMC free article] [PubMed] [Google Scholar]
- 5.Clagett-Dame M, Knutson D. Vitamin A in reproduction and development. Nutrients. 2011;3(4):385–428. doi: 10.3390/nu3040385. [DOI] [PMC free article] [PubMed] [Google Scholar]
- 6.Purton LE, Bernstein ID, Collins SJ. All-trans retinoic acid delays the differentiation of primitive hematopoietic precursors (lin-c-kit+Sca-1(+)) while enhancing the terminal maturation of committed granulocyte/monocyte progenitors. Blood. 1999;94(2):483–495. [PubMed] [Google Scholar]
- 7.Tallman MS, et al. All-trans-retinoic acid in acute promyelocytic leukemia. N Engl J Med. 1997;337(15):1021–1028. doi: 10.1056/NEJM199710093371501. [DOI] [PubMed] [Google Scholar]
- 8.Purton LE, Bernstein ID, Collins SJ. All-trans retinoic acid enhances the long-term repopulating activity of cultured hematopoietic stem cells. Blood. 2000;95(2):470–477. [PubMed] [Google Scholar]
- 9.Tsai S, Bartelmez S, Sitnicka E, Collins S. Lymphohematopoietic progenitors immortalized by a retroviral vector harboring a dominant-negative retinoic acid receptor can recapitulate lymphoid, myeloid, and erythroid development. Genes Dev. 1994;8(23):2831–2841. doi: 10.1101/gad.8.23.2831. [DOI] [PubMed] [Google Scholar]
- 10.Chute JP, et al. Inhibition of aldehyde dehydrogenase and retinoid signaling induces the expansion of human hematopoietic stem cells. Proc Natl Acad Sci USA. 2006;103(31):11707–11712. doi: 10.1073/pnas.0603806103. [DOI] [PMC free article] [PubMed] [Google Scholar]
- 11.Bowles J, et al. Retinoid signaling determines germ cell fate in mice. Science. 2006;312(5773):596–600. doi: 10.1126/science.1125691. [DOI] [PubMed] [Google Scholar]
- 12.Raaijmakers MH, Scadden DT. Evolving concepts on the microenvironmental niche for hematopoietic stem cells. Curr Opin Hematol. 2008;15(4):301–306. doi: 10.1097/MOH.0b013e328303e14c. [DOI] [PubMed] [Google Scholar]
- 13.Blank U, Karlsson G, Karlsson S. Signaling pathways governing stem-cell fate. Blood. 2008;111(2):492–503. doi: 10.1182/blood-2007-07-075168. [DOI] [PubMed] [Google Scholar]
- 14.Amsellem S, et al. Ex vivo expansion of human hematopoietic stem cells by direct delivery of the HOXB4 homeoprotein. Nat Med. 2003;9(11):1423–1427. doi: 10.1038/nm953. [DOI] [PubMed] [Google Scholar]
- 15.Boitano AE, et al. Aryl hydrocarbon receptor antagonists promote the expansion of human hematopoietic stem cells. Science. 2010;329(5997):1345–1348. doi: 10.1126/science.1191536. [DOI] [PMC free article] [PubMed] [Google Scholar]
- 16.Perry JM, et al. Cooperation between both Wnt/beta-catenin and PTEN/PI3K/Akt signaling promotes primitive hematopoietic stem cell self-renewal and expansion. Genes Dev. 2011;25(18):1928–1942. doi: 10.1101/gad.17421911. [DOI] [PMC free article] [PubMed] [Google Scholar]
- 17.Cicuttini FM, Welch K, Boyd AW. Characterization of CD34+HLA-DR-CD38+ and CD34+HLA-DR-CD38- progenitor cells from human umbilical cord blood. Growth Factors. 1994;10(2):127–134. doi: 10.3109/08977199409010986. [DOI] [PubMed] [Google Scholar]
- 18.Breems DA, Blokland EA, Neben S, Ploemacher RE. Frequency analysis of human primitive haematopoietic stem cell subsets using a cobblestone area forming cell assay. Leukemia. 1994;8(7):1095–1104. [PubMed] [Google Scholar]
- 19.Bhatia M, Wang JC, Kapp U, Bonnet D, Dick JE. Purification of primitive human hematopoietic cells capable of repopulating immune-deficient mice. Proc Natl Acad Sci USA. 1997;94(10):5320–5325. doi: 10.1073/pnas.94.10.5320. [DOI] [PMC free article] [PubMed] [Google Scholar]
- 20.Hao QL, Shah AJ, Thiemann FT, Smogorzewska EM, Crooks GM. A functional comparison of CD34 + CD38- cells in cord blood and bone marrow. Blood. 1995;86(10):3745–3753. [PubMed] [Google Scholar]
- 21.Terstappen LW, Huang S, Safford M, Lansdorp PM, Loken MR. Sequential generations of hematopoietic colonies derived from single nonlineage-committed CD34+CD38- progenitor cells. Blood. 1991;77(6):1218–1227. [PubMed] [Google Scholar]
- 22.Dahlberg A, Delaney C, Bernstein ID. Ex vivo expansion of human hematopoietic stem and progenitor cells. Blood. 2011;117(23):6083–6090. doi: 10.1182/blood-2011-01-283606. [DOI] [PMC free article] [PubMed] [Google Scholar]
- 23.Johnson AT, Wang L, Standeven AM, Escobar M, Chandraratna RA. Synthesis and biological activity of high-affinity retinoic acid receptor antagonists. Bioorg Med Chem. 1999;7(7):1321–1338. doi: 10.1016/s0968-0896(99)00055-3. [DOI] [PubMed] [Google Scholar]
- 24.McDermott SP, Eppert K, Lechman ER, Doedens M, Dick JE. Comparison of human cord blood engraftment between immunocompromised mouse strains. Blood. 2010;116(2):193–200. doi: 10.1182/blood-2010-02-271841. [DOI] [PubMed] [Google Scholar]
- 25.Moore KA, Ema H, Lemischka IR. In vitro maintenance of highly purified, transplantable hematopoietic stem cells. Blood. 1997;89(12):4337–4347. [PubMed] [Google Scholar]
- 26.Gao J, et al. Characterization of OP9 as authentic mesenchymal stem cell line. J Genet Genomics. 2010;37(7):475–482. doi: 10.1016/S1673-8527(09)60067-9. [DOI] [PubMed] [Google Scholar]
- 27.Chen H, et al. HOXA5 acts directly downstream of retinoic acid receptor beta and contributes to retinoic acid-induced apoptosis and growth inhibition. Cancer Res. 2007;67(17):8007–8013. doi: 10.1158/0008-5472.CAN-07-1405. [DOI] [PubMed] [Google Scholar]
- 28.Eckhoff C, Collins MD, Nau H. Human plasma all-trans-, 13-cis- and 13-cis-4-oxoretinoic acid profiles during subchronic vitamin A supplementation: Comparison to retinol and retinyl ester plasma levels. J Nutr. 1991;121(7):1016–1025. doi: 10.1093/jn/121.7.1016. [DOI] [PubMed] [Google Scholar]
- 29.Stoppie P, et al. R115866 inhibits all-trans-retinoic acid metabolism and exerts retinoidal effects in rodents. J Pharmacol Exp Ther. 2000;293(1):304–312. [PubMed] [Google Scholar]
- 30.Seshi B, Kumar S, Sellers D. Human bone marrow stromal cell: Coexpression of markers specific for multiple mesenchymal cell lineages. Blood Cells Mol Dis. 2000;26(3):234–246. doi: 10.1006/bcmd.2000.0301. [DOI] [PubMed] [Google Scholar]
- 31.Spoorendonk KM, et al. Retinoic acid and Cyp26b1 are critical regulators of osteogenesis in the axial skeleton. Development. 2008;135(22):3765–3774. doi: 10.1242/dev.024034. [DOI] [PubMed] [Google Scholar]
- 32.Elmabsout AA, et al. Cloning and functional studies of a splice variant of CYP26B1 expressed in vascular cells. PLoS ONE. 2012;7(5):e36839. doi: 10.1371/journal.pone.0036839. [DOI] [PMC free article] [PubMed] [Google Scholar]
- 33.Iwama A, et al. Enhanced self-renewal of hematopoietic stem cells mediated by the polycomb gene product Bmi-1. Immunity. 2004;21(6):843–851. doi: 10.1016/j.immuni.2004.11.004. [DOI] [PubMed] [Google Scholar]
- 34.Delaney C, et al. Notch-mediated expansion of human cord blood progenitor cells capable of rapid myeloid reconstitution. Nat Med. 2010;16(2):232–236. doi: 10.1038/nm.2080. [DOI] [PMC free article] [PubMed] [Google Scholar]
- 35.Gerber JM, et al. Characterization of chronic myeloid leukemia stem cells. Am J Hematol. 2011;86(1):31–37. doi: 10.1002/ajh.21915. [DOI] [PMC free article] [PubMed] [Google Scholar]
- 36.Miller CB, Zehnbauer BA, Piantadosi S, Rowley SD, Jones RJ. Correlation of occult clonogenic leukemia drug sensitivity with relapse after autologous bone marrow transplantation. Blood. 1991;78(4):1125–1131. [PubMed] [Google Scholar]
- 37.Ghiaur G, et al. Rac1 is essential for intraembryonic hematopoiesis and for the initial seeding of fetal liver with definitive hematopoietic progenitor cells. Blood. 2008;111(7):3313–3321. doi: 10.1182/blood-2007-08-110114. [DOI] [PMC free article] [PubMed] [Google Scholar]
- 38.Ploemacher RE, van der Sluijs JP, van Beurden CA, Baert MR, Chan PL. Use of limiting-dilution type long-term marrow cultures in frequency analysis of marrow-repopulating and spleen colony-forming hematopoietic stem cells in the mouse. Blood. 1991;78(10):2527–2533. [PubMed] [Google Scholar]
- 39.Gerber JM, et al. Genome-wide comparison of the transcriptomes of highly enriched normal and chronic myeloid leukemia stem and progenitor cell populations. Oncotarget. 2013;4(5):715–728. doi: 10.18632/oncotarget.990. [DOI] [PMC free article] [PubMed] [Google Scholar]
- 40.Livak KJ, Schmittgen TD. Analysis of relative gene expression data using real-time quantitative PCR and the 2(-Δ Δ C(T)) Method. Methods. 2001;25(4):402–408. doi: 10.1006/meth.2001.1262. [DOI] [PubMed] [Google Scholar]
Associated Data
This section collects any data citations, data availability statements, or supplementary materials included in this article.