

Significance
Small animals such as Drosophila provide an opportunity to understand the neural circuitry for complex behaviors from sensory input to motor output without gaps. Here, we define the algorithms for Drosophila larva phototaxis (i.e., the maps between sensory input and motor output) by quantifying the movements of individual animals responding to a battery of illumination conditions. Surprisingly, the distinct rules that define different components of the overall photosensory response begin to segregate at the first synapses after the photoreceptor cells. These results lay the foundation for mapping the circuits for phototaxis in the compact nervous system of the larva by first elucidating the algorithms that define behavior and then mapping these algorithms to specific circuit pathways.
Abstract
The avoidance of light by fly larvae is a classic paradigm for sensorimotor behavior. Here, we use behavioral assays and video microscopy to quantify the sensorimotor structure of phototaxis using the Drosophila larva. Larval locomotion is composed of sequences of runs (periods of forward movement) that are interrupted by abrupt turns, during which the larva pauses and sweeps its head back and forth, probing local light information to determine the direction of the successive run. All phototactic responses are mediated by the same set of sensorimotor transformations that require temporal processing of sensory inputs. Through functional imaging and genetic inactivation of specific neurons downstream of the sensory periphery, we have begun to map these sensorimotor circuits into the larval central brain. We find that specific sensorimotor pathways that govern distinct light-evoked responses begin to segregate at the first relay after the photosensory neurons.
Navigating organisms must extract spatial information about their surroundings to orient and move toward preferred environments. Phototaxis of fly larvae has long been a paradigm for understanding the mechanisms of animal orientation behavior (1). The study of phototaxis in the Drosophila larva provides an opportunity to investigate the circuits for orientation behavior from sensory input to motor output in a small nervous system. First, however, the sensorimotor structure of responses to illumination must be defined by studying larval behavior in controlled environments.
The tropism theory of Jacques Loeb states that bilateral body plans allow animals to extract spatial information through the sensation of external forces acting asymmetrically on symmetric body halves. The navigation of fly larvae away from incident light rays was interpreted as a direct demonstration of tropism. However, temporal comparisons performed by moving animals, also known as klinotaxis, also can encode spatial information (2). Like most fly larvae, Drosophila larvae are negatively phototactic during most of their development (3–9). To navigate away from light, the Drosophila larva uses two sets of photosensors, the Rhodopsin-expressing Bolwig's organs (BO) that mediate phototaxis at low light levels and the non–Rhodopsin-expressing class IV multidendritic (md) neurons that respond to intense light levels comparable to direct sunlight (10). Here, we sought to resolve the sensorimotor structure of larval phototaxis to understand how these photosensitive structures extract and use information about ambient light conditions to control motor behavior.
We developed a tracking assay and illumination system that allowed us to quantify the movements of individual animals in defined spatiotemporal illumination patterns at both low and high light intensities. We uncovered a set of sensorimotor relationships that allow the larva to navigate away from light based on temporal processing of sensory inputs. Even the capacity to navigate away from directed illumination is mediated by temporal processing of sensory input resulting from structural specializations of the BO. The BO is directionally sensitive because it sits in an eye cup formed by the pharyngeal sclerites, and temporal processing of input coupled to head movements allow the larva to discern the actual direction of incoming light. Furthermore, we found that the fifth lateral neuron (LN) encodes several components of the photosensory response and is essential for one particular photosensory response, dark-induced pausing, that was observed in our analysis. Calcium imaging reveals the sensitivity of the fifth LN to temporal changes in photosensory input. In the visual system of the Drosophila larva, sensorimotor pathways that are required for specific components of the overall phototactic response begin to segregate at the first relay after photosensory input.
Results
To identify the relevant properties of an orienting light stimulus and the sensorimotor patterns of light avoidance mediated by the BO and the md neurons, we developed a behavioral assay capable of delivering arbitrary spatiotemporal light stimuli to groups of larvae while recording their responsive movements in detail (Fig. 1A). Larval navigation involves two stereotyped motor patterns: runs, which are periods of persistent forward movement, and turns, reorientation events in which the larva pauses and sweeps its head from side to side (Fig. 1B) (11–14). Turns can involve one or more head-sweeps. A larva can accept a head-sweep by initiating a new run in the direction of its head during the head-sweep or reject the head-sweep by swinging its head back and initiating another head-sweep (Fig. 1B). Here, we sought to determine how photosensory input is converted by the larva’s photosensory organs and sensorimotor circuits to purposeful navigation.
Fig. 1.

Phototaxis apparatus and automated machine vision larval postural analysis. (A) Schematic of phototaxis assay generating a checkerboard lightscape. A digital projector generates arbitrary spatiotemporal light stimuli. Larvae are placed on a 25-cm dish coated in agar, and their resulting behavior is visualized by infrared LEDs and recorded with a camera. (B) Machine vision software segments the larval tracks into runs and turns. Turns are composed of accepted and/or rejected head-sweeps.
Checkerboard Illumination Pattern.
First, we studied the larva's ability to navigate a spatial illumination gradient by examining the detailed movements of wild-type Canton-S larvae (hereafter wCs) on a high-contrast checkerboard illumination pattern (Movies S1 and S2) (5, 15) at light intensities that require the BO for navigation. We found that larvae initiate turns with greater frequency when crossing from dark to light squares (0°) than when crossing from light to dark (180°) or within the interior of a square (Fig. 2A). On the boundary between squares, the probability of initiating a turn was a smoothly varying function of heading relative to the boundaries between checkerboard squares (Fig. 2B). Thus, larvae increase their dwell time within dark squares by preferentially turning when pointed in the unfavorable direction at each checkerboard boundary.
Fig. 2.

Larvae bias the frequency, size, and direction of turns to remain in the dark. n = number experiments (number larvae). For definitions of light intensities see Figs. S1 and S2. (A) Schematic of heading angles relative to boundary. Turning rate vs. distance of head from the boundary for −180° and 0° headings; dashed lines indicate boundary region. (B–F) Turns initiated when the head was in the boundary. (B) Turning rate vs. heading relative to boundary. (C) Turn size (rms degrees) vs. heading relative to boundary. (D) (Center) Schematic of heading angles diagonal to checker boundary. (Left and Right) Polar histograms of heading changes achieved by turns for a fixed initial run heading before turn. The initial heading is indicated by an arrow. (E) Mean heading change achieved by turns vs. initial heading relative to the boundary. (F) Probability of first head-sweep (h.s.) direction and acceptance to left (L) and right (R). Numbers indicate total head-sweeps. **Rejection of null hypothesis that probabilities are the same at P < 0.0001, binomial statistics.
In addition to modulating the frequency of turning, larvae biased the size of turns as a function of heading relative to the boundary: The more directly the larva was headed toward a light square, the larger was the subsequent turn (Fig. 2C). To determine if larvae also modulate turn direction to orient themselves preferentially toward the dark square during each boundary encounter, we examined heading changes achieved during turns on the boundary initiated from diagonal headings. Although larvae make turns of similar size toward light and dark squares, they executed far more turns toward dark squares than toward light squares (Fig. 2D), resulting in a net change toward the dark squares (Fig. 2E).
To examine if larvae directly sense spatial light gradients, perhaps by comparing the difference in light intensity between their BOs, we analyzed the statistics of the first head-sweep within diagonally pointed boundary-evoked turns. We found that the direction of the first head-sweep was unbiased (Fig. 2F), suggesting larvae are indifferent to the local light intensity gradient before initiation of a head-sweep. However, larvae were more likely to accept head-sweeps toward the dark squares (Fig. 2F). These results suggest that the larvae use head-sweeps as probes to explore their local luminosity environment. As the larva moves its head in a spatially varying light environment, it generates temporal changes in intensity at its photoreceptors (PRs) and uses these changes to determine whether to move in a given direction.
Square-Wave Temporal Illumination Pattern.
If the larva uses temporal comparisons of light intensity during runs and head-sweeps to detect and respond to spatial gradients in luminosity, then changing light intensity over time should recapitulate two components of navigational strategy: modulation of turn frequency (Fig. 2 A and B) and turn size (Fig. 2C). We presented larvae with a temporal analog of the checkerboard, a temporal square-wave light stimulus (8, 16) matched in intensity (low intensity, dark phase: <0.08 W/m2; light phase: 7−13 W/m2) (Fig. 3 A and B, Figs. S1 and S2, and Movies S3 and S4). Control wCS animals responded to the abrupt increase in light intensity by increasing the frequency and size of their turns, akin to their behavior at the checker boundary. Animals lacking Rhodopsin in both BO PR subtypes (rh52;rh61) did not modulate their turning rate or size (Fig. 3 A and B). Using rh52 and rh61 single mutants, we examined the distinct contribution of BO PR subtypes and observed that Rh5-expressing photoreceptors are specifically responsible for photosensory navigational responses at the tested intensities (Fig. 3A), in agreement with previous studies that showed that Rh61 is not required for light avoidance (17).
Fig. 3.
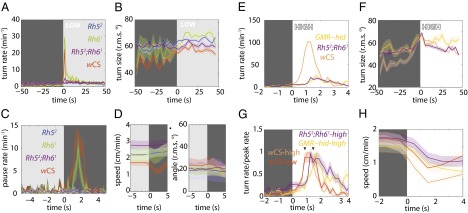
Larvae use temporal comparisons of light intensity to inform phototaxis. Shaded background represents light stimulus. Shaded areas around curves represent SEM. For definitions of light intensities, see Figs. S1 and S2. n = number experiments (number larvae). Low intensity: wCS: n = 4 (98); rh52: n = 4 (106); rh61: n = 2 (41); rh52;rh61: n = 4 (110). High intensity: wCS: n = 4 (107); GMR−hid: n = 4 (62); rh52;rh61: n = 5 (119). (A) Turn rate vs. time since light-on. (B) Turn size (rms degrees) vs. time since light-on. wCS: 2,890 turns; rh52: 2,569 turns; rh61: 927 turns; rh52;rh61: 3,258 turns. (C) Pausing rate vs. time since light-off. (D) Average speed and angle of body bend (rms degrees) vs. time since light-off. wCS: 1,299 pauses; rh52: 444 pauses; rh61: 217 pauses; rh52;rh61: 811 pauses. (E) Turn rate vs. time since light-on. (F) Turn size (rms degrees) vs. time since light-on. (G) Normalized turning rate vs. time since light-on. (H) Average speed vs. time since light-on. wCS: 3,100 turns; GMR−hid: 1,125 turns; rh52;rh61: 3,622 turns.
The temporal square-wave setup also revealed a distinct photosensory behavior: pausing in response to an abrupt decrease in light intensity (cessation of forward movement without initiation of head-sweeps) (Fig. 3 C and D and compare Movies S4 and S2). Dark-induced pausing also requires the Rh52 subset of BO PRs (Fig. 3 C and D). Dark-induced pausing might be an evasive predatory response: A looming predator might cast a shadow over a larva, which then would cease movement to avoid being detected.
Next, we analyzed phototactic strategy in high-intensity light regimes to test the contribution of non–BO-mediated photoreception. Photoresponses in BO-ablated larvae have been demonstrated to be mediated by the md neurons at intensities greater than ∼40 W/m2 (1, 18). At high light intensities (dark phase: <0.02 W/m2; light phase: 40–100 W/m2 of blue-green light) (Fig. S2), we found that larvae lacking both Rhodopsins (rh52;rh61) or functional BOs (GMR-hid) respond to the onset of illumination by increasing their turning rate and turn size. However, control larvae display a 10-fold higher turning rate in response to light onset than larvae without functioning BO (Fig. 3E) and a fourfold greater turning rate in the high intensity light than in the low-intensity light (Fig. 3A), suggesting that light-evoked turning is mediated primarily by the BOs even at high light intensities. A functioning BO also contributes to the modulation of turn size at high intensities (Fig. 3F).
We found that the BO-mediated photosensory response had faster kinetics than BO-independent responses. Quantifying the onset of turning revealed that at both high and low intensities animals lacking functional BOs display an ∼1 s delay to peak turning rate (Fig. 3 G and H) relative to animals with functional BOs. The BO-mediated turning response also extinguished more rapidly, returning to the baseline turning rate within ∼2 s after a step increase in illumination, whereas the BO-independent turning response extinguished after ∼4 s. Thus, the BOs mediate rapid photosensory response at all light intensities.
Linear Spatial Gradient Illumination Pattern.
To probe further the larva’s ability to sense environmental changes in light intensity, we studied navigation on a linear spatial gradient (Fig. 4A). To quantify larval navigation concisely, we computed a navigational index by dividing the mean velocity of all larvae in the x direction (vx) by the mean crawling speed (s) (2, 11). The navigational index is 1 if larvae are crawling uniformly from dark to light. The index is −1 if larvae are crawling uniformly from light to dark. If the movement is unbiased, the index is zero.
Fig. 4.

Larvae do not phototax on a shallow linear spatial gradient. (A) Irradiance map of the linear gradient lightscape. (B) Canton-S larvae navigational index, (v)/(s), computed for x and y directions on the linear gradient lightscape. n = 15 animals, 128 experiments. (C) (Left) Schematic of the linear gradient lightscape. Light is incident to plate at 90°. (Right) Probability of orientation vs. heading in runs for the linear gradient lightscape. The shaded area around the curve represents SEM. (D) Polar histograms of heading changes achieved by turns for a fixed initial run heading before turn. The arrow indicates the initial heading. (E) Probability of first head-sweep (h.s.) direction and head-sweep acceptance to left (L) and right (R) sorted by initial heading for linear gradient lightscape.
As a control, we also calculated the navigation perpendicular to the direction of light, the y-index (vy), which should be zero in all cases because of symmetry. Surprisingly, we found that larvae were unable to navigate on the linear spatial gradient setup (Fig. 4B); Larvae were equally likely to be headed in any direction (Fig. 4C). An examination of larval turns from orthogonal headings also showed no evidence of navigation: Larvae were equally likely to accept head-sweeps in the direction of higher or lower intensity (Fig. 4D), resulting in an equal frequency of turns in either direction (Fig. 4E).
Triangle-Wave Temporal Illumination Pattern.
Why did larvae fail to navigate a linear spatial gradient? In a checkerboard illumination pattern, larvae experienced a change in intensity of 100 W/m2 over a 2-mm boundary region (Fig. 2), but on the linear spatial gradient, they experienced a similar change over the entire 20-cm plate (Fig. 4). We speculated that larvae crawling on the linear gradient might experience only temporal changes in light intensity that were below the threshold needed to evoke a behavioral response. Because of the limits of the projector’s dynamic range, we could not increase the steepness of the gradient without significantly reducing the size of the experimental arena, so we turned to temporal gradients using triangle waveforms to mimic the stimulus received by larvae moving in straight lines on illumination patterns with a steeper linear spatial gradient. In our previous studies of spatial and temporal gradients of temperature (3–9, 14), odor, and carbon dioxide (10, 11), we found that temporal triangle waves evoked the same behavioral responses as linear spatial gradients.
Larvae reoriented more frequently and made larger turns during periods of linearly increasing light intensity in triangle waves with shorter periods (400 s or less) (Fig. 5 A–C) than during periods of decreasing intensity. These results are consistent with our observations on the checkerboard and temporal square-wave illumination patterns and are analogous to the response to triangle waves of sensory input when exposed to olfactory and thermosensory inputs (11–14). The magnitude of the increase in turn rate and size decreases as the linear temporal rate of changes decreases until the effect is mostly lost at a period of 800 s (Fig. 5D). The temporal change in light intensity experienced by a larva crawling directly up or down the linear spatial gradient setup (Fig. 4) is approximately half the rate experienced by a larva in the 800-s period triangle-wave setup, explaining why larvae were unable to navigate the spatial linear gradient.
Fig. 5.
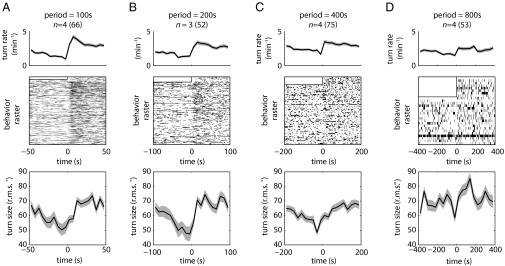
Temporal analogs of linear gradient lightscapes (triangle-wave lightscapes). Shaded areas around curves represent SEM. n = number experiments (number larvae). (A–D) Statistics of turning decisions for linear temporal gradients delivered as repeating cycles of periods equal to 100 s (A), 200 s (B), 400 s (C), and 800 s (D). (Top) Turning rate vs. time. (Middle) Raster plots represent periods in which an individual larva was turning. Each row represents one larva tracked continuously throughout the cycle. Half of the period of the first cycle was discarded to allow for acclimation. (Bottom) Mean turn size vs. time in cycle.
Directional Illumination Navigation.
Early 20th century experiments investigating blowfly larval phototaxis were conducted using sunlight as a stimulus, with its rays inclined relative to the experimental plane (1, 5, 15, 19, 20). These studies found that the direction of the stimulus was more important than its intensity: Larvae would travel toward areas of higher intensity as long as they were headed away from the source of light. We asked whether Drosophila larvae also might avoid a light source using directional cues. We projected light rays at 45° relative to the plate (Fig. 6A, Left and Movie S5) and discovered that wild-type larvae robustly navigated away from the light source (Fig. 6A, Right). Navigation to directional input could not be attributed to the small spatial luminosity gradient generated by the directional light cue, because larvae failed to navigate on a linear gradient illumination pattern that was 25 times steeper (Fig. 4). To facilitate comparisons between different genotypes and light intensities, we computed a navigational index for all tested strains (Fig. 6B). We found that wCS larvae are capable of direction-based avoidance across a 2,500-fold change in light intensity (0.04–100 W/m2, an ecologically relevant range) (Fig. 6B) (8, 16, 21–23). The BO is strictly required for this behavior at both low and high intensities. GMR−hid and rh52;rh61 larvae are unable to navigate away from incident light rays at intensities that are sufficient to evoke BO-independent turning in the temporal setup (Figs. 6B and 3 C and D). As with intensity-based phototaxis, Rh5 but not Rh6 neurons are required for direction-based phototaxis (Fig. 6B).
Fig. 6.
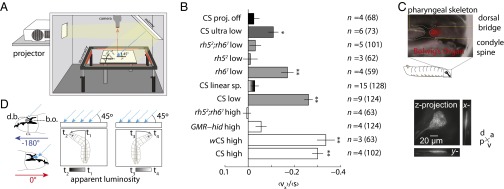
Directional lightscape navigation requires the Rh5 PRs of the BO. (A) Schematic of directional lightscape apparatus. Light rays are incident to larvae at 45°. (B) Navigational index (vx)/(s). Rejection of null hypothesis that dataset has same mean as projector-off dataset: *P < 0.01, **P < 0.0001, Welch two-tailed t test. For light intensities see Figs. S1 and S2. n = number experiments (number larvae). (C) The BO sits in a pigment cup formed by the cephalopharyngeal skeleton. (Upper) Fluorescence microscopy of GMR−RFP merged with bright-field microscopy. The white dotted line indicates the cephalopharyngeal skeleton. (Lower) Maximum intensity projections from 3D confocal microscopy of the BO in longGMR > CD8:: GFP larva. (D) Schematic of differential view angle of the BO conferred by cephalopharyngeal skeleton.
To determine the cellular mechanism for direction-based phototaxis, we examined the morphology and surrounding cephalopharyngeal skeleton of the BO by confocal microscopy. BO PRs are located in a thin pocket formed by the condyle spine and dorsal bridge of the cephalopharyngeal skeleton. The BO sends a single nerve, Bolwig’s nerve, posteriorly around the medial region of the pharyngeal skeleton. We found that the BO is shaped like a thin cone, oriented primarily along the dorso-ventral axis, appearing as a small slit when viewed from the top (Fig. 6C and Movie S6). We hypothesize that the opaque cephalopharyngeal skeleton restricts the accessibility of incident light onto the BO, effectively forming a pigment cup eye (17, 24), as has been proposed in Calliphora larvae (25). When an animal is crawling with a 180° heading or a 0° heading relative to the incidence of light, it experiences a relative minimum or maximum of apparent luminosity, respectively (Fig. 6D). As the animal rotates its head during a head-sweep, it experiences a temporal change in relative luminosity throughout the head-sweep, converting the spatially uniform stimulus into a signal with temporally varying intensity that is dependent on head rotation (Fig. 6D). For instance, a larva oriented at 90° would experience an apparent decrease in light intensity over time as it sweeps its head left and an apparent increase in light intensity over time as it sweeps its head right (Fig. 6D).
If information acquisition during phototaxis to directional illumination is achieved through temporal comparison of apparent luminosities during head-sweeps, the bulk of the navigational strategy should be contained within turning decisions. To test this hypothesis, we quantified the navigational movements of wild-type animals to directional illumination. With directional illumination, a larva is more likely to be oriented away from the light source (−180° heading) (Fig. 7A), but we found that this orientation bias is not achieved by modulating turn rate as a function of heading (Fig. 7 B and D) or by steering within runs (Fig. 7 C and G). An examination of heading changes resulting from turns pinpointed the origin of the orientation bias: Larvae oriented orthogonally to light rays from directional illumination are more likely to turn toward the preferred heading, left for +90° or right for −90° (Fig. 7 E and H). Additionally, we found that larvae make larger turns when previously pointed toward rather than away from the incident light rays (Fig. 7F). The first head-sweep direction is unbiased for all initial headings, but larvae are more likely to accept head-sweeps toward the preferred direction from orthogonal headings (Fig. 7I). Thus, larvae use head-sweeps to probe the direction of incident light rays, identifying the preferred direction of movement based on a temporal drop in apparent luminosity.
Fig. 7.

Directional lightscape navigational strategy. (Top) Schematic of headings on the directional lightscape. (A) Probability of heading during runs. (B) Turn rate vs. heading in run. (C) Mean heading change achieved in run vs. heading in initial run. (D) Distribution of run lengths for larval headings into incident light rays (red, 0°, nonpreferred heading) and away from incident light rays (blue, 180°, preferred heading). (E) Mean heading change during turn vs. previous run heading. Dashed and dotted lines are the prediction and 95% confidence interval of a model with biases in turn magnitude and head-swing acceptance (11). (F) Heading change size (rms degrees) vs. initial heading (in degrees). Dashed and dotted lines are the prediction and 95% confidence interval of the model as described in E. (G) Polar histograms of heading changes achieved by runs for afixed initial heading, indicated by arrow. (H) Polar histograms of heading changes achieved by turns for a fixed initial heading before turn. The arrow indicates the initial heading. (I) Probability of first head-sweep (h.s) direction and acceptance of head-sweeps, whether left (L) or right (R), sorted by initial heading. In A–F, shaded areas represent SEM. In I, * indicates P < 0.01 and ** indicates P < 0.0001 using binomial statistics. Data represent nine experiments and 123 animals.
If larvae directly sense the direction of light by spatial comparisons between the BO, we would expect them to steer within runs and/or preferentially initiate head-sweeps away from incident light rays. Larvae do not display these biases (Fig. 7 C, G, and I). Instead, larvae appear to rely on temporal comparisons during head-sweeps to analyze the direction of light rays.
The Fifth LN Constitutes a Major Relay for All Components of the Fast Photosensory Response.
To begin to map the circuit mechanisms for the photosensory response, we examined the downstream circuit from the BOs that might mediate distinct components of the fast phototactic response, e.g., starting head-sweeps with temporal increases in illumination, starting runs during head-sweeps when the larva perceives a drop in illumination, or pausing during runs when the larva encounters sudden darkness. The BO is comprised of 12 PRs; eight express Rh6, and four express Rh5. We and others have found that the Rh6 cells are dispensable for phototaxis (17). All PRs extend their axons to the larval optic neuropil (LON). The PRs send synaptic output to three neuronal classes: three optic lobe pioneer neurons per hemisphere, a cluster of serotonergic cells, and five LNs (26). The LNs along with two dorsal neurons (DN1 and DN2) constitute the clock neurons that are involved in Rh6-dependent circadian rhythms (Fig. 8A) (17). The LNs have been implicated in phototaxis in a spatial gradient assay (17, 27); however the relative contribution of each of these downstream neuronal types to specific phototactic responses has not yet been dissected.
Fig. 8.

Segregation of photosensory responses occurs at the first relay. (A) (1 and 2) Projection pattern of the neurons expressing UAS-CD8::GFP under the control of tim-Gal4 (A1, labeling all LNs, DN2s, and DN1s) or tim-Gal4, cry-gal80 (A2, labeling the fifth LN and DN2); anti-GFP is shown in green, and the neuropile marker is shown in blue, with fasciculin/ChaT and Dlg, respectively. (3) Single clone of a fifth LN generated with hs-flp; tim-Gal4/UAS-FRT-CD2-STOP-FRT-CD8::GFP (anti-GFP is show in green, and anti-pdf is shown in red). The non-pdf fifth LN innervates the LON and shows a projection pattern distinct from the pdf-expressing LNs. (4) 3D model of the fifth LN using TrackEM from a confocal stack of a flipped-out fifth LN. The mushroom body helps map the brain (gold). (B) Navigational index (v)/(s) computed for the x direction. Rejection of the null hypothesis that the dataset has the same mean as the TIM dataset: *P < 0.05 or **P < 0.005, Welch two-tailed t test. Error bars indicate SEM. (C) Turn direction bias toward darkness. *Rejection of null hypothesis that distributions have same mean as TIM at P < 0.0001, two-tailed binomial statistics. n = number of turning events. (D) Turn rate (Upper) and pause rate (Lower) in the temporal assays at the onset of light and darkness, respectively. (E) GCaMP6 responses of the fifth LN in one larva exposed to seven on/off pulses of light. Individual ΔF/F traces of each pulse are shown in black, and the mean is shown in red. Error bars indicate SD. (F) GCaMP6 responses of the fifth LN in five animals normalized to a 2-s window of the fluorescence intensity plateau.
The LN population consists of four pigment-dispersing factor (PDF)–positive cells and one PDF-negative cell, the fifth LN. The fifth LN also is negative for the cryptochrome protein (CRY) (26). Moreover, a choice assay suggests that the fifth LN may be required during light-avoidance behavior (17).
To determine whether the LNs, and specifically the fifth LN, constituted a major relay for fast phototactic responses, we used genetic tools combined with our behavioral assays to characterize the effects of cell-specific inactivation. The tim promoter drives expression in all clock neurons including the four PDF-LNs and the fifth LN. Using the flp-out technique (TIM > CD2STOP-GFP), we found that the fifth LN projection arbor is different from those of the other PDF LNs with a more elaborate, medially branching pattern (Fig. 8A, 3 and 4). The fifth LN also can be isolated from other LNs by using the tim-Gal4;cry-Gal80 fly strain in which three neurons (one fifth LN and two DN2s) are labeled. We did not observe any response in DN2s to light stimulation using calcium imaging, suggesting that the behavioral response is mediated by the fifth LN (see below).
First, we examined the response to directional illumination, which isolates a specific photosensory response. To navigate away from light, the larva tends to start new runs when it encounters an apparent drop in illumination during a head-sweep. We found that inactivating all clock neurons completely abolishes navigation away from directional illumination (Fig. 8B) and abolishes the turning bias away from incoming light (Fig. 8C). This result suggests that the clock neurons are required for phototaxis away from directed illumination. When we specifically inactivated the fifth LN,, we found that directional navigation and turning bias away from incoming light were disrupted by >50% but were not eliminated. Thus, the fifth LN contributes part, but not all, of this LN-dependent photosensory response (Fig. 8 B and C).
Next, we examined the behavioral response to temporal variations in illumination. Temporal increases in illumination stimulate turning behavior; the larva tends to stop runs and select new directions for forward movement if it encounters an increase in light intensity. We found that inactivating the LNs greatly disrupted but did not eliminate this photosensory response (Fig. 8D, Upper). Inactivating only the fifth LN had the same effect as inactivating all LNs. These results suggest that the fifth LN may be the critical LN in mediating the photosensory response to the onset of illumination. However, it is likely that either the optic lobe pioneer neurons or the serotonergic neurons downstream of the PRs also contribute to the increase in turning rate with increased illumination. In contrast, when we examined dark-induced pausing behavior, we found that inactivating all LNs or only the fifth LN completely abolished dark-induced pausing (Fig. 8D, Lower). Thus, the fifth LN appears to be the principal pathway for dark-induced pausing.
Our results suggest that the fifth LN is a major relay for all components of the fast phototactic response and the principal relay for dark-induced pausing. All these BO-mediated reactions are transient, lasting ∼2 s. To determine whether the physiological properties of the fifth LN are consistent with a role in these fast phototactic responses, we turned to calcium imaging. We characterized the calcium dynamics of the fifth LN by imaging GCaMP6 (28) at the presynaptic region using two-photon laser scanning microscopy. We stimulated the BOs with a blue LED in a dissected preparation in saline solution. Each larva was stimulated with alternating 5-s light and dark periods (Fig. 8 E and F and Movie S7). We found that after the onset of light the neuron leads to a step increase in calcium levels, taking ∼1.5 s to reach saturation. Similarly, onset of darkness leads to a drop in calcium levels, taking ∼1.5 s to return to baseline. Calcium dynamics resemble behavioral dynamics at light onset (Fig. 8D, Upper). We conclude that the fifth LN is involved in all fast behavioral responses. In comparison, we found that the nearby DN neurons that also are labeled along with the fifth LN in the tim-Gal4;cry-Gal80 transgenic line did not exhibit any calcium dynamics; this result may exclude them from the circuit for fast phototactic responses.
Discussion
Fig. 9 summarizes the sensorimotor structure of larval phototaxis. Larvae modulate their frequency of turning based on temporal changes in light intensity. In continuously varying gradients (11, 12, 14), this modulation results in longer runs in favorable directions (Fig. 9A). Larvae also bias their turn size, executing larger heading changes following runs toward nonpreferred directions and smaller heading changes following runs in the preferred direction (Fig. 9B). Larvae use temporal head-sweeps as probes to explore local luminosity gradients and to identify the preferred direction for successive runs. The initial head-sweep direction is unbiased, but larvae are more likely to accept head-sweeps toward the preferred direction (Fig. 9C).
Fig. 9.

Models for the phototaxis navigational strategy and photosensory processing. (A) Larvae use temporal comparisons of light intensity during runs to modulate turn frequency. The gradient represents the light intensity. (B) Larvae make larger turns from the nonpreferred direction and smaller turns from the preferred direction. (C) Larvae use head-sweeps as probes to explore their local environment and to identify the preferred direction for successive runs. Turn direction bias is generated by asymmetrical acceptance of head-sweeps toward the preferred direction. (D) Model of larval photosensory processing based on temporal derivatives of lumonisoty (d/dt) as described in text.
These strategies all rely on decoding temporal variations in the amount of light incident on the BO. The BO and the surrounding cephalopharyngeal sclerites transduce directional light information to temporal variations of light intensity (Fig. 6D). On directional lightscapes (Fig. 6), larval head-sweeps change the amount of light incident on the BO, whereas the apparent intensity remains constant during straight, forward runs; hence, turn magnitude and direction are biased (Fig. 7 E and I), but turn frequency is not.
The larva contains two photosensory structures, the BO (Fig. 9D, blue) and the class IV md neurons (Fig. 9D, purple). The BO is the main photosensory structure, contributing to phototaxis across the full range of ecologically relevant light intensities studied here, and is specifically required for direction-based phototaxis and dark-induced pausing. Multidendritic neurons contribute to light-evoked turning at very high intensities (Fig. 3E, compare GMR-hid, rh52;rh61 with wCS). Photosensory information obtained from the BO is translated into behavior more rapidly than photosensory information obtained from md neurons (Fig. 3G). Transitions in behavioral state driven by either photosensory structure are based on temporal comparisons, but the location of the BO in the “pigment cup” formed by the cephalopharyngeal sclerites uniquely allows decoding of incident light direction. Taken together, our results establish the sensorimotor structure of larva phototaxis. Moreover, our results appear to settle a controversy in Drosophila larval phototaxis (1, 19, 20), explaining the apparent tropism in direction-based phototaxis as a joint product of the anatomy of the light-sensing organ and temporal comparisons used during intensity-based phototaxis.
For BO-mediated visual responses, we have been able to map the relative contributions of the LNs and the fifth LN to the photosensory response. These neurons represent the first relay in the BO-mediated visual response. Although we found no evidence that the BO-mediated visual response involves spatial comparisons between the activities of the two neurons, the first relay maintains the laterality of BO output, i.e., the neurons in the first relay on the left side of the brain receive input only from the left BO, and the neurons in the first relay on the right side receive input only from the right BO. If signal-averaging or direct comparisons between the outputs of the BO occur, they occur in deeper layers.
Interestingly, the roles of neurons in the first relay begin to segregate for the distinct types of photosensory response. We find that the fifth LN is essential for dark-induced pausing. We find that the LNs are essential for phototaxis away from directional illumination, with a partial contribution of the fifth LN. We find that the LNs partly contribute to light-induced increases in turning rate. Our results suggesting that sensorimotor pathways for different components of the overall photosensory response diverge at the first relay are a first step toward mapping the circuit-level basis of phototaxis in the Drosophila larva.
Materials and Methods
Strains.
The following fly strains were used: Canton-S, wCS, w;GMR-hid (created from Bloomington stock #5771), w;rh52;rh61 (gift from Claude Desplan, New York University, New York), tim-gal4;cry-Gal80 (gift from Justin Blau, New York University, New York), w;rh52, w;rh61, w;rh52-GFP (created from Bloomington stock #8600), w;GMR-myr-RFP (Bloomington stock #7121), w; longGMR-gal4 (Bloomington stock #8604), w;UAS-CD8::GFP (created from Bloomington stock #5137), and UAS-CD2-FRT-STOP-FRT-CD8::GFP (29).
Phototaxis Apparatus.
Larval behavior was recorded with a USB CCD camera (BCE-BO5O-U; Mightex) fitted with a 620-nm bandpass filter (FB620-10; Thorlabs) at five frames/s using dark-field illumination with red LEDs (624 nm, outside the range of larval vision). For the checkerboard lightscape (Figs. 1 and 2) and linear intensity gradient (Fig. 4B) only, the dark-field illumination was provided by infrared LEDs (875 nm), and behavior was imaged through a long-pass filter.
Light stimuli were delivered by a liquid-crystal display projector (Epson Powerlite W for low intensities) or a digital light-processing (DLP) projector (ViewSonic PRO8500 XGA DLP for high intensities) and were projected directly onto the agar or were reflected off a front-surface 10 × 10 inch mirror (Edmund Optics NT46-653). Except for the checkerboard experiment (Fig. 2), the Epson projector red channel was disabled using software to avoid interference with the red LED illuminator, and the projector light also was filtered using a 335–610-nm bandpass filter (FGB37S; Thorlabs). The filter wheel from the Viewsonic projector was removed to maximize light output. Instead, Viewsonic projector light was filtered through a cyan dichroic (FD1C; Thorlabs; angle of incidence 0°) to remove red light that would interfere with the red LED illuminators. The behavioral arena was contained within a light-tight custom box (80/20 Inc.).
For Fig. 8, the dark-field illumination was provided by infrared LEDs (875 nm), and behavior was imaged through a 600-nm long-pass filter (Edmunds Optics #54–764). We used a Falcon 4M30 camera at 30 frames/s connected to the computer via a camera link connection (1433 board from National Instruments). Images were captured using a 28-mm lens (NIKKOR 28-mm f/2.8 AIS Manual Focus Lens; Nikon) capturing the entire arena in the field of view. Directional and temporal light experiments were performed with illumination from a blue and green LED (PT-120; Luminus) incident at 45°. We measured 5,000 lx on the side closest to the source that decayed linearly to 2,250 lx at the opposite side of a 25-cm square Biodish.
Movies were recorded and the light sources were controlled using custom LabView software. During experiments with temporally varying lightscapes, the software recorded the light state together with the frame number of the movie and the elapsed time so that the light intensity and larval behavior could be synchronized in analysis.
Determination of Light Intensity.
The irradiance of each light source was measured using a thermopile optical power meter (S310C; Thorlabs), and the relative spectral intensity was measured using a CCD-based spectrometer (Vernier USB-2000) fiber coupled to a cosine corrector. At the same time, the luminance also was measured using a handheld lux meter (Traceable 3251; Control Company). Because the spectral distribution of the light sources did not match the spectral distribution of the tungsten lamp with which the lux meter was calibrated, the lux meter did not read true luminance, but the measured value of the light meter was proportional to the irradiance; for each source. This constant was determined by adjusting the intensity of the source and measuring the irradiance and luminance using the optical power meter and lux meter.
After any adjustments to the apparatus and periodically afterward, the apparatus was calibrated by imaging the projector output on a Lambertian surface (projector screen) using the camera used to record larva behavior. The camera pixel values were proportional to the irradiance, and we measured the constant of proportionality by adjusting the projector intensity while using the lux meter to measure the irradiance and recording the corresponding gray value with the camera.
To calibrate the alignment of the camera to physical space and to compensate for any lens distortions, we took a picture of a 1-cm checkerboard placed in the same plane as the agar surface. Because of dispersion, the focal length of the lens was slightly different at the wavelengths in the projected image compared with the dark-field illumination wavelength used to measure behavior. To compensate for the resulting small shift in magnification, we photographed the same checkerboard under both illumination conditions.
For the experiments shown in Fig. 2, we used the calibration data to produce an image that, when projected, produced a checkerboard exactly 3 cm on a side. For all experiments, we imaged the projected light stimulus (checkerboard or constant illumination for directional and temporal experiments) on the Lambertian surface. For directional experiments (Fig. 6), we also took an image of an array of posts of known height; the length of the posts’ shadows allowed us to determine the spatial distribution of the incident light angle. Thus, we were able to determine with high accuracy the exact irradiance experienced by a larva based on its position on the camera image.
Precise quantification of lightscape intensities is shown in Figs. S1 and S2. Briefly: for the checkerboard lightscape, the light square was 12 W/m2, and the dark square was approximately <0.08 W/m2. For the temporal lightscape, the low-intensity square-wave light phase was 7–13 W/m2, and the dark phase was <0.07 W/m2. The high-intensity square-wave light phase was 40–100 W/m2, and the dark phase was <0.02 W/m2. For the directional lightscape, high intensity was 40–100 W/m2, low intensity was 4–6 W/m2, and ultra-low intensity was 0.05 W/m2; the projector-off assay was performed with no projected light and a linear spatial gradient of intensity from 2–25 W/m2 projected perpendicular to the surface.
Behavior Experiments.
All experiments were performed on second-instar larvae as verified by spiracle morphology. Adult flies were allowed to lay eggs on grape juice-supplemented agar plates with yeast for 3 h. After egg-laying, plates were kept in a 22 °C incubator on a 12-h light/dark cycle. All experiments were performed during the 12-h day.
Larvae were sorted by spiracle morphology under a dissecting microscope and then were kept in the dark on food for at least 1 h before phototaxis experiments. After dark treatment, larvae were washed under red illumination at least three times in PBS and placed on a 10-cm Petri dish containing 1% Bacto agar in the dark for at least 5 min to allow adaptation to the medium and the removal of any residual food.
Larvae then were transferred from the 10-cm Petri dish to the experimental arena using a paint brush. Larvae were distributed evenly over the center region of 4-mm thick, 24 × 24 cm square 1% Bacto agar gel poured on top of a black-anodized aluminum plate. For all experiments, the stimulus light intensity was kept at its lowest level until the beginning of recording. For the experiment shown in Fig. 3, we discarded from analysis the first period of stimulus, during which the larvae were acclimatizing to the apparatus after being handled with a paint brush. For the experiments shown in Figs. 6 and 7, we discarded the first 2 min of recorded behavior as an acclimatization period and analyzed the subsequent 15 min. (After this time, successfully navigating larvae began to pass the edge of the observation window, biasing the statistics of the population.)
For the experiment shown in Fig. 8, larvae were reared in circadian incubators at 25 °C (12-h light/dark cycle). Adult flies were allowed to lay eggs on 10-cm agar plates with yeast for 4 h during the afternoon in a 25 °C circadian incubator. After egg-laying, plates were kept in a 25 °C incubator on a 12-h light/dark cycle for 2 d. All experiments were performed during the 12-h day. Larvae were kept in the dark on food for at least 1 h before phototaxis experiments. After dark treatment, larvae were separated from the food using 1% sucrose solution, were transferred using a paint brush to a 40-µm cell strainer (352340; BD Falcon) and then were washed. Larvae then were moved into a water droplet for up to 10 min. The entire procedure was done under red illumination. Spiracle morphology was used to confirm that larvae were in the second-instar stage. Larvae were transferred by paint brush to the experimental arena and were distributed evenly over the center region of a 4-mm thick, 25 × 25 cm square 1% Bacto agar with charcoal gel poured on top of a square 25-cm Bio Dish.
Larval posture was analyzed with the MAGAT analyzer as previously described (6). Briefly, larval positions and postures were extracted from the records of the movies using custom machine vision software. As each larva is tracked throughout the arena, the position of the center of mass, the outline of the body, and the position of the head, the tail, and a midline running down the center of the larva are determined. After extraction of larval features, data were analyzed using software written in MATLAB (MathWorks). Runs were defined as periods of forward movement with the head aligned with the body; turns were defined as periods of slow or no forward movement accompanied by body bends (head-sweeps); and pauses were defined as periods of slow or no forward movement in which the head remained aligned with the body. To calculate the SE in Fig. 7, the number of independent measurements was estimated as the observation time divided by twice the autocorrelation time of the direction of forward movement.
For Fig. 2, the distance to the boundary was defined as the distance from the larva’s head to the nearest edge and was positive in light squares and negative in dark squares. For Fig. 2, only turns within 1.5 mm of an edge and at least 1.5 mm from a corner were considered.
Microscopy.
BOs in second-instar w;GMR−myr−RFP larvae were imaged using fluorescent and bright-field microscopy. Epifluorescent and bright-field images were taken using a Nikon LV100 microscope, a Nikon 40× air objective (NA 0.95), a Prior Lumen200 illuminator, and a standard RFP dichroic set and were imaged on a CoolSNAP EZ CCD camera (Roper Scientific Photometrics). Images were acquired using Nikon Elements software.
Calcium imaging was done using two-photon laser scanning microscopy using PrairieView software and an Olympus 60×, 1.0 NA LUMPLFLN objective. A mode-locked Ti:Sapphire Chameleon Ultra II laser (Coherent) tuned to 925 nm was used for excitation. Fluorescence was collected using photomultiplier tubes (Hamamatsu) after bandpass filtering. tim-Gal4;cry-Gal80 third-instar larvae expressing UAS-GCaMP6 (28) were dissected carefully in a saline solution to avoid damaging the Bolwig nerve and were pinned to a polydimethylsiloxane (Sylgard 184; Dow Corning) surface with the PRs facing a lateral blue LED M455D1 light source (Thorlabs) going through a bandpass filter (ET445/30x; Chroma) with a light intensity of 3.148 µW/m2. The saline solution contained 103 mM NaCl, 5 mM KCL, 5 mM Hepes, 5 mM d-(+)-Trehalose dihydrate (T0167; Sigma), 6 mM sucrose, 26 mM NaHCO3, 1 mM NaH2PO4, 2 mM calcium chloride dihydrate (21097; Sigma), 8 mM magnesium chloride hexahydrate (M2670; Sigma), and 7 mM l-glutamic acid monosodium salt hydrate in H2O. Fluorescence time series at each light pulse then were obtained by averaging across the spatial extent of the neuronal region displaying calcium activity in frame. Fluorescence changes were calculated relative to baseline fluorescence levels as determined by averaging 1 s just before light presentation at each pulse. Calcium imaging analysis was performed using custom MATLAB code.
3D reconstructions of BOs were carried out on longGMR > CD8::GFP second-instar larvae. Spinning-disk confocal images were acquired with a Nikon LV100 microscope fitted with an Andor Revolution system (including a Yokogawa CSU22 spinning-disk, an iXon2 EMCCD camera, and a 488-nm GFP excitation laser) using a Nikon 60× water-immersion objective (NA 1.20). Spinning-disk confocal images were recorded with Andor iQ software. Maximum-intensity x-, y-, and z-projections were constructed using custom software in Igor Pro (Wavemetrics).
Immunostaining and 3D reconstructions for neuroanatomical descriptions were performed as previously described (26, 30). Image sequence stacks were acquired using a Leica SP5 confocal microscope. 3D reconstruction was done using the TrackEM2 plugin in FIJI (ImageJ; National Institutes of Health). For primary antibodies, we used anti-GFP, anti-Pdf, anti-discs large (anti-Dlg), and anti-NCad, all available at Developmental Studies Hybridoma Bank. Secondary antibodies were goat anti-mouse conjugated with Alexa-488, Alexa-555, or Alexa-647 (Molecular Probes).
Supplementary Material
Acknowledgments
We thank S. Whitmore and K. Hunter for help with experiments; C. Desplan, J. Blau, the Bloomington Stock Center, and the Developmental Studies Hybridoma Bank for transgenic flies and antibodies; E. Soucy and J. Greenwood for engineering advice and assistance; and P. Garrity and S. Kunes for critical reading of the manuscript. This work was funded by a National Institutes of Health Pioneer Award (to A.D.T.S.), European Research Council ERC-2012-StG 309832-PhotoNaviNet (to S.G.S.), and the Howard Hughes Medical Institute Janelia Farm Research Campus.
Footnotes
The authors declare no conflict of interest.
This article is a PNAS Direct Submission.
This article contains supporting information online at www.pnas.org/lookup/suppl/doi:10.1073/pnas.1215295110/-/DCSupplemental.
References
- 1.Mast SO. Factors involved in the process of orientation of lower organisms in light. Biol Rev Camb Philos Soc. 1938;13:186–224. [Google Scholar]
- 2.Fraenkel GS, Gunn DL. The Orientation of Animals, Kineses, Taxes and Compass Reactions. Oxford, New York: Oxford University Press; 1961. [Google Scholar]
- 3.Sawin EP, Harris LR, Campos AR, Sokolowski MB. Sensorimotor transformation from light reception to phototactic behavior in Drosophila larvae. J Insect Behav. 1994;7:553–567. [Google Scholar]
- 4.Sawin-McCormack EP, Sokolowski MB, Campos AR. Characterization and genetic analysis of Drosophila melanogaster photobehavior during larval development. J Neurogenet. 1995;10(2):119–135. doi: 10.3109/01677069509083459. [DOI] [PubMed] [Google Scholar]
- 5.Hassan J, Busto M, Iyengar B, Campos AR. Behavioral characterization and genetic analysis of the Drosophila melanogaster larval response to light as revealed by a novel individual assay. Behav Genet. 2000;30(1):59–69. doi: 10.1023/a:1002090627601. [DOI] [PubMed] [Google Scholar]
- 6.Scantlebury N, Sajic R, Campos AR. Kinematic analysis of Drosophila larval locomotion in response to intermittent light pulses. Behav Genet. 2007;37(3):513–524. doi: 10.1007/s10519-007-9146-3. [DOI] [PubMed] [Google Scholar]
- 7.Hassan J, Iyengar B, Scantlebury N, Rodriguez Moncalvo V, Campos AR. Photic input pathways that mediate the Drosophila larval response to light and circadian rhythmicity are developmentally related but functionally distinct. J Comp Neurol. 2005;481(3):266–275. doi: 10.1002/cne.20383. [DOI] [PubMed] [Google Scholar]
- 8.Busto M, Iyengar B, Campos AR. Genetic dissection of behavior: Modulation of locomotion by light in the Drosophila melanogaster larva requires genetically distinct visual system functions. J Neurosci. 1999;19(9):3337–3344. doi: 10.1523/JNEUROSCI.19-09-03337.1999. [DOI] [PMC free article] [PubMed] [Google Scholar]
- 9.Gong Z. Behavioral dissection of Drosophila larval phototaxis. Biochem Biophys Res Commun. 2009;382(2):395–399. doi: 10.1016/j.bbrc.2009.03.033. [DOI] [PubMed] [Google Scholar]
- 10.Keene AC, Sprecher SG. Seeing the light: Photobehavior in fruit fly larvae. Trends Neurosci. 2012;35(2):104–110. doi: 10.1016/j.tins.2011.11.003. [DOI] [PubMed] [Google Scholar]
- 11.Gershow M, et al. Controlling airborne cues to study small animal navigation. Nat Methods. 2012;9(3):290–296. doi: 10.1038/nmeth.1853. [DOI] [PMC free article] [PubMed] [Google Scholar]
- 12.Gomez-Marin A, Stephens GJ, Louis M. Active sampling and decision making in Drosophila chemotaxis. Nat Commun. 2011;2:441. doi: 10.1038/ncomms1455. [DOI] [PMC free article] [PubMed] [Google Scholar]
- 13.Lahiri S, et al. Two alternating motor programs drive navigation in Drosophila larva. PLoS ONE. 2011;6(8):e23180. doi: 10.1371/journal.pone.0023180. [DOI] [PMC free article] [PubMed] [Google Scholar]
- 14.Luo L, et al. Navigational decision making in Drosophila thermotaxis. J Neurosci. 2010;30(12):4261–4272. doi: 10.1523/JNEUROSCI.4090-09.2010. [DOI] [PMC free article] [PubMed] [Google Scholar]
- 15.Lilly M, Carlson J. smellblind: A gene required for Drosophila olfaction. Genetics. 1990;124(2):293–302. doi: 10.1093/genetics/124.2.293. [DOI] [PMC free article] [PubMed] [Google Scholar]
- 16.Sprecher SG, Desplan C. Switch of rhodopsin expression in terminally differentiated Drosophila sensory neurons. Nature. 2008;454(7203):533–537. doi: 10.1038/nature07062. [DOI] [PMC free article] [PubMed] [Google Scholar]
- 17.Keene AC, et al. Distinct visual pathways mediate Drosophila larval light avoidance and circadian clock entrainment. J Neurosci. 2011;31(17):6527–6534. doi: 10.1523/JNEUROSCI.6165-10.2011. [DOI] [PMC free article] [PubMed] [Google Scholar]
- 18.Xiang Y, et al. Light-avoidance-mediating photoreceptors tile the Drosophila larval body wall. Nature. 2010;468(7326):921–926. doi: 10.1038/nature09576. [DOI] [PMC free article] [PubMed] [Google Scholar]
- 19.Loeb J. The Mechanistic Conception of Life. Chicago: Univ of Chicago Press; 1912. [Google Scholar]
- 20.Patten BM. A Quantitative Determination of the Orienting Reaction of the Blowfly Larva. J Exp Zool. 1914;17:213–280. [Google Scholar]
- 21.Anderson MC. Studies of the woodland light climate: I. The photographic computation of light conditions. J Ecol. 1964;52:27–41. [Google Scholar]
- 22.Anderson MC. Studies of the woodland light climate: II. Seasonal variation in the light climate. J Ecol. 1964;52:643–663. [Google Scholar]
- 23.Thekaekara MP, Drummond AJ. Standard values for the solar constant and its spectral components. Nature. 1971;229:6–9. [Google Scholar]
- 24.Arendt D, Tessmar K, de Campos-Baptista M-IM, Dorresteijn A, Wittbrodt J. Development of pigment-cup eyes in the polychaete Platynereis dumerilii and evolutionary conservation of larval eyes in Bilateria. Development. 2002;129(5):1143–1154. doi: 10.1242/dev.129.5.1143. [DOI] [PubMed] [Google Scholar]
- 25.Hinnemann A, Niederegger S, Hanslik U, Heinzel H-G, Spiess R. See the light: Electrophysiological characterization of the Bolwig organ’s light response of Calliphora vicina 3rd instar larvae. J Insect Physiol. 2010;56(11):1651–1658. doi: 10.1016/j.jinsphys.2010.06.010. [DOI] [PubMed] [Google Scholar]
- 26.Sprecher SG, Cardona A, Hartenstein V. The Drosophila larval visual system: High-resolution analysis of a simple visual neuropil. Dev Biol. 2011;358(1):33–43. doi: 10.1016/j.ydbio.2011.07.006. [DOI] [PMC free article] [PubMed] [Google Scholar]
- 27.Mazzoni EO, Desplan C, Blau J. Circadian pacemaker neurons transmit and modulate visual information to control a rapid behavioral response. Neuron. 2005;45(2):293–300. doi: 10.1016/j.neuron.2004.12.038. [DOI] [PubMed] [Google Scholar]
- 28.Chen T-W, et al. Ultrasensitive fluorescent proteins for imaging neuronal activity. Nature. 2013;499(7458):295–300. doi: 10.1038/nature12354. [DOI] [PMC free article] [PubMed] [Google Scholar]
- 29.Wong AM, Wang JW, Axel R. Spatial representation of the glomerular map in the Drosophila protocerebrum. Cell. 2002;109(2):229–241. doi: 10.1016/s0092-8674(02)00707-9. [DOI] [PubMed] [Google Scholar]
- 30.Sprecher SG, Reichert H, Hartenstein V. Gene expression patterns in primary neuronal clusters of the Drosophila embryonic brain. Gene Expr Patterns. 2007;7(5):584–595. doi: 10.1016/j.modgep.2007.01.004. [DOI] [PMC free article] [PubMed] [Google Scholar]
Associated Data
This section collects any data citations, data availability statements, or supplementary materials included in this article.