Abstract
The effects of salt concentration and temperature on the thermodynamics of DNA minor groove binding have quite different signatures: binding enthalpy is salt concentration independent but temperature dependent. Conversely, binding free energy is salt dependent but essentially temperature independent through enthalpy-entropy compensation.
For DNA interactions, from protein binding to DNA strand association and similar RNA reactions such as hairpin kissing complexes, polyelectrolyte effects on the thermodynamics of the DNA complexes have been extensively studied.1 These results help to provide a fundamental understanding of the driving force for binding to DNA and the molecular basis of DNA recognition.2 Privalov and coworkers have conducted studies of the thermodynamics of proteins and peptides with DNA sites as a function of salt concentration and they observed that the enthalpy for binding is essentially salt independent while its change with temperature is generally significant.3 Given the quite different effects that proteins can have on DNA this is an important observation for biomolecular reactions.
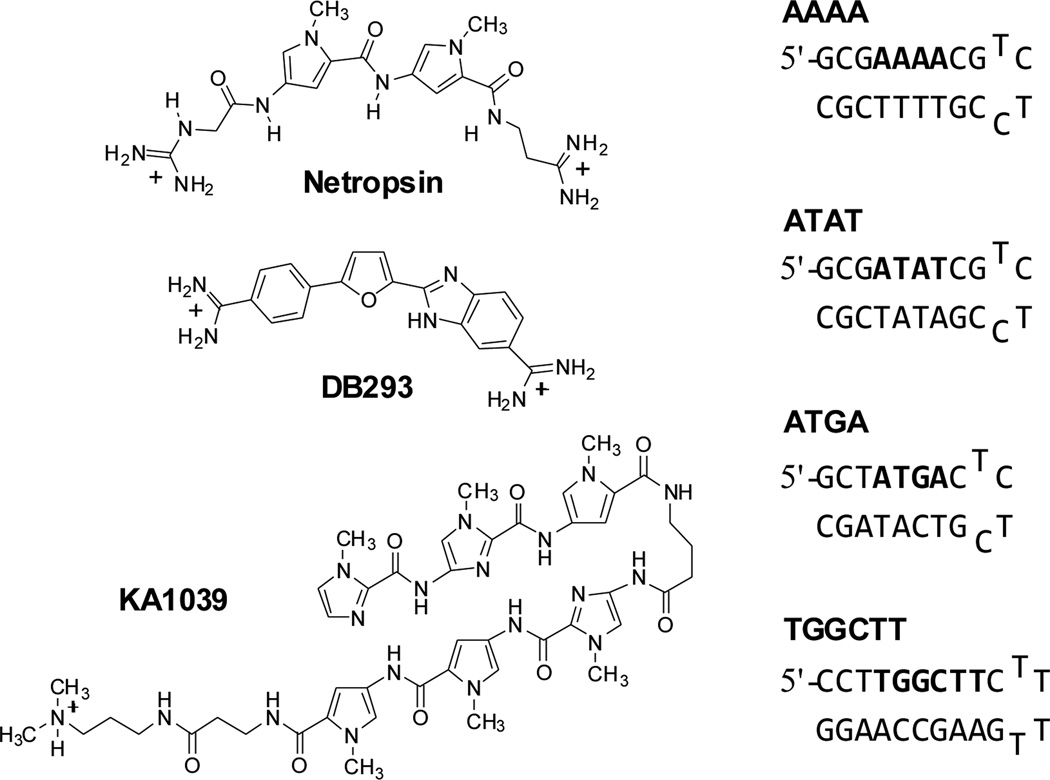
Minor groove targeting by small molecules occurs in the opposite groove for most proteins, and is an important and quite different sequence-specific mechanism for DNA recognition. Small molecules can target a broad range of DNA sequences by different modes, such as monomers, cooperative dimers and covalent hairpin structures, with high affinity and selectivity.4 Even with hundreds of papers published on DNA minor groove binding, there are still a number of important unanswered questions in the fundamentals of DNA minor groove recognition that are required for rational design of novel minor groove agents: (i) is the minor groove binding enthalpy independent of salt concentration as with protein-DNA interactions; (ii) how does the enthalpy and its salt effects change with recognition sequences (Fig. 1) and monomer or dimer complex formation; (iii) how do temperature effects on the binding enthalpy and energy compare to salt effects? To begin to fill in this essential missing information, and also to extend our understanding of the energetic basis of DNA molecular recognition, salt concentration and temperature effects on the thermodynamics of five quite different DNA minor groove complexes have been evaluated in detail in this work. They were chosen because they are representative of all the current minor groove binding modes for recognition of AT or GC-rich sites as monomers, dimers or hairpin complexes. The binding enthalpy was obtained through isothermal titration calorimetry (ITC) and the binding Gibbs free energy was determined by biosensor surface plasmon resonance (SPR).
Fig. 1.
Compound structures and hairpin DNA sequences.
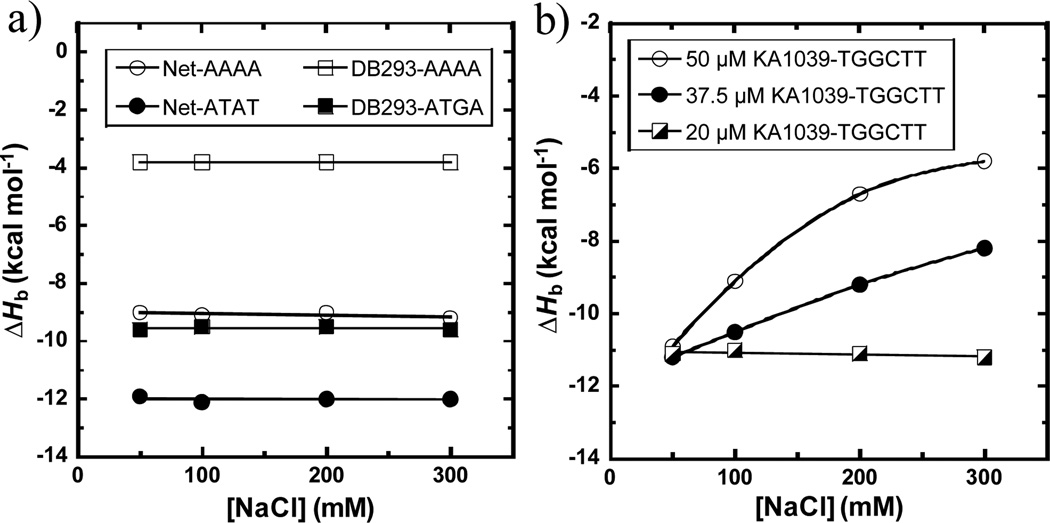
Netropsin (Net, Fig. 1) is a natural heterocyclic dication having very high specificity for monomer binding to DNA sites containing four or more AT base pairs (bp).5 Its binding enthalpies (ΔHb) with two DNA hairpin duplex sequences, AAAA and ATAT (Fig. 1) which have very distinct structural features, have been measured. AAAA has a very narrow groove with a local bend while alternating AT has a much wider groove and a more linear conformation.5b, 6 The ITC titrations under several salt concentrations are shown in Fig. S1 and the ΔHb values are plotted in Fig. 2a. Strikingly, the ΔHb values of Net with both sequences are clearly independent of salt concentration even though they are quite different for binding to the two DNAs. The ΔHb with AAAA (−9.1 ± 0.1 kcal mol−1) is less negative than with ATAT (−12.0 ± 0.2 kcal mol−1), as previously observed with other monomers.7 The narrow minor groove of A-tract sequences has an array of tightly structured water molecules which are highly ordered in a spine of hydration.8 These ordered water molecules have high entropy, and thus contribute a significant favourable entropy component when they are displaced by ligand binding in A-tracts (Table S1). Conversely, the binding in alternating AT sequences has a larger ΔHb along with a smaller binding entropy (ΔSb) in agreement with its wider minor groove that releases less-ordered, less-tightly bound water molecules.
Fig. 2.
Binding enthalpies of (a) 50 µM Net with AAAA and ATAT, 50 µM DB293 with AAAA and ATGA, (b) 50 µM, 37.5 µM and 20 µM KA1039 with TGGCTT measured by ITC at 25 °C.
The heterocyclic diamidine DB293 (Fig. 1) targets the minor groove of DNA sites that contain only AT bps as a monomer, but it binds to a mixed sequence, ATGA, as a cooperative, stacked dimer.4b The introduction of a GC bp widens the minor groove and favours dimer formation in ATGA. In order to clarify the correlations among salt concentration, enthalpy and binding modes, ITC experiments with DB293 were carried out with both the AAAA and ATGA sites (Fig. S2). The plot of ΔHb versus salt concentration (Fig. 2a) shows that the ΔHb values for these two very different complexes are quite unlike, but both have a salt independent ΔHb. The dimer formation of DB293 on ATGA has a very negative enthalpy, −9.6 ± 0.2 kcal mol−1, and the 1:1 interaction between DB293 and AAAA shows a much less negative heat (−3.8 ± 0.1 kcal mol−1). As with Net, these very different binding enthalpies are due to the distinct minor groove structures, hydrations and binding modes in the target sites. This comparison clearly shows that the presence of a GC bp can strongly affect the binding mode of a minor groove binder but the ΔHb remains independent of salt concentration.
To probe the effects of additional GC bps in the binding site on ΔHb, a synthetic hairpin polyamide (PA), KA1039, which is very different in structure from Net and DB293, has been studied with its cognate binding sequence, TGGCTT. This PA molecule binds with high affinity that is mainly driven by a favourable, negative ΔHb.9 Surprisingly, when the standard compound concentration of 50 µM is used, the ΔHb of KA1039 displayed significant decreases with increasing salt concentration (Figs. S3 and 2b). To evaluate whether the salt effect on ΔHb is due to PA aggregation, as previously observed with larger PAs,9–10 more dilute KA1039 samples (37.5 and 20 µM) were used. The ΔHb values of 20 µM, 37.5 µM and 50 µM for KA1039 at 50 mM salt concentration are the same (−11.1 ± 0.3 kcal mol−1), which indicates that all concentrations work well in obtaining the ΔHb. The ΔHb values obtained at 20 µM of KA1039 are salt-independent as with other minor groove binders in this work and this indicates that the salt dependent ΔHb changes at 50 µM and 37.5 µM for KA1039 are due to compound aggregation. The ΔHb of the monomer complex at GC-rich sites, even with this large molecule, is independent of salt concentration as with the simpler compounds.
In summary, regardless of monomer or dimer binding at AT-rich or GC-rich sites, or the size of the compound or DNA site, the enthalpy of DNA minor groove binding is salt concentration independent. This is similar to the results observed by Privalov and coworkers with protein-DNA interactions.3
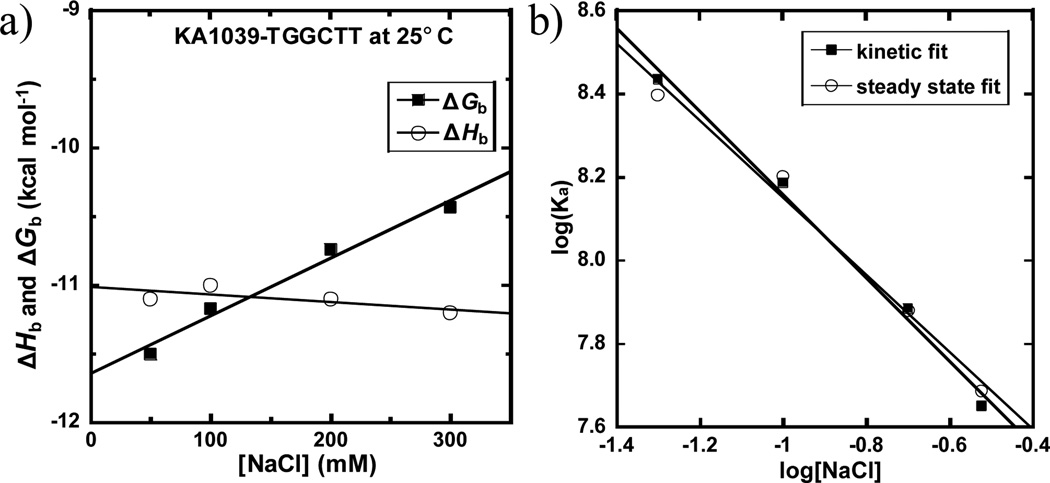
To compare the effects of both salt concentration and temperature on the thermodynamics for DNA minor groove binding, SPR experiments were conducted at 25 °C to obtain ΔGb under several salt concentrations. The response unit (RU) values at each ligand concentration were determined in the steady state region, where the on and off rates are equal and there is no mass transfer interference, and they are plotted as a function of the free concentration (Cf) of KA1039 in equilibrium with the complex in each flow solution (Fig. S4a). The equilibrium binding constants obtained by steady state fits and the rate constants determined from global kinetic fits (Fig. S4b) of the sensorgrams are listed in Table 1. Based on the equilibrium binding constants, ΔGb values at different salt concentrations were calculated (ΔGb = −RT ln Keq, where R is 1.987 cal mol−1 K−1 and T is 298 K) and are plotted with ΔHb versus salt concentration in Fig. 3a. It is clear that the ΔHb is salt independent while the ΔGb decreases linearly as the salt concentration increases. Similar changes in ΔHb and ΔGb with salt concentration have been observed with proteins.3, 11
Table 1.
SPR analysis of kinetic rate constants and equilibrium affinities for KA1039 binding to its cognate site TGGCTTa
| Kd (nM) | ||||
|---|---|---|---|---|
| [NaCl] | ka (×106 M−1s−1) | kd (×10−3 s−1) | Kinetic fit | Steady state |
| 50 mM | 7.1 ± 0.8 | 26 ± 2 | 3.7 ± 0.4 | 4.0 ± 0.2 |
| 100 mM | 4.5 ± 0.9 | 29 ± 3 | 6.5 ± 0.6 | 6.3 ± 0.6 |
| 200 mM | 2.4 ± 0.2 | 32 ± 6 | 13 ± 1.1 | 13 ± 0.5 |
| 300 mM | 1.5 ± 0.2 | 33 ± 4 | 22 ± 0.3 | 21 ± 1.0 |
Kinetic analysis was performed by global fitting of 1:1 binding model: ka=(d[AB]/dt)/([A]*[B]), kd=(−d[AB]/dt)/[AB] and Kd=kd/ka, where [A], [B] and [AB] are the concentrations of the immobilized DNA, PA, and complex, respectively. Errors listed are the standard errors for the global fit.
Fig. 3.
(a) Plot of ΔGb and ΔHb versus salt concentrations for KA1039 at 25 °C. (b) Salt dependence of Ka for KA1039 binding as determined by SPR. The Ka values were obtained by both global kinetic and steady state fits.
The counterion condensation theory 1a, 12 predicts that the logarithm of the equilibrium binding constants (Ka) of KA1039 is a linear function of the logarithm of salt concentration and this is observed in Fig. 3b. The slopes of the linear fits are around one and are quite consistent: −0.99 ± 0.02 for kinetic and 0.93 ± 0.03 for steady state fits. Therefore, approximately one cation has been displaced for the complex formation. The number of phosphate contacts (Z) between KA1039 and DNA can be determined by the slope/Ψ, where Ψ is the fraction of phosphate shielded by condensed counterions and is 0.88 for double stranded B-DNA: Z=0.96/0.88=1.09.1 Thus there is about one phosphate contact between KA1039 and DNA which is reasonable since this PA has a single positive charge (Fig. 1) that can have electrostatic interactions with DNA phosphate groups. The rate constants are also depending on salt concentration. As the salt concentrations increase, the association rate (ka) of KA1039 becomes remarkably slower while the dissociation rate (kd) is slightly faster and thus the Kd decreases, as expected.1 The salt concentration dependency of both kinetic constants are calculated and shown in Fig. S5. The linear change of the logarithm values [slopes = +0.14 for log (kd) and −0.86 for log (ka)] are as predicted by the counterion condensation theory for one charge interaction.12
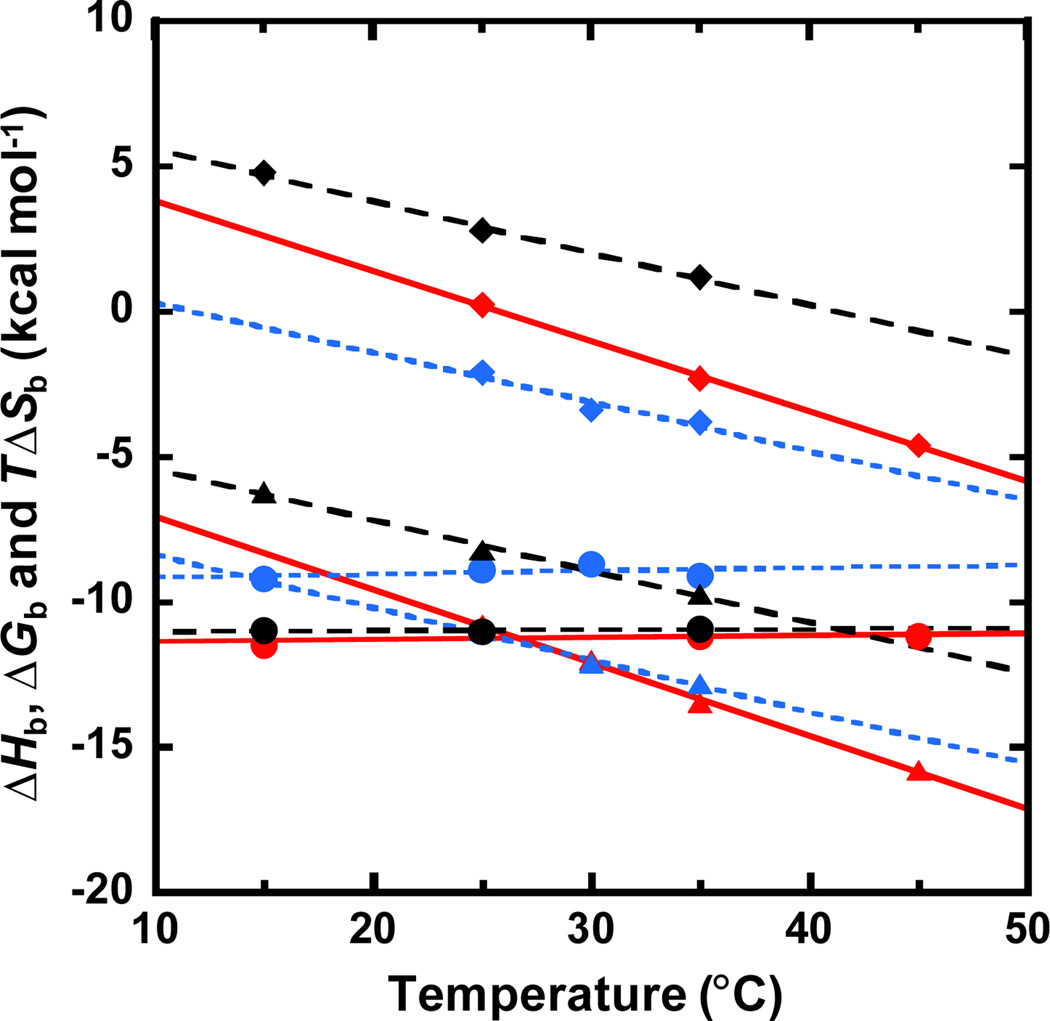
ITC and SPR experiments for Net with AAAA, DB293 with ATGA13 and KA1039 with TGGCTT9 have been conducted as a function of temperature (Table S1), and the thermodynamic profiles are shown in Fig. 4. Minor groove complex formation typically has a negative heat capacity14 and, as expected and in contrast to salt independency, a significant temperature dependence of ΔHb was observed for all three complexes. The linear fits of the ΔHb values yield the heat capacities for binding of Net with AAAA (ΔCp= −168 ± 5 cal M−1 K−1), DB293 with ATGA (ΔCp= −180 ± 10 cal M−1 K−1 13) and KA1039 with TGGCTT (ΔCp= −287 ± 10 cal M−1 K−1 9). The ΔCp values for these compounds correlate with their buried surface area as observed with other similar minor groove binders13, 15: Net (monomer) < DB293 (stacked dimer) < KA1039 (covalent hairpin dimer). Moreover, a number of heterocyclic diamidines have been investigated with AATT binding sites 15. In all cases a negative heat capacity was obtained with enthalpy-entropy compensation to give a small change in ΔGb. Interestingly, complex formation of DB293-ATGA and KA1039-TGGCTT is strongly driven by enthalpy which is opposite to most of the minor groove binders which have been investigated16, and their enthalpy-entropy compensation profiles are distinct from those of A-tracts complexes as generalized by Chaires.16 The presence of GC bps in the binding site alters the hydration character of the minor groove, and the stacking of heterocycles and numerous H-bonds between ligands and DNA make minor groove binding thermodynamics at GC sites more similar to that normally observed for intercalators. This is a very important extension of the thermodynamic signatures of DNA minor groove binding.
Fig. 4.
Thermodynamic profiles of Net-AAAA (black), DB293-ATGA (blue) and KA1039-TGGCTT (red) as a function of temperature. The values of ΔHb are in triangles, ΔGb are in circles and TΔSb are in diamonds. The thermodynamics of DB293-ATGA are from ref 13.
In conclusion, the fundamental energetic features of DNA minor groove targeting small molecules as functions of minor groove geometries, binding modes, DNA sequences, salt concentrations and temperatures have been determined. The results clearly illustrate that despite substantial differences in binding sequences and structures of the minor groove complexes, the ΔHb for binding changes by a negligible amount but is accompanied by large changes in ΔGb and ΔSb as a function of salt concentration. Interestingly and conversely, these reactions have significant increases in ΔHb with temperature and a negative heat capacity for binding. The temperature-dependent ΔHb and ΔSb compensate, however, to give a relatively small change in ΔGb for binding versus temperature, unlike the large changes with salt concentration. The effects of salt concentration and temperature thus have quite different signatures for DNA minor groove binding and they provide important insights into small molecule-DNA complexes and significantly expand our understanding of the molecular basis of DNA recognition.
Supplementary Material
Acknowledgments
The authors thank NIH NIAID AI064200 to W.D.W and D.W.B, NIH NIAID AI083803 to J.K.B for support and the Center for Diagnostics and Therapeutics for a fellowship to S.W. The authors thank Carol Wilson for manuscript proofreading.
Footnotes
Electronic Supplementary Information (ESI) available: Experimental details, ITC titrations and steady state fits of SPR data. See DOI: 10.1039/b000000x/
Notes and references
- 1.(a) Record MT, Jr, Anderson CF, Lohman TM. Q. Rev. Biophys. 1978;11:103. doi: 10.1017/s003358350000202x. [DOI] [PubMed] [Google Scholar]; (b) Marky LA, Blumenfeld KS, Kozlowski S, Breslauer KJ. Biopolymers. 1983;22:1247. doi: 10.1002/bip.360220416. [DOI] [PubMed] [Google Scholar]; (c) Salim N, Lamichhane R, Zhao R, Banerjee T, Philip J, Rueda D, Feig AL. Biophys. J. 2012;102:1097. doi: 10.1016/j.bpj.2011.12.052. [DOI] [PMC free article] [PubMed] [Google Scholar]
- 2.(a) Chaires JB. Anticancer Drug Des. 1996;11:569. [PubMed] [Google Scholar]; (b) Privalov PL, Dragan AI, Crane-Robinson C, Breslauer KJ, Remeta DP, Minetti CA. J. Mol. Biol. 2007;365:1. doi: 10.1016/j.jmb.2006.09.059. [DOI] [PMC free article] [PubMed] [Google Scholar]
- 3.Privalov PL, Dragan AI, Crane-Robinson C. Nucleic Acids Res. 2011;39:2483. doi: 10.1093/nar/gkq984. [DOI] [PMC free article] [PubMed] [Google Scholar]
- 4.(a) Dervan PB, Burli RW. Curr. Opin. Chem. Biol. 1999;3:688. doi: 10.1016/s1367-5931(99)00027-7. [DOI] [PubMed] [Google Scholar]; (b) Wang L, Bailly C, Kumar A, Ding D, Bajic M, Boykin DW, Wilson WD. Proc. Natl. Acad. Sci. USA. 2000;97:12. doi: 10.1073/pnas.97.1.12. [DOI] [PMC free article] [PubMed] [Google Scholar]
- 5.(a) Kopka ML, Yoon C, Goodsell D, Pjura P, Dickerson RE. Proc. Natl. Acad. Sci. USA. 1985;82:1376. doi: 10.1073/pnas.82.5.1376. [DOI] [PMC free article] [PubMed] [Google Scholar]; (b) Wang S, Munde M, Wang S, Wilson WD. Biochemistry. 2011;50:7674. doi: 10.1021/bi201010g. [DOI] [PMC free article] [PubMed] [Google Scholar]
- 6.Koo HS, Wu HM, Crothers DM. Nature. 1986;320:501. doi: 10.1038/320501a0. [DOI] [PubMed] [Google Scholar]
- 7.Liu Y, Collar CJ, Kumar A, Stephens CE, Boykin DW, Wilson WD. J. Phys. Chem. B. 2008;112:11809. doi: 10.1021/jp804048c. [DOI] [PMC free article] [PubMed] [Google Scholar]
- 8.(a) Drew HR, Dickerson RE. J. Mol. Biol. 1981;151:535. doi: 10.1016/0022-2836(81)90009-7. [DOI] [PubMed] [Google Scholar]; (b) Shui X, McFail-Isom L, Hu GG, Williams LD. Biochemistry. 1998;37:8541. doi: 10.1021/bi973073c. [DOI] [PubMed] [Google Scholar]
- 9.Wang S, Nanjunda R, Aston K, Bashkin JK, Wilson WD. Biochemistry. 2012;51:9796. doi: 10.1021/bi301327v. [DOI] [PMC free article] [PubMed] [Google Scholar]
- 10.Hargrove AE, Raskatov JA, Meier JL, Montgomery DC, Dervan PB. J. Med. Chem. 2012;55:5425. doi: 10.1021/jm300380a. [DOI] [PMC free article] [PubMed] [Google Scholar]
- 11.Dragan AI, Read CM, Makeyeva EN, Milgotina EI, Churchill MEA, Crane-Robinson C, Privalov PL. J. Mol. Bio. 2004;343:371. doi: 10.1016/j.jmb.2004.08.035. [DOI] [PubMed] [Google Scholar]
- 12.(a) deHaseth PL, Lohman TM, Record MT., Jr Biochemistry. 1977;16:4783. doi: 10.1021/bi00641a004. [DOI] [PubMed] [Google Scholar]; (b) Wilson WD, Krishnamoorthy CR, Wang YH, Smith JC. Biopolymers. 1985;24:1941. doi: 10.1002/bip.360241008. [DOI] [PubMed] [Google Scholar]; (c) Lohman TM, deHaseth PL, Record MT., Jr Biophys. Chem. 1978;8:281. doi: 10.1016/0301-4622(78)80011-8. [DOI] [PubMed] [Google Scholar]
- 13.Wang L, Kumar A, Boykin DW, Bailly C, Wilson WD. J. Mol. Biol. 2002;317:361. doi: 10.1006/jmbi.2002.5433. [DOI] [PubMed] [Google Scholar]
- 14.Gallagher K, Sharp K. Biophys. J. 1998;75:769. doi: 10.1016/S0006-3495(98)77566-6. [DOI] [PMC free article] [PubMed] [Google Scholar]
- 15.(a) Nguyen B, Stanek J, Wilson WD. Biophys. J. 2006;90:1319. doi: 10.1529/biophysj.105.071381. [DOI] [PMC free article] [PubMed] [Google Scholar]; (b) Mazur S, Tanious FA, Ding D, Kumar A, Boykin DW, Simpson IJ, Neidle S, Wilson WD. J. Mol. Biol. 2000;300:321. doi: 10.1006/jmbi.2000.3869. [DOI] [PubMed] [Google Scholar]
- 16.Chaires JB. Arch. Biochem. Biophys. 2006;453:26. doi: 10.1016/j.abb.2006.03.027. [DOI] [PubMed] [Google Scholar]
Associated Data
This section collects any data citations, data availability statements, or supplementary materials included in this article.


