

Abstract
BACKGROUND AND PURPOSE
Although inhibition of renal sodium–glucose co-transporter 2 (SGLT2) has a stable glucose-lowering effect in patients with type 2 diabetes, the effect of SGLT2 inhibition on renal dysfunction in type 2 diabetes remains to be determined. To evaluate the renoprotective effect of SGLT2 inhibition more precisely, we compared the effects of tofogliflozin (a specific SGLT2 inhibitor) with those of losartan (an angiotensin II receptor antagonist) on renal function and beta-cell function in db/db mice.
EXPERIMENTAL APPROACH
The effects of 8-week tofogliflozin or losartan treatment on renal and beta-cell function were investigated in db/db mice by quantitative image analysis of glomerular size, mesangial matrix expansion and islet beta-cell mass. Blood glucose, glycated Hb and insulin levels, along with urinary albumin and creatinine were measured
KEY RESULTS
Tofogliflozin suppressed plasma glucose and glycated Hb and preserved pancreatic beta-cell mass and plasma insulin levels. No improvement of glycaemic conditions or insulin level was observed with losartan treatment. Although the urinary albumin/creatinine ratio of untreated db/db mice gradually increased from baseline, tofogliflozin or losartan treatment prevented this increase (by 50–70%). Tofogliflozin, but not losartan, attenuated glomerular hypertrophy. Neither tofogliflozin nor losartan altered matrix expansion.
CONCLUSIONS AND IMPLICATIONS
Long-term inhibition of renal SGLT2 by tofogliflozin not only preserved pancreatic beta-cell function, but also prevented kidney dysfunction in a mouse model of type 2 diabetes. These findings suggest that long-term use of tofogliflozin in patients with type 2 diabetes may prevent progression of diabetic nephropathy.
Keywords: beta-cell loss, nephropathy, sodium–glucose co-transporter inhibitor, tofogliflozin
Introduction
Type 2 diabetes is characterized by impaired glycaemic control as a result of insulin resistance or disturbed insulin secretion. Chronic hyperglycaemia itself may impair insulin secretion and cause pancreatic beta-cell dysfunction. Therefore, the preservation of beta-cells through appropriate glycaemic control is important to prevent both the onset of diabetes and the progressive deterioration of the diabetic disease state (Kahn, 2003; Marchetti et al., 2009).
The renal sodium–glucose co-transporter 2 (SGLT2) is specifically expressed in renal proximal tubules, and plays the dominant role in renal glucose reabsorption (Kanai et al., 1994; Wright et al., 2011). Studies with animal models of type 2 diabetes have shown SGLT2 inhibitors to have a blood glucose-lowering effect via increased urinary glucose excretion (UGE) and to have low safety concerns (Han et al., 2008; Yamamoto et al., 2011; Suzuki et al., 2012). Consequently, several SGLT2 inhibitors are now being developed in clinical studies (Chao and Henry, 2010; Ferrannini and Solini, 2012).
Because SGLT2 functions predominantly in the kidney (Chen et al., 2010; Wright et al., 2011), it is important to know the effects of long-term SGLT2 inhibition on renal function, especially under diabetic conditions. As chronic hyperglycaemia is also considered to contribute to the progression of diabetic nephropathy (DN; The DCCT Research Group, 1993; UKPDS Group, 1998), the glucose-lowering effects of SGLT2 inhibition may prevent the progression of DN by ameliorating glucose toxicity. Although studies with mouse models of type 2 diabetes suggest that the long-term inhibition of SGLT2 by remogliflozin, an SGLT2 inhibitor (Fujimori et al., 2008), or by SGLT2 genetic deletion (Jurczak et al., 2011) preserves beta-cells with improved glycaemic conditions, no details on the effects of long-term SGLT2 inhibition on renal function have been reported, even in the preclinical studies mentioned earlier.
Long-term administration of T-1095, an SGLT inhibitor, suggested that it has renoprotective effects in db/db mice together with improved glycaemic conditions (Arakawa et al., 2001). However, T-1095 and its active metabolite T-1095A may inhibit not only SGLT2, but also SGLT1, which also functions in the kidney, because both compounds have lower selectivity towards SGLT2 (Oku et al., 1999). Unfortunately, that study showed no comparison of the renal function with any clinically validated drug, such as an angiotensin II receptor antagonist (Ruster and Wolf, 2006). Therefore, the actual effects of long-term SGLT2 inhibition on renal dysfunction in type 2 diabetes were still unclear.
Tofogliflozin is a potent and highly selective inhibitor of SGLT2 (Ohtake et al., 2012) currently under clinical development (Kadowaki et al., 2012). A single oral administration of this compound lowered blood glucose levels in Zucker diabetic rats with increased renal glucose clearance and treatment for 4 weeks with this compound improved glucose tolerance in db/db mice (Suzuki et al., 2012).
In the present study, to evaluate the long-term effects of SGLT2 inhibition on renal and pancreatic function under diabetic conditions, we compared the effects of long-term (8 weeks) treatment with tofogliflozin on the renal and pancreatic functions in db/db mice, a mouse model of type 2 diabetes, with those of losartan, an angiotensin II receptor antagonist.
Methods
Animals
All animal care and experiments were performed in accordance with the guidelines for the care and use of laboratory animals at Chugai Pharmaceutical Co., Ltd, and the protocol was approved by the Institutional Animal Care and Use Committee at the company. All studies involving animals are reported in accordance with the ARRIVE guidelines for reporting experiments involving animals (Kilkenny et al., 2010; McGrath et al., 2010). A total of 69 animals was used in the experiments described here. Female db/db mice (BKS.Cg-Dock7m +/+ Leprdb/J; stock no. 000642) and their lean controls (db/ + m mice) were purchased from Charles River Laboratories Japan, Inc. (Yokohama, Japan) at 6 weeks of age. These animals were housed under a 12 h/12 h light/dark cycle (lights on 07:00–19:00 h) with controlled room temperature (20–26°C) and humidity (35–75%), and were allowed ad libitum access to a diet of standard laboratory chow (CE-2 pellets; Clea Japan) and water. The animals were 8 weeks of age at the beginning of the experiments.
Long-term administration
The db/db mice were randomly allocated into four dietary treatment groups matched for both 24 h urinary albumin excretion and body weight at 8 weeks of age. The db/db mice were kept on the standard diet or on a diet containing 0.005 or 0.015% tofogliflozin or 0.045% losartan for 8 weeks. The tofogliflozin content was determined according to previous pharmacokinetic data (Suzuki et al., 2012) and the estimated food consumption of db/db mice in order to inhibit SGLT2 completely, but not affect SGLT1. The db/ + m mice were kept on the standard diet. Blood glucose, glycated Hb, plasma insulin, plasma creatinine, urinary glucose, urinary creatinine and urinary albumin levels were measured periodically. Blood samples were collected from the tail vein or inferior vena cava to measure blood glucose, glycated Hb, plasma insulin and plasma creatinine levels. Metabolic cages were used to collect urine to measure urinary glucose, urinary creatinine, and urinary albumin excretion. At the end of 8 weeks’ treatment, animals were killed by whole blood collection from the abdominal aorta under anaesthesia with isoflurane. The kidneys and pancreas were isolated for the histological analysis described later. As part of these studies a separate group of db/db mice (16 weeks of age, n = 9) was kept on the diet containing 0.015% tofogliflozin for 4 days, then three mice each were killed at 10:00, 15:00 and 20:00 h on day 4 by whole blood collection from the abdominal aorta under anaesthesia and the plasma samples were obtained by centrifugation to determine plasma tofogliflozin concentrations. Urine and plasma samples were stored at −80°C until use.
Data collection
Plasma tofogliflozin concentrations were measured with an HPLC–MS/MS system (Shimadzu 20A; Shimadzu, Kyoto, Japan; API-4000; AB SCIEX, Framingham, MA, USA). Blood glucose levels were determined using a plasma-glucose monitoring system (Accu-Chek Aviva; Roche Diagnostics, Tokyo, Japan). Urinary glucose concentrations were measured by the hexokinase G-6-PDH method (L-Type Glu 2; Wako Pure Chemical Industries, Ltd., Osaka, Japan) with an automated analyzer (TBA-120FR; Toshiba Medical Systems, Tochigi, Japan). Creatinine concentrations in plasma and urine were measured by the creatininase–HMMPS method (L-Type Creatinine M; Wako Pure Chemical Industries, Ltd.) with the automated analyzer. Glycated Hb levels were measured by turbidimetric inhibition immunoassay (Auto Waco HbA1c; Wako Pure Chemical Industries, Ltd.) with the automated analyzer. Urinary albumin concentrations were measured by turbidimetric immunoassay (Testant Mouse Urinary Microalbumin Assay; TAUNS Laboratories, Inc., Shizuoka, Japan) with the automated analyzer. Urinary albumin excretion was evaluated as the ratio of urinary albumin concentration to that of the urinary creatinine concentration [albumin/creatinine ratio (ACR) ].
Renal creatinine and glucose clearance were determined by dividing the rate of urinary creatinine and glucose excretion for each urine collection period (24 h cumulative urine sample) by the plasma creatinine and glucose levels respectively. Plasma insulin levels were determined with an insulin elisa kit (Morinaga Institute of Biological Science, Kanagawa, Japan).
Evaluation of glomerular size and mesangial expansion
The kidneys were fixed in methanol–Carnoy's solution and embedded in paraffin. The blocks were sliced into sections 3 μm thick and stained with an anti-type IV collagen antibody (20441; Novotec, Lyon, France) or with the hematoxylin and periodic acid Schiff (PAS), and the type IV collagen-stained sections were then visualized with biotinylated secondary antibody (K4003; Dako Japan Inc., Tokyo, Japan) and HRP-conjugated streptavidin with diaminobenzidine (DAB) chromogen (K3466; Dako), and finally stained with hematoxylin by Sapporo General Pathology Laboratory Co., Ltd. (Sapporo, Japan).
For the quantification of glomerular size and mesangial type IV collagen-positive area, sections were scanned with the ScanScope and ImageScope imaging and analysis systems (Aperio Technologies, Inc., Vista, CA, USA). Fifty glomeruli per mouse from two different sections were randomly selected in the cortex region. The average of glomerular size was calculated by dividing total glomerular area (mm2) by the number of analysed glomeruli for each mouse. The mesangial matrix area was defined as the type IV collagen-positive area and is expressed as the average number of the total numbers of ‘Positive and Strong Positive’ pixels from among each of the analysed glomeruli for each mouse by using the Positive Pixel Count V9 algorithm on the default setting, and converted to the type IV collagen-positive area (mm2) from the correlation formula between the total numbers of pixels and the area in analysed glomeruli as follows (the area = the number of pixels × 2.5139974 × 10⁻⁷ + 2.814267 × 10⁻⁸; r2 = 1).
Mesangial expansion in the PAS-stained sections was evaluated,by light microscopy, without knowledge of the treatments. A total of 72–100 glomeruli were randomly selected from each animal. The mesangial matrix expansion was graded on a semiquantitative scale from 0 to 4 +, as described by other investigators (Qi et al., 2005; Guo et al., 2006), by scoring the PAS-positive area in the glomerular as follows: 0 indicates no expansion; 1 + indicates matrix expansion occupying up to 25% of a glomerulus; and 2 +, 3 +, and 4 + indicate matrix expansion occupying 25–50, 50–75 and more than 75% of a glomerulus respectively. The mesangial matrix score for each animal was shown as the average score of all the glomeruli that had been graded.
Measurement of islet beta-cell mass
Collected pancreases were embedded in OCT compound (Sakura Finetek, Tokyo, Japan) in cryomolds and frozen in n-hexane chilled with acetone and dry ice, then sliced into sections 5 μm thick and stained with hematoxylin–eosin (HE) by Sapporo General Pathology Laboratory. Pancreas sections adjacent to the HE-stained sections mentioned earlier were immunostained with anti-insulin antibody (sc-9168; Santa Cruz Biotechnology, Inc., Dallas, TX, USA) and visualized with biotinylated secondary antibody (BA-1000; Vector Laboratories Inc., Burlingame, CA, USA) and HRP-conjugated streptavidin with DAB chromogen (Discovery DAB Map Kit 760-124; Roche Diagnostics K.K., Tokyo, Japan). For four pancreas sections randomly selected from each mouse, the total beta-cell area was calculated as the ratio of the insulin-positive area to total pancreas area, with the imaging and analysis systems mentioned earlier. The insulin-positive area and total pancreas area were determined with the ‘Strong Positive’ and the total (‘Positive + Negative’) pixel numbers, respectively, using the Positive Pixel Count V9 algorithm with the intensity threshold settings as follows: weak, 220–150; medium, 150–100; strong, 100–0.
Data analysis
Data are presented as means ± SEM. Statistical analysis was performed with the SAS System for Windows, Release 8.02 (SAS Institute Japan, Tokyo, Japan). Statistical significance was determined by the parametric Dunnett's multiple comparison test for metabolic parameters in treated and untreated db/db mice, by the non-parametric Dunnett's multiple comparison (joint-ranking) for histological analysis in treated and untreated db/db mice, or by Student's t-test in untreated db/db and db/ + m mice.
Materials
Tofogliflozin ((1S,3′R,4′S,5′S,6′R)-6-[(4-ethylphenyl)methyl]-3′,4′,5′,6′-tetrahydro-6′-(hydroxymethyl)-spiro[isobenzofuran-1(3H),2′-[2H]pyran]-3′,4′,5′-triol), was synthesized in our laboratories at Chugai Pharmaceutical Co., Ltd. Losartan was purchased from LKT Laboratories Inc. (Saint Paul, MN, USA). Laboratory chow (CE2-pellets) containing 0.005% (w/w) tofogliflozin, 0.015% tofogliflozin, or 0.045% losartan was prepared by Clea Japan, Inc. (Tokyo, Japan).
Results
The effect of long-term tofogliflozin administration on hyperglycemia
The fed-state plasma glucose (PG) and glycated Hb levels were both significantly higher in untreated diabetic mice than in db/ + m mice throughout the experiment. The PG and glycated Hb levels after 4 and 8 weeks were significantly lower in the groups of db/db mice treated with 0.005 or 0.015% tofogliflozin than in the untreated control group (Figure 1A, B). The plasma tofogliflozin concentrations in the mice given the diet containing 0.015% tofogliflozin for 4 days (16 weeks of age, n = 3) at 10:00, 15:00 and 20:00h were 364 ± 35, 216 ± 44 and 606 ± 42 ng·mL−1 respectively. No improvement in glycaemic condition was observed in the group treated with 0.045% losartan.
Figure 1.

Blood glucose and glycated Hb in db/db mice. (A–B) Tofogliflozin lowered blood glucose concentration (A) and suppressed glycated Hb (B) in db/db mice. (C–E) Long-term tofogliflozin administration lowered the urine volume (C), lowered UGE (D), and elevated glucose clearance (E) in db/db mice. Data shown are means± SEM (db/db mice, n = 8; db/ + m mice, n = 10). *P < 0.05, **P < 0.01, ***P < 0.001 significantly different from control group by Dunnett's multiple comparison test. ###P < 0.001 significantly different from control group by t-test.
The urine volume and UGE were significantly higher in untreated db/db mice than in db/ + m mice (Figure 1C, D). Tofogliflozin treatment lowered urine volume compared with the untreated control group at 8 weeks of treatment (Figure 1C). Tofogliflozin treatment tended to decrease the UGE compared with the untreated control group at 4 and 8 weeks of treatment, but the differences did not reach statistical significance (Figure 1D). Tofogliflozin treatment increased renal glucose clearance levels compared with untreated db/db mice, whereas losartan treatment had no effect on this parameter (Figure 1E).
At baseline (0 weeks of treatment), the UGE was detectable at PG above around 10 mmol·L−1 and increased depending on the PG levels, suggesting the glucose filtration levels around 10 mmol·L−1 exceeded the threshold of glucose reabsorption in db/db mice (Supporting Information Figure S1A). At 4 and 8 weeks, the UGE in control and losartan groups was also apparent with increases in PG to around 20–30 mmol·L−1. In contrast, although tofogliflozin treatment reduced the PG to around 5–15 mmol·L−1 at 4 and 8 weeks, their daily UGE levels were still higher than those at 0 weeks when the PG was around 10–15 mmol·L−1 (Supporting Information Figure S1B, C). These results indicate that tofogliflozin treatment reduced the threshold of glucose reabsorption in db/db mice and increased the UGE, and then reduced the PG.
The body weight of untreated db/db mice increased gradually till 10 weeks of age (2 weeks of treatment) and reached a maximum of about 50 g (Figure 2A). Tofogliflozin treatment increased the body weight and food consumption of db/db mice, whereas losartan treatment had no effect on these parameters (Figure 2B). At baseline, there was no clear relationship between the body weight and daily food consumption (Supporting Information Figure S2A). Interestingly, at 4 weeks, when the difference in body weight between the tofogliflozin and the control groups began to be clear (Figure 2A, B), the daily food consumption in tofogliflozin groups was greater than that in the control group, even between animals with similar body weight (Supporting Information Figure S2B). Finally, at 8 weeks, there was a clear positive relationship between the body weight and food consumption, suggesting that the levels of food consumption at this stage were closely linked to the body weight of the animals (Supporting Information Figure S2C).
Figure 2.
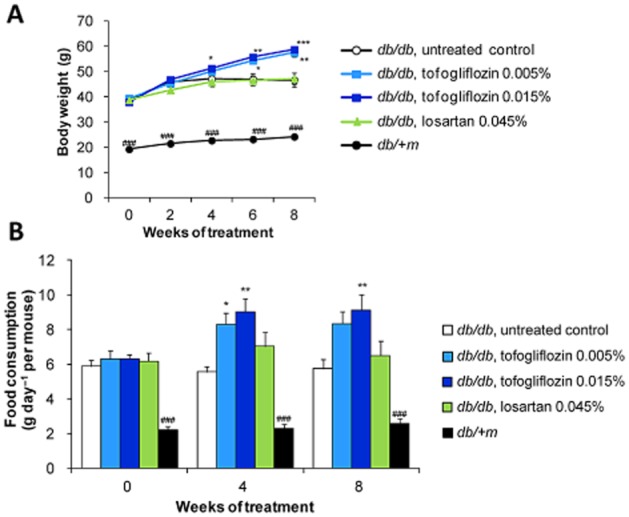
Body weight and food consumption in db/db mice. (A–B) Tofogliflozin treatment increased body weight (A) and food consumption (B) in db/db mice. Data shown are means± SEM (db/db mice, n = 8; db/ + m mice, n = 10). *P < 0.05, **P < 0.01, ***P < 0.001 significantly different from control group by Dunnett's multiple comparison test. ###P < 0.001 significantly different from control group by t-test.
The effect of long-term tofogliflozin administration on renal function
At baseline, the ACR value (μg·mg−1) was higher in the untreated db/db mice than in the db/ + m mice (Figure 3A). There were no significant differences in the ACR values at baseline among any of the treatment groups in the db/db mice. The ACR values in db/ + m mice at 4 and 8 weeks of treatment were slightly lower than the ACR values at baseline (Figure 3A). In contrast, the ACR values in untreated db/db mice at 4 and 8 weeks of treatment increased markedly over the baseline value (Figure 3B), resulting in a steady increase of ACR values at 4 and 8 weeks of treatment, respectively (Figure 3A). Both losartan and tofogliflozin treatment significantly prevented the increase of the ACR value by about 50–70% (Figure 3A, B).
Figure 3.

Urinary albumin excretion in db/db and db/ + m mice. (A–B) Values shown are the ratio of urinary albumin excretion to urinary creatinine excretion (ACR). Tofogliflozin treatment suppressed the 24 h urinary ACR in db/db mice. ACR was significantly lower in tofogliflozin-treated mice than in control db/db mice (A). Changes in ACR values from the start of study in the tofogliflozin-treated groups were comparable with changes in ACR values in the losartan-treated group at 4 and 8 weeks of treatment (B left, 0–4 weeks; B right, 0–8 weeks). Data shown are means± SEM *P < 0.05, **P < 0.01, ***P < 0.001 significantly different from control group by Dunnett's multiple comparison test. ##P < 0.01, ###P < 0.001 significantly different from control group by t-test. (C–E) Scatter plot of plasma glucose and ACR values in db/db and db/ + m mice. (C) 0 weeks (Baseline value), (D) 4 weeks of treatment, (E) 8 weeks of treatment.
At baseline, a trend towards a positive correlation between ACR values and PG levels was observed (Figure 3C). At 4 and 8 weeks, although the ACR values of several animals in the control groups exceeded 1000 and 2000 μg·mg−1, respectively, the ACR values in the tofogliflozin and losartan groups were still maintained at levels less than 1000 μg·mg−1, with improved glycaemic conditions in the tofogliflozin groups, but not in the losartan group (Figure 3D, E).
Creatinine clearance was significantly higher in the untreated db/db mice than in the db/ + m mice (Figure 4A), which is consistent with the reported hyperfiltration in db/db mice (Gartner, 1978; Sugaru et al., 2006b) or streptozotocin-induced (STZ-induced) diabetic mice (Dunn et al., 2004; Vallon et al., 2013). Tofogliflozin and losartan treatment slightly ameliorated the increase in creatinine clearance. A tendency towards a positive correlation between the PG and the creatinine clearance levels was observed in the tofogliflozin and losartan groups (Figure 4B). The plasma creatinine concentrations at 8 weeks of treatment were 0.59 ± 0.05 mg·L−1 in the untreated db/db mice, 0.64 ± 0.03 mg·L−1 in the 0.005% tofogliflozin-treated mice, 0.64 ± 0.03 mg·L−1 in the 0.015% tofogliflozin-treated mice, 0.64 ± 0.05 mg·L−1 in the 0.045% losartan-treated db/db mice, and 1.24 ± 0.12 mg·L−1 in the db/ + m mice (untreated db/db mice vs. db/ + m mice, P < 0.005).
Figure 4.

Creatinine clearance and kidney weight in db/db and db/ + m mice. (A) Creatinine clearance in db/db mice was not affected by 8 weeks’ treatment with tofogliflozin or losartan. Creatinine clearance was significantly higher in untreated db/db mice than in db/ + m mice. Data shown are means± SEM (db/db mice, n = 8; db/ + m mice, n = 10). ###P < 0.001 significantly different from control group by t-test. (B) Scatter plot of plasma glucose and creatinine clearance in db/db and db/ + m mice. (C) Kidney weight in db/db mice was not affected by 8 weeks’ treatment with tofogliflozin or losartan. Kidney weight was significantly greater in untreated db/db mice than in db/ + m mice. Data shown are means± SEM (db/db mice, n = 8; db/ + m mice, n = 10). ###P < 0.001 significantly different from control group by t-test. (D) Scatter plot of plasma glucose and kidney weight in db/db and db/ + m mice.
The kidney weight of the db/db mice (control group) was significantly greater than that of db/ + m mice. Neither tofogliflozin nor losartan treatment reduced the kidney weight, and there was no clear relationship between the glucose levels and the kidney weight in db/db mice (Figure 4C, D).
The renoprotective effect of tofogliflozin was also assessed by histopathological analysis (Figures 5A, 6A). The mean glomerular area was significantly larger in the untreated db/db mice than in the db/ + m mice. Tofogliflozin treatment significantly attenuated glomerular hypertrophy in a dose-dependent manner, whereas losartan treatment had no effect on the glomerular size (Figure 5B). Both in the PAS- and type IV collagen-stained sections, the mesangial matrix area was also significantly greater in the untreated db/db mice than in the db/ + m mice. Neither tofogliflozin nor losartan significantly altered the mesangial expansion (Figures 5C, 6B).
Figure 5.
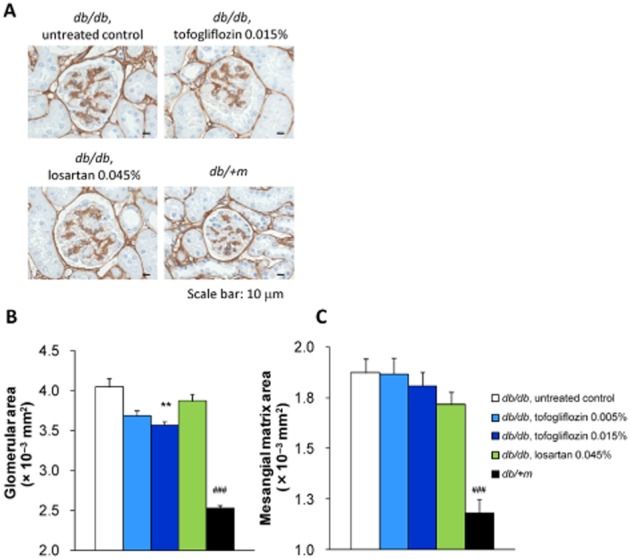
Histological analysis of glomerulus at 8 weeks of treatment (1). (A) Kidney sections were stained with anti-type IV collagen antibody. Representative images are shown (scale bar, 10 μm). (B–C) Kidney sections from each mouse were stained with anti-type IV collagen antibody. Glomerular size and mesangial matrix area were determined by imaging analysis. (B) Treatment with the diet containing tofogliflozin (0.015% ) significantly prevented glomerular expansion in db/db mice. (C) Mesangial matrix area was significantly lower in db/ + m mice than in untreated db/db mice. Tofogliflozin and losartan treatment had no effect on type IV collagen-positive area. Data shown are means± SEM (db/db mice, n = 8; db/ + m mice, n = 10). **P < 0.01 significantly different from control group by Dunnett's multiple comparison test. ###P < 0.001 significantly different from control group by t-test.
Figure 6.
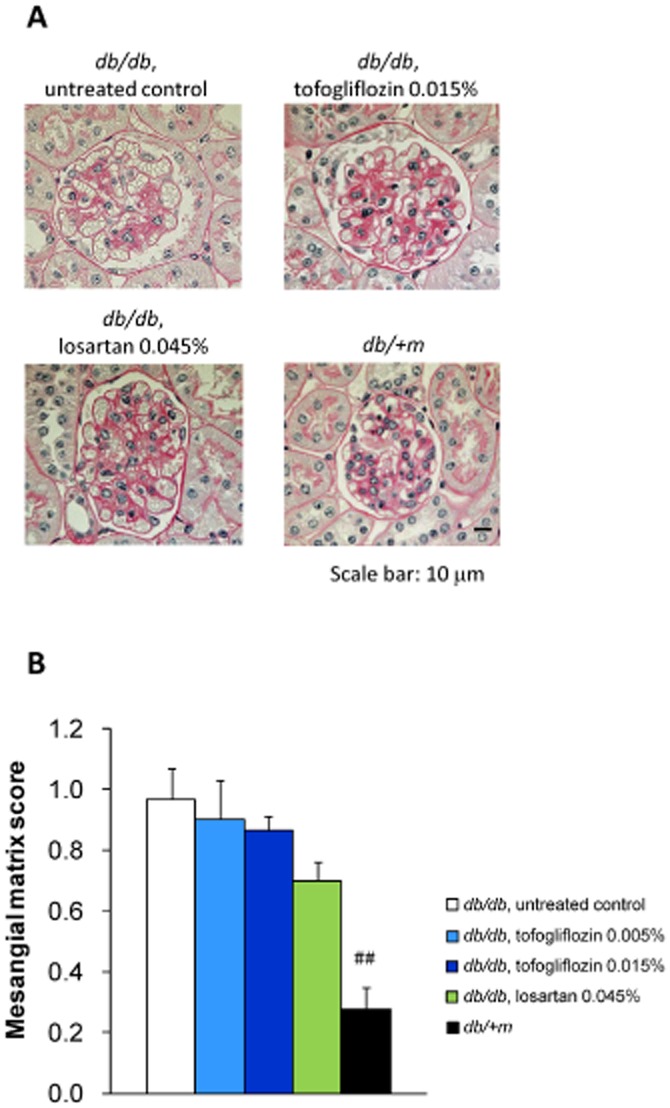
Histological analyses of glomeruli at 8 weeks of treatment (2). (A) Kidney sections were stained with PAS. Representative images are shown (scale bar, 10 μm). (B) Kidney sections from each mouse were stained with PAS. Mesangial matrix area was determined by scoring. Mesangial matrix area was significantly lower in db/ + m mice than in untreated db/db mice. Tofogliflozin and losartan treatment had no effect on the expansion of mesangial matrix area. Data shown are means± SEM (db/db mice, n = 8; db/ + m mice, n = 10). ##P < 0.01 significantly different from control group by t-test.
The effect of long-term tofogliflozin administration on beta-cell function
The levels of plasma immunoreactive insulin (IRI) in the untreated db/db mice decreased from 9.9 ± 2.4 ng·mL−1 at the start of study to 2.0 ± 0.3 ng·mL−1 at week 8 (P < 0.05). Tofogliflozin treatment prevented the decrease in IRI levels and resulted in a significant increase in IRI levels, compared with the untreated group at 8 weeks of treatment. Losartan treatment had no effect on IRI level (Figure 7A). To assess the potential for preventing beta-cell loss by improving hyperglycaemia, the total beta-cell mass was determined from the proportion of the toal pancreatic are that stained positively for insulin (insulin- positive ratio). The total beta-cell mass was significantly larger in the untreated db/db mice than in the db/ + m mice at the start of the study (Figure 7B, C). After 8 weeks, the beta-cells of untreated db/db mice were degraded and the total beta-cell mass was significantly reduced compared with that of control lean mice, implying beta-cell loss in the db/db mice. Tofogliflozin treatment significantly and dose-dependently elevated the total beta-cell mass, suggesting that beta-cell loss was prevented (Figure 7D, E).
Figure 7.
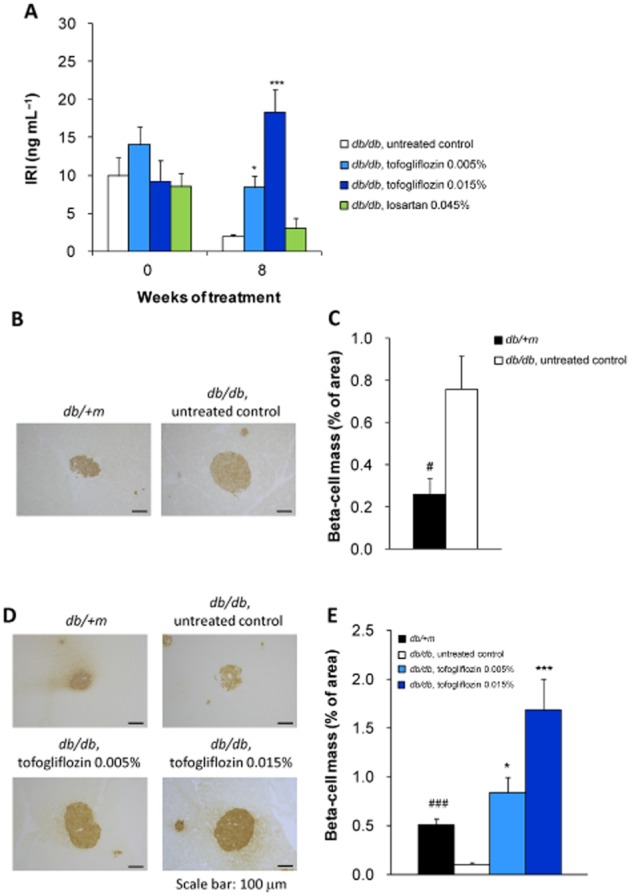
Mean plasma insulin concentration and histological analysis of pancreatic beta-cell mass. (A) Tofogliflozin treatment increased plasma insulin levels (IRI) in db/db mice. (B–E) Total beta-cell mass was calculated from the insulin-positive area of pancreatic sections. Total beta-cell mass (% of total pancreatic area) was significantly smaller in db/ + m mice than in db/db mice at the start of the study (B, C). Total beta-cell mass was significantly higher in the tofogliflozin treatment groups than in the control group at the end of the study (D, E). Data shown are means± SEM (db/db mice, n = 8; db/ + m mice, n = 10). *P < 0.05, ***P < 0.001 significantly different from control group by Dunnett's multiple comparison test. #P < 0.05, ###P < 0.001 significantly different from control group by t-test.
Discussion and conclusion
Several SGLT inhibitors are being developed as a new class of anti-diabetic agents. Studies in db/db-SGLT2−/− mice (Jurczak et al., 2011) and studies of SGLT inhibitors such as T-1095 (Arakawa et al., 2001) and remogliflozin (Fujimori et al., 2008) in db/db mice have suggested that long-term inhibition of SGLT might exert a protective effect on kidneys and beta-cells in type 2 diabetes. However, the actual renoprotective effects exerted via SGLT2 inhibition are unclear owing to the lack of positive renoprotective effects in the study on the non-selective SGLT1/2 inhibitor T-1095 (Arakawa et al., 2001) and the lack of parameters on renal function in the study on long-term SGLT2 inhibition (Jurczak et al., 2011).
To evaluate the renoprotective effects of long-term SGLT2 inhibition more precisely, we compared the effects of tofogliflozin (a highly specific SGLT2 inhibitor) with the effects of losartan, (angiotensin II receptor antagonist), on renal and beta-cell functions, together with a quantitative analysis of glomerular and islet beta-cell mass. We demonstrated that long-term SGLT2 inhibition with tofogliflozin prevented not only loss of islet β-cells, but also the progression of renal impairment in db/db mice.
In this study, sustained blood glucose-lowering effects and stably reduced glycated Hb levels were observed over 4–8 weeks of treatment with tofogliflozin together with a significant increase in glucose clearance (Figure 1A, B, E), suggesting that stable long-term glycaemic control can be achieved by tofogliflozin treatment. Based on the measured concentrations of tofogliflozin in plasma in the mice (0.015% tofogliflozin group) and the protein-binding properties of tofogliflozin, we estimated the unbound tofogliflozin concentrations to be between 120 and 350 nM. These concentrations are about 24–70 times the IC50 value of tofogliflozin against mouse SGLT2 (5.0 nM) and one-fifteenth to one-fifth of its IC50 value against mouse SGLT1 (1800 nM; Suzuki et al., 2012). Therefore, the unbound concentrations of tofogliflozin mentioned earleir are sufficient to inhibit mouse SGLT2 almost completely, but not to inhibit mouse SGLT1.
DN is a major cause of chronic kidney failure and end-stage renal disease in diabetic patients. Renal failure caused by chronic hyperglycaemia via metabolic factors, such as increased oxidative stress, renal polyol formation and advanced glycated end-products (Cooper, 2001), is a major micro-vascular complication in type 2 diabetes patients, and intensive glycaemic control to prevent the progression of DN is recommended (The DCCT Research Group, 1993; UKPDS Group, 1998; National Kidney Foundation, 2007; American Diabetes Association, 2013). In addition to metabolic factors, the haemodynamic factors of increased systemic and intraglomerular pressure are also implicated in the pathogenesis of DN (Forbes et al., 2007; Dronavalli et al., 2008). The db/db mouse has been used as an animal model of type 2 diabetes that develops progressive kidney disease similar to human DN (Breyer et al., 2005; Soler et al., 2012). In db/db mice, glomerular hyperfiltration during the early stage of diabetes has been reported (Gartner, 1978; Sugaru et al., 2006b), which was also suggested by the increased creatinine clearance in db/db mice in this study (Figure 4A). Although several discrepancies have been noted between the severity of nephropathy in this mouse strain and that in humans, a number of basic and novel therapeutic agents have been investigated in db/db mice and been found to reduce the progression of renal failure with decreased albuminuria (Tesch and Lim, 2011).
Arakawa et al. (2001) reported that albuminuria and mesangial expansion were improved in db/db mice treated with another SGLT2 inhibitor, T-1095. However, their study did not compare any renal function parameters (including glomerular filtration rate) after treatment with clinically validated anti-nephropathy drugs, such as angiotensin II receptor antagonists. Moreover, the selectivity of T-1095 towards SGLT2 versus SGLT1 is low (Oku et al., 1999). Therefore, the precise potential of SGLT2 inhibition for the treatment of DN was still unknown. To address this issue, we compared the renoprotective effects of tofogliflozin in db/db mice with those of losartan, which has been shown to suppress the increase in urinary albumin excretion until 17 weeks of age (Sugaru et al., 2006a). We found that 8-week treatment with either tofogliflozin or losartan was equally effective in preventing the increase in creatinine-corrected urinary albumin excretion (ACR), an important marker of glomerular dysfunction. Considering that the actual plasma concentration of tofogliflozin in the db/db mice was sufficient to inhibit only mSGLT2, we suggest that specific SGLT2 inhibition has the potential to delay the progression of DN. Furthermore, given the concerns with inhibition of SGLT1, such as gastrointestinal side effects, the increased risk of hypoglycaemia and unknown effects with long-term inhibition of this ubiquitous transporter (Washburn and Poucher, 2013), we consider that specific SGLT2 inhibitors have potential as anti-diabetic agents, without safety concerns, for long-term administration.
We confirmed the presence of glomerular hyperfiltration in db/db mice, compared with db/ + m mice, and observed that creatinine clearance tended to be suppressed in both tofogliflozin- and losartan-treated db/db mice. Therefore, we suggest that suppression of glomerular hyperfiltration may contribute to suppressing the increase in urinary albumin excretion. Interestingly, imaging analysis of renal glomeruli revealed that tofogliflozin suppressed glomerular hypertrophy, whereas losartan had no effect on glomerular size. These findings indicate that tofogliflozin and losartan may each suppress the deterioration of renal function via different mechanisms.
Long-term treatment with losartan delayed the progression of nephropathy in db/db mice (Sugaru et al., 2006a). The renoprotective effects of ACE inhibitors andangiotensin II receptor antagonists are mainly considered to be due to the antihypertensive effects they achieve by inhibiting the renin–angiotensin system (Thomas and Atkins, 2006). The blood pressure of db/db mice was reported to be higher than that of db/ + m mice with higher plasma ACE activity and angiotensin II concentration, and the treatment with losartan reduced the blood pressure of db/db mice to the normal range (Senador et al., 2009). In addition, both enalapril, an ACE inhibitor (Moriyama et al., 2004), and valsartan, an angiotensin II receptor antagonist (Dong et al., 2010), exerted their renoprotective effects in db/db mice accompanied by lowering of blood pressure. Therefore, we assume that the renoprotective effect of losartan in our study is mainly due to the reduction of intraglomerular pressure. The mild antihypertensive effect that SGLT inhibitors have on systolic blood pressure has also been reported following phlorizin treatment in a STZ/high-salt diet model (Osorio et al., 2010) and dapagliflozin treatment in patients with type 2 diabetes (Wilding et al., 2009; Bailey et al., 2010).
Tofogliflozin showed a sustained lowering of blood glucose in db/db mice, whereas losartan had no effect on glucose levels (Figure 1A, B). Therefore, reduction of glucose toxicity by tofogliflozin may contribute to the differences in renoprotective effect between losartan and tofogliflozin mentioned earlier. Recently empagliflozin, an SGLT2 inhibitor, was reported to reduce the inflammatory and fibrotic markers in human kidney proximal tubular cells by blocking glucose entry (Panchapakesan et al., 2013). The amelioration of hyperglycaemic conditions in the proximal tubular cells by SGLT2 inhibition might explain the difference in the renoprotective effects between losartan and tofogliflozin.
The contribution of the tubuloglomerular feedback (TGF) system in early DN has been well investigated in STZ-induced diabetic models in rodents (Vallon et al., 2003). The enhanced Na+ reabsorption coinciding with higher reabsorption of filtered glucose through SGLT1/2 that occurs in the diabetic state, compared with that in the normoglycaemic state, reduces the TGF signal at the macula densa, leading to an increase in single nephron glomerular filtration rate (Vallon and Thomson, 2012). More recently, Vallon et al. showed that the knockout of SGLT2 attenuated hyperglycaemia and glomerular hyperfiltration, thus preventing the increase in ACR of STZ diabetic mice, and they suggested that the TGF system contributed to these effects (Vallon et al., 2013). However, in their study, the SGLT2 knockout showed no effect on kidney growth or on the marker of renal injury. In this study, we also observed that the increased ACR was attenuated by tofogliflozin with a long-term improvement of hyperglycaemic condition and tendency towards a decrease in hyperfiltration without reducing kidney weight. Considering the up-regulation of SGLT2 in the kidney of db/db mice (Vallon et al., 2013), we assume that the TGF system may contribute to hyperfiltration of db/db mice.
Taken together, there are at least two mechanisms by which SGLT inhibition could reduce glomerular hyperfiltration and the increase of ACR. One is the improvement of TGF signalling and the other is the reduction of systolic blood pressure. Further detailed characterization, using, for instance, the micro-puncture technique, is required to address the precise mechanisms involved in the reduction of glomerular hypertrophy with long-term tofogliflozin treatment.
A reduction in body weight by SGLT2 inhibition through a negative energy balance was confirmed in a human clinical study (Zhang et al., 2010) and in diet-induced and genetically obese rodents (Devenny et al., 2012; Liang et al., 2012). Paradoxically, in the present study, the body weight of tofogliflozin-treated db/db mice increased gradually throughout the study, with increased food consumption (Figure 2B), whereas the untreated db/db mice showed no weight gain after 10 weeks of age with no increase in food consumption. Thus there was a significant increase in body weight in the tofogliflozin groups compared with the untreated group after 4 weeks (Figure 2A). Hyperphagia has been induced in rodents by inhibiting SGLT2, both in diet-induced obese rats treated with an SGLT2 inhibitor (Devenny et al., 2012) and in SGLT2 knock-out mice (Vallon et al., 2013). In addition, similar weight gain and preserved plasma insulin levels were also reported for db/db mice treated with other SGLT inhibitors, such as T-1095 (Arakawa et al., 2001) and remogliflozin (Fujimori et al., 2008). Because the plasma IRI levels of the untreated db/db mice decreased markedly from 0 to 8 weeks of treatment, the lack of further body weight gain in untreated db/db mice may be due to the decreased insulin secretion, which is consistent with the previous reports on the disease progression of db/db mice (Gibbs et al., 1995; Lenhard et al., 1999). On the other hand, plasma insulin secretion was significantly preserved in tofogliflozin-treated db/db mice (Figure 7A). These results imply that the preserved insulin levels in the tofogliflozin groups would have maintained the anabolic actions of insulin in db/db mice, leading to the increased food consumption and body weight (Figure 2A, B). Although modest but significant body weight reductions by SGLT2 inhibitors, including tofogliflozin, were observed both in type 2 diabetes patients (Kadowaki et al., 2012; Wilding et al., 2012; Fonseca et al., 2013; Schernthaner et al., 2013) and in diet-induced obese rats (Devenny et al., 2012) and KKAy mice, a mouse model of type 2 diabetes without beta-cell loss with aging (Katsuno et al., 2009), further evaluations will be needed to understand the interactions among UGE, appetite and insulin secretion of type 2 diabetes patients treated with SGLT2 inhibitors.
In an earlier study, we reported that tofogliflozin had no direct effect on glucose-stimulated insulin secretion by isolated pancreatic islets (Suzuki et al., 2012). Imaging analysis revealed that beta-cell mass was significantly increased in tofogliflozin-treated db/db mice (Figure 7D, E), implying that preserved islet mass may contribute to maintaining the plasma insulin secretion. The preserved beta-cell function of db/db-SGLT2−/−mice was associated with increased beta-cell mass and reduced incidence of beta-cell apoptosis (Jurczak et al., 2011). The plasma tofogliflozin concentrations measured in the 0.015% tofogliflozin group were sufficient to specifically inhibit mSGLT2. Therefore, it is likely that increased beta-cell mass in tofogliflozin-treated db/db mice was caused by mechanisms similar to those in SGLT2-/- db/db mice. Because no human clinical studies have directly addressed the effect of SGLT2 inhibitors on beta-cell loss, this beneficial effect remains to be determined in human type 2 diabetes.
Several study limitations should be considered in this study. First, the lack of haemodynamic data from the db/db mice means that the mechanisms of the renoprotective effects of losartan and tofogliflozin through their haemodynamic effects discussed earlier are speculative. Second, although the mechanisms underlying the reduction of ACR with tofogliflozin are considered to be closely related to its lowering of blood glucose, exactly how much of the action of tofogliflozin is dependent on the decrease of glucose toxicity and how much independent of glucose, remains to be elucidated.
In conclusion, we have provided evidence for prevention of kidney and pancreatic dysfunctions in a mouse model of type 2 diabetes by long-term SGLT2 inhibition with tofogliflozin. Further studies are required to evaluate the therapeutic usefulness of tofogliflozin for preservation of renal function and beta-cells in patients with type 2 diabetes.
Acknowledgments
We thank Mizuki Yamane and Tetsuya Mitsui (employees of Chugai Pharmaceutical Co., Ltd.) for their contribution to determination of plasma tofogliflozin concentration; Ryota Saito, Kasumi Takahashi, Taeko Hasegawa, Miho Nanba, and Naoto Toyota (employees of Chugai Research Institute for Medical Science, Inc.) for their assistance with the biochemical analysis of plasma and urine; Tatsuo Yata and Mio Kawai (employees of Chugai Research Institute for Medical Science, Inc.), Marii Yamamoto, Hiroyasu Muramatsu, Masao Matsuo, Nobuhiro Ban, Yasuhiro Ichida, Kenichi Ozaki, Fumihiko Ichikawa, and Kazuharu Ozawa (employees of Chugai Pharmaceutical Co., Ltd.) for their assistance with conducting the animal experiments and excellent technical assistance; and Naoshi Fukushima and Sachiya Ikeda (employees of Chugai Pharmaceutical Co., Ltd.) for critical discussions.
Glossary
- ACR
albumin/creatinine ratio
- DAB
diaminobenzidine
- DN
diabetic nephropathy
- HE
hematoxylin–eosin
- IRI
immunoreactive insulin
- PG
plasma glucose
- SGLT2
sodium–glucose co-transporter 2
- STZ
streptozotocin
- TGF
tubuloglomerular feedback
- UGE
urinary glucose excretion
Conflict of interest
All authors are employees of Chugai Pharmaceutical Co., Ltd. or its affiliate company Chugai Research Institute for Medical Science, Inc.
Supporting information
Additional Supporting Information may be found in the online version of this article at the publisher's web-site:
Figure S1. Scatter plot of plasma glucose and UGE levels in db/db and db/ + m mice. (A) 0 weeks (baseline value), (B) 4 weeks of treatment, (C) 8 weeks of treatment symbols represent individual values.
Figure S2. Scatter plot of body weight and food consumption in db/db mice. (A) 0 weeks (baseline value), (B) 4 weeks of treatment, (C) 8 weeks of treatment symbols represent individual values.
References
- American Diabetes Association. Standards of medical care in diabetes – 2013. Diabetes Care. 2013;36(Suppl. 1):S11–S66. doi: 10.2337/dc13-S011. [DOI] [PMC free article] [PubMed] [Google Scholar]
- Arakawa K, Ishihara T, Oku A, Nawano M, Ueta K, Kitamura K, et al. Improved diabetic syndrome in C57BL/KsJ-db/db mice by oral administration of the Na(+)-glucose cotransporter inhibitor T-1095. Br J Pharmacol. 2001;132:578–586. doi: 10.1038/sj.bjp.0703829. [DOI] [PMC free article] [PubMed] [Google Scholar]
- Bailey CJ, Gross JL, Pieters A, Bastien A, List JF. Effect of dapagliflozin in patients with type 2 diabetes who have inadequate glycaemic control with metformin: a randomised, double-blind, placebo-controlled trial. Lancet. 2010;375:2223–2233. doi: 10.1016/S0140-6736(10)60407-2. [DOI] [PubMed] [Google Scholar]
- Breyer MD, Bottinger E, Brosius FC, 3rd, Coffman TM, Harris RC, Heilig CW, et al. Mouse models of diabetic nephropathy. J Am Soc Nephrol. 2005;16:27–45. doi: 10.1681/ASN.2004080648. [DOI] [PubMed] [Google Scholar]
- Chao EC, Henry RR. SGLT2 inhibition – a novel strategy for diabetes treatment. Nat Rev Drug Discov. 2010;9:551–559. doi: 10.1038/nrd3180. [DOI] [PubMed] [Google Scholar]
- Chen J, Williams S, Ho S, Loraine H, Hagan D, Whaley JM, et al. Quantitative PCR tissue expression profiling of the human SGLT2 gene and related family members. Diabetes Ther. 2010;1:57–92. doi: 10.1007/s13300-010-0006-4. [DOI] [PMC free article] [PubMed] [Google Scholar]
- Cooper ME. Interaction of metabolic and haemodynamic factors in mediating experimental diabetic nephropathy. Diabetologia. 2001;44:1957–1972. doi: 10.1007/s001250100000. [DOI] [PubMed] [Google Scholar]
- Devenny JJ, Godonis HE, Harvey SJ, Rooney S, Cullen MJ, Pelleymounter MA. Weight loss induced by chronic dapagliflozin treatment is attenuated by compensatory hyperphagia in diet-induced obese (DIO) rats. Obesity (Silver Spring) 2012;20:1645–1652. doi: 10.1038/oby.2012.59. [DOI] [PubMed] [Google Scholar]
- Dong YF, Liu L, Lai ZF, Yamamoto E, Kataoka K, Nakamura T, et al. Aliskiren enhances protective effects of valsartan against type 2 diabetic nephropathy in mice. J Hypertens. 2010;28:1554–1565. doi: 10.1097/HJH.0b013e328338bb11. [DOI] [PubMed] [Google Scholar]
- Dronavalli S, Duka I, Bakris GL. The pathogenesis of diabetic nephropathy. Nat Clin Pract Endocrinol Metab. 2008;4:444–452. doi: 10.1038/ncpendmet0894. [DOI] [PubMed] [Google Scholar]
- Dunn SR, Qi Z, Bottinger EP, Breyer MD, Sharma K. Utility of endogenous creatinine clearance as a measure of renal function in mice. Kidney Int. 2004;65:1959–1967. doi: 10.1111/j.1523-1755.2004.00600.x. [DOI] [PubMed] [Google Scholar]
- Ferrannini E, Solini A. SGLT2 inhibition in diabetes mellitus: rationale and clinical prospects. Nat Rev Endocrinol. 2012;8:495–502. doi: 10.1038/nrendo.2011.243. [DOI] [PubMed] [Google Scholar]
- Fonseca VA, Ferrannini E, Wilding JP, Wilpshaar W, Dhanjal P, Ball G, et al. Active- and placebo-controlled dose-finding study to assess the efficacy, safety, and tolerability of multiple doses of ipragliflozin in patients with type 2 diabetes mellitus. J Diabetes Complications. 2013;27:268–273. doi: 10.1016/j.jdiacomp.2012.11.005. [DOI] [PubMed] [Google Scholar]
- Forbes JM, Fukami K, Cooper ME. Diabetic nephropathy: where hemodynamics meets metabolism. Exp Clin Endocrinol Diabetes. 2007;115:69–84. doi: 10.1055/s-2007-949721. [DOI] [PubMed] [Google Scholar]
- Fujimori Y, Katsuno K, Nakashima I, Ishikawa-Takemura Y, Fujikura H, Isaji M. Remogliflozin etabonate, in a novel category of selective low-affinity sodium glucose cotransporter (SGLT2) inhibitors, exhibits antidiabetic efficacy in rodent models. J Pharmacol Exp Ther. 2008;327:268–276. doi: 10.1124/jpet.108.140210. [DOI] [PubMed] [Google Scholar]
- Gartner K. Glomerular hyperfiltration during the onset of diabetes mellitus in two strains of diabetic mice (c57bl/6j db/db and c57bl/ksj db/db. Diabetologia. 1978;15:59–63. doi: 10.1007/BF01219330. [DOI] [PubMed] [Google Scholar]
- Gibbs EM, Stock JL, McCoid SC, Stukenbrok HA, Pessin JE, Stevenson RW, et al. Glycemic improvement in diabetic db/db mice by overexpression of the human insulin-regulatable glucose transporter (GLUT4) J Clin Invest. 1995;95:1512–1518. doi: 10.1172/JCI117823. [DOI] [PMC free article] [PubMed] [Google Scholar]
- Guo C, Martinez-Vasquez D, Mendez GP, Toniolo MF, Yao TM, Oestreicher EM, et al. Mineralocorticoid receptor antagonist reduces renal injury in rodent models of types 1 and 2 diabetes mellitus. Endocrinology. 2006;147:5363–5373. doi: 10.1210/en.2006-0944. [DOI] [PubMed] [Google Scholar]
- Han S, Hagan DL, Taylor JR, Xin L, Meng W, Biller SA, et al. Dapagliflozin, a selective SGLT2 inhibitor, improves glucose homeostasis in normal and diabetic rats. Diabetes. 2008;57:1723–1729. doi: 10.2337/db07-1472. [DOI] [PubMed] [Google Scholar]
- Jurczak MJ, Lee HY, Birkenfeld AL, Jornayvaz FR, Frederick DW, Pongratz RL, et al. SGLT2 deletion improves glucose homeostasis and preserves pancreatic beta-cell function. Diabetes. 2011;60:890–898. doi: 10.2337/db10-1328. [DOI] [PMC free article] [PubMed] [Google Scholar]
- Kadowaki T, Ikeda S, Takano Y, Cynshi O, Christ AD, Boerlin V, et al. Tofogliflozin, a novel and selective SGLT2 inhibitor improves glycemic control and lowers body weight in patients with type 2 diabetes mellitus inadequately controlled on stable metformin or diet and exercise alone. Diabetes. 2012;61(Suppl. 1):A22. (80-OR) [Google Scholar]
- Kahn SE. The relative contributions of insulin resistance and beta-cell dysfunction to the pathophysiology of Type 2 diabetes. Diabetologia. 2003;46:3–19. doi: 10.1007/s00125-002-1009-0. [DOI] [PubMed] [Google Scholar]
- Kanai Y, Lee WS, You G, Brown D, Hediger MA. The human kidney low affinity Na+/glucose cotransporter SGLT2. Delineation of the major renal reabsorptive mechanism for d-glucose. J Clin Invest. 1994;93:397–404. doi: 10.1172/JCI116972. [DOI] [PMC free article] [PubMed] [Google Scholar]
- Katsuno K, Fujimori Y, Ishikawa-Takemura Y, Isaji M. Long-term treatment with sergliflozin etabonate improves disturbed glucose metabolism in KK-A(y) mice. Eur J Pharmacol. 2009;618:98–104. doi: 10.1016/j.ejphar.2009.07.001. [DOI] [PubMed] [Google Scholar]
- Kilkenny C, Browne W, Cuthill IC, Emerson M, Altman DG. Animal research: reporting in vivo experiments: the ARRIVE guidelines. Br J Pharmacol. 2010;160:1577–1579. doi: 10.1111/j.1476-5381.2010.00872.x. [DOI] [PMC free article] [PubMed] [Google Scholar]
- Lenhard JM, Lancaster ME, Paulik MA, Weiel JE, Binz JG, Sundseth SS, et al. The RXR agonist LG100268 causes hepatomegaly, improves glycaemic control and decreases cardiovascular risk and cachexia in diabetic mice suffering from pancreatic beta-cell dysfunction. Diabetologia. 1999;42:545–554. doi: 10.1007/s001250051193. [DOI] [PubMed] [Google Scholar]
- Liang Y, Arakawa K, Ueta K, Matsushita Y, Kuriyama C, Martin T, et al. Effect of canagliflozin on renal threshold for glucose, glycemia, and body weight in normal and diabetic animal models. PLoS ONE. 2012;7:e30555. doi: 10.1371/journal.pone.0030555. [DOI] [PMC free article] [PubMed] [Google Scholar]
- Marchetti P, Lupi R, Del Guerra S, Bugliani M, D'Aleo V, Occhipinti M, et al. Goals of treatment for type 2 diabetes: beta-cell preservation for glycemic control. Diabetes Care. 2009;32(Suppl. 2):S178–S183. doi: 10.2337/dc09-S306. [DOI] [PMC free article] [PubMed] [Google Scholar]
- McGrath J, Drummond G, McLachlan E, Kilkenny C, Wainwright C. Guidelines for reporting experiments involving animals: the ARRIVE guidelines. Br J Pharmacol. 2010;160:1573–1576. doi: 10.1111/j.1476-5381.2010.00873.x. [DOI] [PMC free article] [PubMed] [Google Scholar]
- Moriyama T, Oka K, Ueda H, Imai E. Nilvadipine attenuates mesangial expansion and glomerular hypertrophy in diabetic db/db mice, a model for type 2 diabetes. Clin Exp Nephrol. 2004;8:230–236. doi: 10.1007/s10157-004-0303-1. [DOI] [PubMed] [Google Scholar]
- National Kidney Foundation. KDOQI clinical practice guidelines and clinical practice recommendations for diabetes and chronic kidney disease. Am J Kidney Dis. 2007;49:S12–154. doi: 10.1053/j.ajkd.2006.12.005. [DOI] [PubMed] [Google Scholar]
- Ohtake Y, Sato T, Kobayashi T, Nishimoto M, Taka N, Takano K, et al. Discovery of tofogliflozin, a novel C-arylglucoside with an O-spiroketal ring system, as a highly selective sodium glucose cotransporter 2 (SGLT2) inhibitor for the treatment of type 2 diabetes. J Med Chem. 2012;55:7828–7840. doi: 10.1021/jm300884k. [DOI] [PubMed] [Google Scholar]
- Oku A, Ueta K, Arakawa K, Ishihara T, Nawano M, Kuronuma Y, et al. T-1095, an inhibitor of renal Na+-glucose cotransporters, may provide a novel approach to treating diabetes. Diabetes. 1999;48:1794–1800. doi: 10.2337/diabetes.48.9.1794. [DOI] [PubMed] [Google Scholar]
- Osorio H, Bautista R, Rios A, Franco M, Arellano A, Vargas-Robles H, et al. Effect of phlorizin on SGLT2 expression in the kidney of diabetic rats. J Nephrol. 2010;23:541–546. [PubMed] [Google Scholar]
- Panchapakesan U, Pegg K, Gross S, Komala MG, Mudaliar H, Forbes J, et al. Effects of SGLT2 inhibition in human kidney proximal tubular cells – renoprotection in diabetic nephropathy? PLoS ONE. 2013;8:e54442. doi: 10.1371/journal.pone.0054442. [DOI] [PMC free article] [PubMed] [Google Scholar]
- Qi Z, Fujita H, Jin J, Davis LS, Wang Y, Fogo AB, et al. Characterization of susceptibility of inbred mouse strains to diabetic nephropathy. Diabetes. 2005;54:2628–2637. doi: 10.2337/diabetes.54.9.2628. [DOI] [PubMed] [Google Scholar]
- Ruster C, Wolf G. Renin-angiotensin-aldosterone system and progression of renal disease. J Am Soc Nephrol. 2006;17:2985–2991. doi: 10.1681/ASN.2006040356. [DOI] [PubMed] [Google Scholar]
- Schernthaner G, Gross JL, Rosenstock J, Guarisco M, Fu M, Yee J, et al. Canagliflozin compared with sitagliptin for patients with type 2 diabetes who do not have adequate glycemic control with metformin plus sulfonylurea: a 52-week randomized trial. Diabetes Care. 2013;36(9):2508–2515. doi: 10.2337/dc12-2491. [DOI] [PMC free article] [PubMed] [Google Scholar]
- Senador D, Kanakamedala K, Irigoyen MC, Morris M, Elased KM. Cardiovascular and autonomic phenotype of db/db diabetic mice. Exp Physiol. 2009;94:648–658. doi: 10.1113/expphysiol.2008.046474. [DOI] [PMC free article] [PubMed] [Google Scholar]
- Soler MJ, Riera M, Batlle D. New experimental models of diabetic nephropathy in mice models of type 2 diabetes: efforts to replicate human nephropathy. Exp Diabetes Res. 2012 doi: 10.1155/2012/616313. doi: http://dx.doi.org/10.1155/2012/616313. [DOI] [PMC free article] [PubMed] [Google Scholar]
- Sugaru E, Nakagawa T, Ono-Kishino M, Nagamine J, Tokunaga T, Kitoh M, et al. Enhanced effect of combined treatment with SMP-534 (antifibrotic agent) and losartan in diabetic nephropathy. Am J Nephrol. 2006a;26:50–58. doi: 10.1159/000091786. [DOI] [PubMed] [Google Scholar]
- Sugaru E, Nakagawa T, Ono-Kishino M, Nagamine J, Tokunaga T, Kitoh M, et al. SMP-534 ameliorates progression of glomerular fibrosis and urinary albumin in diabetic db/db mice. Am J Physiol Renal Physiol. 2006b;290:F813–F820. doi: 10.1152/ajprenal.00357.2005. [DOI] [PubMed] [Google Scholar]
- Suzuki M, Honda K, Fukazawa M, Ozawa K, Hagita H, Kawai T, et al. Tofogliflozin, a potent and highly specific sodium/glucose cotransporter 2 inhibitor, improves glycemic control in diabetic rats and mice. J Pharmacol Exp Ther. 2012;341:692–701. doi: 10.1124/jpet.112.191593. [DOI] [PubMed] [Google Scholar]
- Tesch GH, Lim AK. Recent insights into diabetic renal injury from the db/db mouse model of type 2 diabetic nephropathy. Am J Physiol Renal Physiol. 2011;300:F301–F310. doi: 10.1152/ajprenal.00607.2010. [DOI] [PubMed] [Google Scholar]
- The DCCT Research Group. The effect of intensive treatment of diabetes on the development and progression of long-term complications in insulin-dependent diabetes mellitus. The Diabetes Control and Complications Trial Research Group. N Engl J Med. 1993;329:977–986. doi: 10.1056/NEJM199309303291401. [DOI] [PubMed] [Google Scholar]
- Thomas MC, Atkins RC. Blood pressure lowering for the prevention and treatment of diabetic kidney disease. Drugs. 2006;66:2213–2234. doi: 10.2165/00003495-200666170-00005. [DOI] [PubMed] [Google Scholar]
- UKPDS Group. Intensive blood-glucose control with sulphonylureas or insulin compared with conventional treatment and risk of complications in patients with type 2 diabetes (UKPDS 33). UK Prospective Diabetes Study (UKPDS) Group. Lancet. 1998;352:837–853. [PubMed] [Google Scholar]
- Vallon V, Thomson SC. Renal function in diabetic disease models: the tubular system in the pathophysiology of the diabetic kidney. Annu Rev Physiol. 2012;74:351–375. doi: 10.1146/annurev-physiol-020911-153333. [DOI] [PMC free article] [PubMed] [Google Scholar]
- Vallon V, Blantz RC, Thomson S. Glomerular hyperfiltration and the salt paradox in early [corrected] type 1 diabetes mellitus: a tubulo-centric view. J Am Soc Nephrol. 2003;14:530–537. doi: 10.1097/01.asn.0000051700.07403.27. [DOI] [PubMed] [Google Scholar]
- Vallon V, Rose M, Gerasimova M, Satriano J, Platt KA, Koepsell H, et al. Knockout of Na-glucose transporter SGLT2 attenuates hyperglycemia and glomerular hyperfiltration but not kidney growth or injury in diabetes mellitus. Am J Physiol Renal Physiol. 2013;304:F156–F167. doi: 10.1152/ajprenal.00409.2012. [DOI] [PMC free article] [PubMed] [Google Scholar]
- Washburn WN, Poucher SM. Differentiating sodium-glucose co-transporter-2 inhibitors in development for the treatment of type 2 diabetes mellitus. Expert Opin Investig Drugs. 2013;22:463–486. doi: 10.1517/13543784.2013.774372. [DOI] [PubMed] [Google Scholar]
- Wilding JP, Norwood P, T'Joen C, Bastien A, List JF, Fiedorek FT. A study of dapagliflozin in patients with type 2 diabetes receiving high doses of insulin plus insulin sensitizers: applicability of a novel insulin-independent treatment. Diabetes Care. 2009;32:1656–1662. doi: 10.2337/dc09-0517. [DOI] [PMC free article] [PubMed] [Google Scholar]
- Wilding JP, Woo V, Soler NG, Pahor A, Sugg J, Rohwedder K, et al. Long-term efficacy of dapagliflozin in patients with type 2 diabetes mellitus receiving high doses of insulin: a randomized trial. Ann Intern Med. 2012;156:405–415. doi: 10.7326/0003-4819-156-6-201203200-00003. [DOI] [PubMed] [Google Scholar]
- Wright EM, Loo DD, Hirayama BA. Biology of human sodium glucose transporters. Physiol Rev. 2011;91:733–794. doi: 10.1152/physrev.00055.2009. [DOI] [PubMed] [Google Scholar]
- Yamamoto K, Uchida S, Kitano K, Fukuhara N, Okumura-Kitajima L, Gunji E, et al. TS-071 is a novel, potent and selective renal sodium-glucose cotransporter 2 (SGLT2) inhibitor with anti-hyperglycaemic activity. Br J Pharmacol. 2011;164:181–191. doi: 10.1111/j.1476-5381.2011.01340.x. [DOI] [PMC free article] [PubMed] [Google Scholar]
- Zhang L, Feng Y, List J, Kasichayanula S, Pfister M. Dapagliflozin treatment in patients with different stages of type 2 diabetes mellitus: effects on glycaemic control and body weight. Diabetes Obes Metab. 2010;12:510–516. doi: 10.1111/j.1463-1326.2010.01216.x. [DOI] [PubMed] [Google Scholar]
Associated Data
This section collects any data citations, data availability statements, or supplementary materials included in this article.