Abstract
BACKGROUND AND PURPOSE
Human prostate growth and function are tightly controlled by androgens that are generally thought to exert their effects by regulating gene transcription. However, a rapid, non-genomic steroid action, often involving an elevation of intracellular calcium ([Ca2+]i), has also been described in a number of cell types. In this study we investigate whether androgens acutely regulate [Ca2+]i in stromal cells derived from the human prostate.
EXPERIMENTAL APPROACH
Human-cultured prostatic stromal cells (HCPSCs) were loaded with the calcium-sensitive fluorophore, fura-2-acetoxymethyl ester (FURA-2AM) (10 μM). Changes in [Ca2+]i in response to the androgens, dihydrotestosterone (DHT) and testosterone, as well as EGF were measured by fluorescence microscopy.
KEY RESULTS
DHT, but not testosterone (0.03–300 nM), elicited concentration-dependent elevations of [Ca2+]i within 1 min of addition. These responses were blocked by the androgen receptor antagonist, flutamide (10 μM); the sarcoplasmic reticulum ATPase pump inhibitor, thapsigargin (1 μM); the inositol trisphosphate receptor inhibitor, 2-aminoethyldiphenyl borate (50 μM) and the PLC inhibitor, U-73122 (1 μM). Responses were also blocked by the L-type calcium channel blocker, nifedipine (1 μM), and by removal of extracellular calcium. A similar transient elevation of [Ca2+]i was elicited by EGF (100 ng·mL−1). The EGF receptor inhibitor, AG 1478 (30 nM), and the MMP inhibitor, marimastat (100 nM), blocked the DHT-induced elevation of [Ca2+]i.
CONCLUSIONS AND IMPLICATIONS
These studies show that DHT elicits an androgen receptor-dependent acute elevation of [Ca2+]i in HCPSC, most likely by activating EGF receptor signalling.
Keywords: human-cultured prostatic stromal cells, intracellular calcium, dihydrotestosterone, EGF, non-genomic androgen signalling
Introduction
Normal prostate growth and development is highly dependent on androgens. The classical mode of steroid action involves binding to intracellular nuclear receptors that, after dissociating from chaperone proteins, translocate to the nucleus and alter expression of androgen-responsive genes (Hiipakka and Liao, 1998). This pathway is relatively slow, taking a minimum of 30 min for effect (Cato et al., 2002), and has been assumed to be responsible for androgen effects in the prostate.
In addition to their genomic actions, androgens have been shown to elicit acute effects through membrane-associated receptors (Farnsworth, 1990). These effects occur within minutes (Bakin et al., 2003; Unni et al., 2004; Bonaccorsi et al., 2004b) and have been reported in a number of cell types including T-cells, osteoblasts, Sertoli cells and the androgen-dependent prostate cancer cell line LNCaP (Steinsapir et al., 1991; Lieberherr and Grosse, 1994; Gorczynska and Handelsman, 1995; Benten et al., 1997). Strangely, no studies have shown acute effects of androgens in prostate stromal cells, which are the primary site of androgen action in the prostate. The prostatic stroma is not only a critical modulator of prostate contractility but it also regulates prostate development, epithelial cell function and the development of prostate cancer (Pennefather et al., 2000; De Wever and Mareel, 2003; Cunha et al., 2004; Franco et al., 2010). In previous studies we have shown that chronic androgen treatment profoundly affects resting intracellular calcium ([Ca2+]i) in human-cultured prostatic stromal cells (HCPSCs) (Oliver et al., 2010), alters sensitivity to α1-adrenoceptor agonists (Nguyen et al., 2007) and activates PKC-dependent growth signalling (Haynes et al., 2001). At the time of these studies our assumption was that these effects were all mediated through traditional genomic actions of androgens. In this study we investigate the possibility that androgen signalling in prostatic stromal cells also occurs through the activation of non-genomic signalling. We now report that dihydrotestosterone (DHT), but not testosterone, elicits a rapid change in [Ca2+]i mediated through an interaction with the EGF receptor (EGFR) signalling pathway.
Methods
Test systems used
Human prostatic stromal cells were grown from primary explant culture as previously described (Haynes et al., 2002; Oliver et al., 2010). Briefly, human prostate tissue samples (excised from benign prostatic hyperplasia patients) were cut into 1 mm3 cubes, plated onto plastic tissue culture dishes and incubated in MCDB-131 supplemented with fetal calf serum (10%), non-essential amino acids (NEAAs; 2%), penicillin (50 IU·mL−1) and streptomycin (50 μg·mL−1) at 37°C (under 5% CO2) for 3–4 weeks. Cells that grew from explants were subsequently cultured in MCDB-131 media containing charcoal-stripped horse serum (10%), HEPES (10 mM), insulin (5 mg·L−1), penicillin (50 IU·mL−1), streptomycin (50 μg·mL−1) and NEAA (2%) and passaged when confluent between four and six times before use. Explant cultures from up to eight different individuals were used in this study.
Measurements made
Cells were cultured on glass coverslips for 24 h in MCDB-131 media containing HEPES (10 mM), NEAAs (2%), BSA (0.1% w/v), penicillin (50 IU·mL−1) and streptomycin (50 μg·mL−1). Imaging studies were undertaken as previously described (Preston and Haynes, 2003; Haynes, 2007). Briefly, on the day of use, cells were incubated in HEPES buffer (of composition mM; NaCl 145; KCl 5; MgSO4 1; HEPES 10; CaCl2 2.5; glucose 10; pH 7.4) containing 0.1% BSA (w/v), and the ratiometric calcium fluorophore, fura-2-acetoxymethyl ester (FURA-2AM) (10 μM), for 30 min at 37°C. Imaging experiments were performed in HEPES buffer containing 0.1% BSA (w/v). A heated stage kept cells at 37°C while they were viewed with a Nikon Eclipse TE2000U microscope (Nikon, Tokyo, Japan) at 10× magnification. Within each field of view, 20−30 cells were chosen and analysis regions drawn within each cell. Cells were alternately illuminated with 340 and 380 nm light for 1 s in a 3 s cycle. Emission was captured at 520 nm using a SPOT-RT camera (Diagnostic Instruments, Sterling Heights, MI, USA) controlled by MetaFluor imaging software (v6.lr5, Universal Imaging Company, Bedford Hills, NY, USA). Background emission values from 340 and 380 nm excitations (measured in a cell-free region) were subtracted from each image. The resultant emission values were expressed as a ratio (340:380 nm) at an interval of 3 s.
Experimental design
The 340:380 nm ratios were calculated for 5 min prior to the addition of ligands to assess baseline activity. To investigate acute responses, vehicle (0.01% ethanol), testosterone (3, 30, 300 nM) or DHT (0.03, 0.30, 3, 30, 300 nM) were added to wells, and changes in fluorescence ratio recorded for a further 5 min. Preliminary studies showed that all responses occurred within the first 1 min of agonist addition; no further activity was seen for up to 20 min. In subsequent experiments, vehicle [0.1 or 0.5% dimethyl sulfoxide (DMSO)], antagonists or modulators of signal transduction pathways were added to wells 10 min prior to the addition of DHT.
Following imaging experiments, cells were fixed with paraformaldehyde (4% w/v) in PBS for 20 min at room temperature. After fixation, cells were washed with PBS and permeabilized with Triton-X (0.1% v/v in PBS; Sigma-Aldrich, Sydney, Australia) for 15 min. Non-specific binding was blocked with BSA (5% w/v) for 30 min before incubating with primary antibodies reactive to smooth muscle α-actin (SMA; DAKO, Glostrup, Denmark), or the combination of mouse anti-EGFR (Abcam, Cambridge, UK) and rabbit phospho-EGFR (Cell Signaling Technology, Inc., Beverly, MA, USA) overnight (4°C). Cells were washed and labelled with Alexa 488- or Alexa 568-conjugated secondary antibodies (Molecular Probes, Life Technologies, Melbourne, Australia) for 2 h (room temperature). Cell nuclei were counter stained with DAPI. For cells labelled with SMA, fluorescence was viewed on a Nikon Eclipse TE2000U (Nikon) epifluorescent microscope at 10× magnification. Cells were illuminated at 340 and 490 nm using a Lambda DG-4 lamp (Sutter Instrument Company, Novato, CA, USA), and images were captured with a CoolSNAPfx low-light camera (Roper Scientific, Tucson, AZ, USA). For cells labelled with EGFR antibodies, fluorescence was viewed on a confocal Nikon Eclipse Ti microscope (Nikon) at 20× or 60× magnification. Cells were illuminated at 405, 488 and 561 nm and images captured with a Nikon A1R scanning camera (Nikon).
Data analysis and statistical procedures
Unless otherwise stated, data are expressed as mean ± SEM and analysed using unpaired t-tests or one-way anova. Significance symbols *, ** and *** denote P < 0.05, 0.01 and 0.001 respectively. For calcium-imaging data, ‘n’ refers to the total number of cells used for measurement followed by the number of experimental replicates (in each replicate, cells cultured from a different individual were used).
Drugs and chemicals
Flutamide, EGF, thapsigargin, nifedipine, testosterone, DHT and FURA-2AM were purchased from Sigma-Aldrich (Sydney, Australia). Ryanodine and AG 1478 were from Calbiochem (Merck Millipore, Melbourne, Australia), Merck. Marimastat and 2-aminoethyldiphenyl borate (2-APB) were from Tocris (Bristol, UK). EGF was reconstituted in PBS containing 0.1% BSA (w/v). AG 1478, FURA-2AM, thapsigargin, nifedipine, ryanodine, marimastat and 2-APB were dissolved in DMSO and frozen as stock solutions. Flutamide, DHT and testosterone were dissolved in ethanol and frozen as stock solutions. All drugs were diluted in HEPES buffer containing 0.1% BSA (w/v) before use. Final vehicle concentrations were not more than 0.1% (v/v). For experiments using 2-APB and AG 1478, the concentration of DMSO was 0.5% (v/v) of the final well volume.
Results
Acute effects of androgens on [Ca2+]i
During imaging experiments, changes in [Ca2+]i were recorded in 20–30 cells in a field of view. Within this population, 70–88% of cells (n = 80–200 cells from four to eight experimental replicates) responded to DHT (3–300 nM), with a rapid (within 1 min of addition) and transient elevation of [Ca2+]i (see Figure 1A for a typical response). The fraction of cells that responded decreased as the concentration of DHT decreased from 3 nM to 30 pM (Figure 1B; P < 0.05, one-way anova Dunnett's post test, n = 80 cells from four individuals). The magnitude of response was consistent across all concentrations of DHT investigated in this study (Figure 1C). Testosterone had no effect on [Ca2+]i at any concentration investigated (3, 30, 300 nM; Figure 1B).
Figure 1.
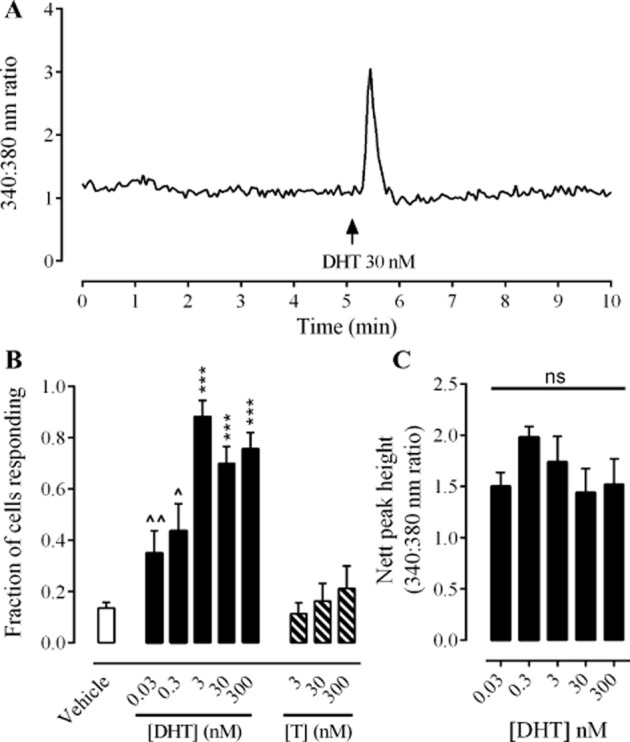
Acute effects of DHT and testosterone on [Ca2+]i in HCPSC. Panel A shows an example trace from a cell exhibiting a transient elevation of [Ca2+]i in response to DHT. Panel B shows the fraction of cells (mean ± SEM) responding to vehicle ( ), DHT (0.03–300 nM;
  ) and testosterone (T, 3–300 nM;
  ). Data sets were analysed by one-way anova, Dunnett's post test, n = 80–200 cells from four to eight experimental replicates. *** denotes P < 0.001 when compared with vehicle control. ∧ and ∧∧ denote P < 0.05 and 0.01, respectively, when compared with 3 nM DHT. Panel C shows the magnitude of responses to DHT (0.03−300 nM) as measured by peak height above baseline (340:380 nm ratio). Data sets were analysed by one-way anova, Bonferroni's post test, n = 80–200 cells from four to eight experimental replicates.
Immediately after calcium imaging, cells were fixed and labelled using an antibody to SMA. Responses to DHT only occurred in a subpopulation of SMA-positive cells; however, not all SMA-positive cells responded to DHT. SMA-negative cells did not respond to DHT with elevations of [Ca2+]i. See Figure 2 for immunofluorescence images and corresponding calcium-imaging traces from SMA-positive and SMA-negative cells.
Figure 2.
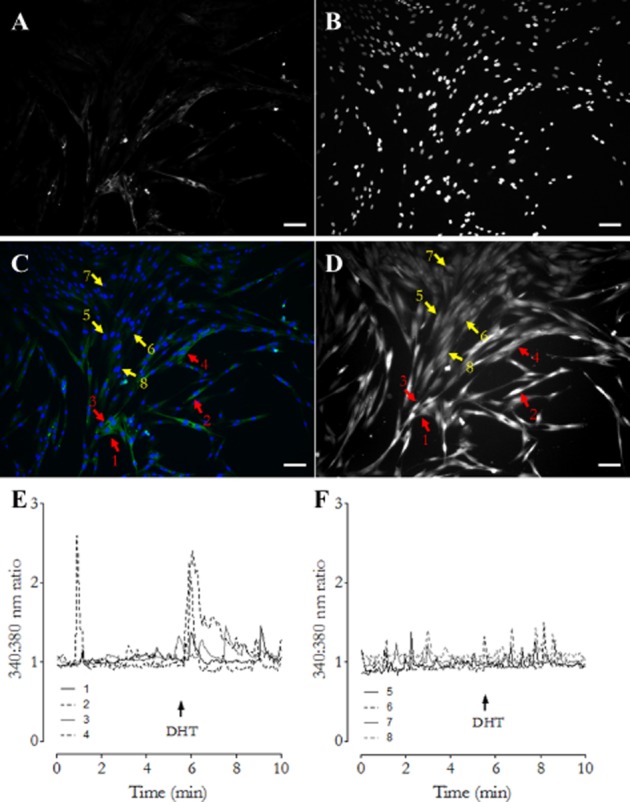
Identification of cells responsive to DHT. Following imaging experiments, cells were fixed and labelled for SMA (A) and cell nuclei counter stained with DAPI (B). Panel C shows a composite image of SMA (green) and DAPI (blue) labelling. Panel D shows the same field of view from calcium-imaging experiments where cells were loaded with the calcium fluorophore FURA-2AM. Arrows 1–4 (red) highlight SMA-positive cells. Arrows 5–8 (yellow) highlight SMA-negative cells. Panel E shows the calcium-imaging trace generated by cells 1–4 (SMA positive). Panel F shows the trace generated by cells 5–8 (SMA negative). In all image panels, scale bars represent 100 μm.
Signal transduction mechanism of the DHT-induced elevation of [Ca2+]i
The DHT (30 nM) effect was blocked by the androgen receptor antagonist, flutamide (10 μM; Figure 3A; P < 0.001, unpaired t-test, n = 80 cells from four individuals); the L-type calcium channel blocker, nifedipine (1 μM); the sarcoendoplasmic reticulum Ca2+ ATPase pump inhibitor, thapsigargin (1 μM) and by the removal of extracellular calcium (Figure 3; P < 0.01, unpaired t-test, n = 80 cells from four individuals).
Figure 3.
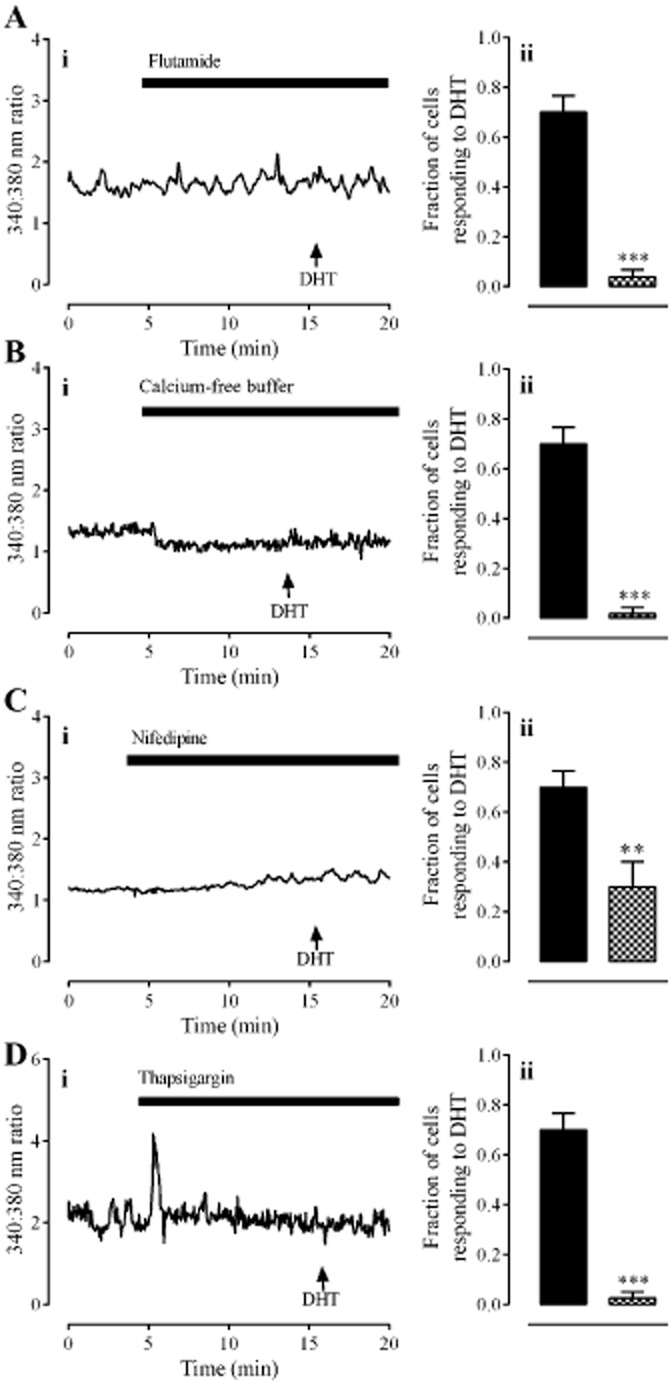
The role of the androgen receptor, extracellular calcium influx and intracellular calcium release in response to DHT (30 nM). Panel A shows the effect of the androgen receptor antagonist, flutamide (10 μM). Panel B shows the effect of removal of extracellular calcium. Panel C shows the effect of the L-type calcium channel inhibitor, nifedipine (1 μM). Panel D shows the effect of the sarco/endoplasmic reticulum Ca2+ ATPase pump inhibitor, thapsigargin (1 μM). In all panels, left hand graphs (i) show typical traces each from one cell. Right hand graphs (ii) show the fraction of cells (mean ± SEM) responding to DHT alone ( ) or in the presence of antagonists/inhibitors or absence of extracellular calcium (
 ). ** and *** denote P < 0.01 and 0.001, respectively, when compared with DHT only (unpaired t-test, n = 80 cells from four individuals).
A large transient elevation of [Ca2+]i, lasting approximately 30 s, occurred after the addition of the inositol trisphosphate (IP3) receptor antagonist, 2-APB (50 μM; Figure 4A), a response most likely attributable to the DMSO vehicle (0.5% v/v) that also has this effect at this concentration. A DMSO-induced elevation of [Ca2+]i is consistent with a previous study that showed DMSO causes calcium release from intracellular stores (Morley and Whitfield, 1993). This vehicle did not however have an effect on subsequent DHT-induced elevations of [Ca2+]i (Supporting Information Figure S1). In contrast, 2-APB prevented the DHT-induced elevation of [Ca2+]i (P < 0.001, unpaired t-test, n = 80 cells from four individuals). Responses to DHT (30 nM) were unaffected by the ryanodine receptor antagonist, ryanodine (1 μM; Figure 4B). DHT (30 nM) did not elicit an elevation of [Ca2+]i in the presence of the PLC inhibitor U-73122 (1 μM; Figure 4C; P < 0.01, unpaired t-test, n = 120 cells from four individuals).
Figure 4.
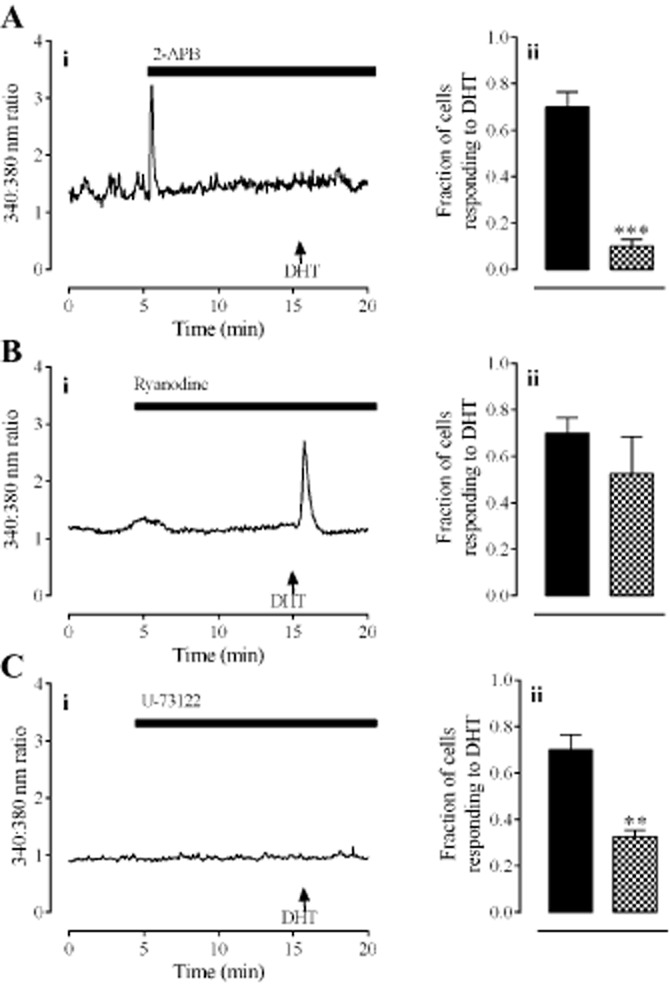
The mechanism of the DHT-mediated release of intracellular calcium. Panel A shows the effect of the IP3 receptor antagonist, 2-APB (50 μM). Panel B shows the effect of the ryanodine receptor antagonist, ryanodine (1 μM). Panel C shows the effect of the PLC inhibitor, U-73122 (1 μM). In all panels, left hand graphs (i) show typical traces each from one cell. Right hand graphs (ii) show the fraction of cells (mean ± SEM) responding to DHT alone ( ) or in the presence of antagonists/inhibitors (
 ). ** and *** denote P < 0.01 and 0.001, respectively, when compared with DHT only (unpaired t-test, n = 80–120 cells from four individuals).
Role of EGFR signalling in response to DHT
Because androgen receptors can activate the EGFR signalling pathway (Sen et al., 2010), we investigated the possibility that DHT utilized this signalling pathway in HCPSCs. The EGFR inhibitor, AG 1478 (30 nM), prevented the DHT-induced elevation of [Ca2+]i (Figure 5A; P < 0.001, unpaired t-test, n = 60 cells from three individuals). Responses to DHT were also inhibited by the broad-spectrum MMP inhibitor, marimastat (100 nM; Figure 5B; P < 0.01 unpaired t-test n = 120 cells from four individuals).
Figure 5.
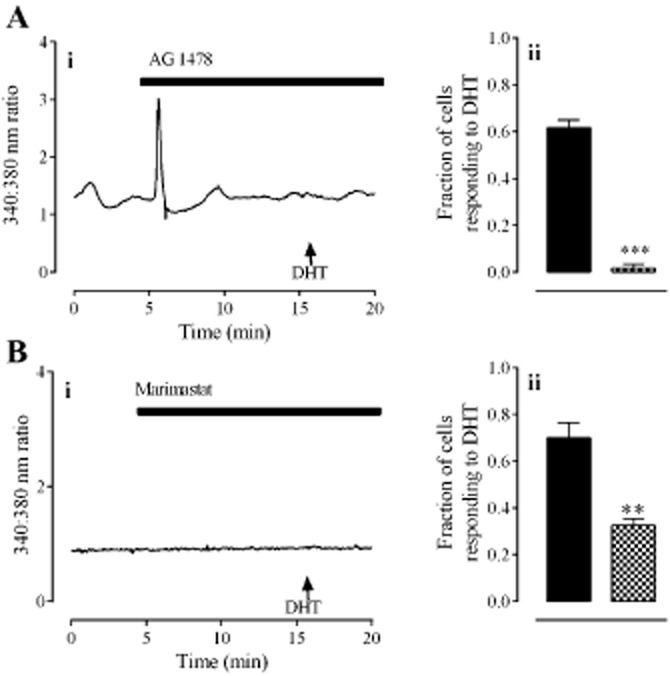
The role of EGFR signalling in responses to DHT. Panel A shows the effect of the EGFR antagonist, AG 1478 (30 nM). Panel B shows the effect of the MMP inhibitor, marimastat (100 nM). In all panels, left hand graphs (i) show typical traces each from one cell. Right hand graphs (ii) show the fraction of cells (mean ± SEM) responding to DHT alone ( ) or in the presence of antagonists/inhibitors (
 ). ** and *** denote P < 0.01 and 0.001, respectively, when compared with DHT only (unpaired t-test, n = 80–120 cells from four individuals).
EGF (100 ng·mL−1) elicited a rapid, transient elevation of [Ca2+]i in 61 ± 3% of cells (Figure 6A). This response was blocked by AG 1478 (30 nM; Figure 6B; P < 0.001, unpaired t-test, n = 60 cells from three individuals) and also by 2-APB (50 μM; Figure 6C). Immunocytochemistry showed that cells from all treatment groups were immunoreactive to antibodies against the EGFR; however, only cells exposed to EGF (100 ng·mL−1) and DHT (30 nM) showed extensive reactivity to anti-phospho-EGFR (Figure 7).
Figure 6.
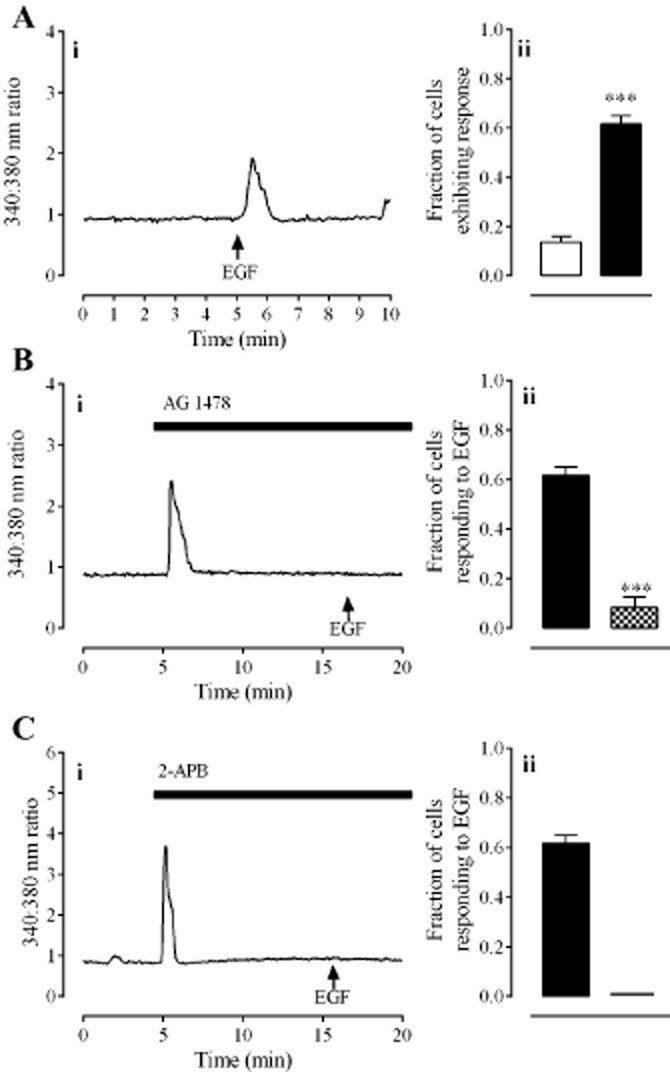
The effect of EGF on [Ca2+]i in HCPSC. Panel A shows responses to EGF (100 ng·mL−1). Panel B shows the effect of AG 1478 (30 nM) on responses to EGF. Panel C shows the effect of 2-APB (50 μM) on responses to EGF. In all panels, left hand graphs (i) show typical traces each from one cell. Right hand graphs (ii) show the fraction of cells (mean ± SEM) responding to vehicle ( ), EGF alone (
 ) or EGF in the presence of antagonists (
 ). *** denotes P < 0.001 when compared with DHT only (unpaired t-test, n = 80–120 cells from four individuals).
Figure 7.
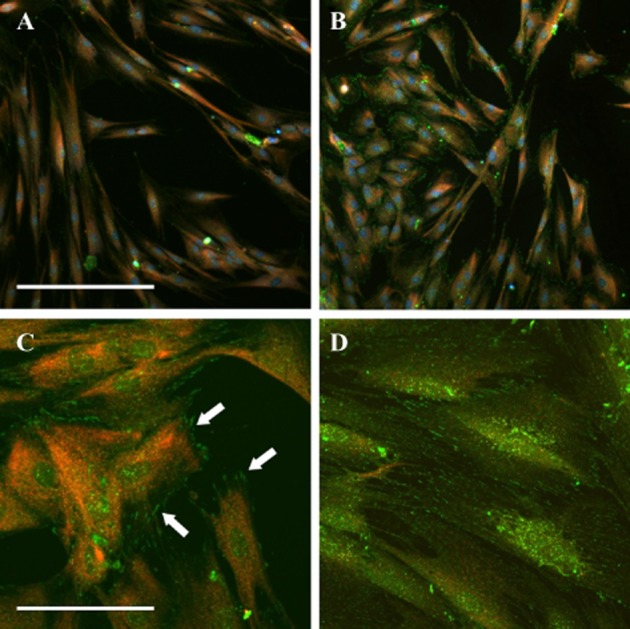
Analysis of EGFR phosphorylation. Cells were fixed within 3 min of addition of vehicle (A), DHT (B, C: 30 nM) or EGF (D: 100 ng·mL−1) and labelled with antibodies against the EGFR (red) and phosphorylated EGFR (green). Images were taken at 20× (A, B) or 60× (C, D) magnification. Arrows highlight phosphorylated EGFR. Scale bars represent 350 μm (A, B) and 50 μm (C, D).
Discussion
Non-genomic effects of DHT and testosterone have been reported in a number of cell types (Steinsapir et al., 1991; Lieberherr and Grosse, 1994; Jaimovich and Espinosa, 2004; Estrada et al., 2006); however, this is the first report of acute regulation of [Ca2+]i by DHT in prostate stromal cells. Previous studies from our laboratory have demonstrated that stromal cell cultures are composed of a heterogeneous population of fibroblasts, myofibroblasts and smooth muscle cells (Oliver et al., 2010). Immunocytochemical analysis revealed that only SMA-positive cells (which constitute approximately 25% of the entire population) could respond to DHT with elevations of [Ca2+]i, indicating that responsive cells are likely to be either smooth muscle cells or myofibroblasts. The morphology of these cells (short and wide with striations) was easily recognizable over the fibroblasts that had a long spindle-like appearance. Cells with smooth muscle-type morphology were selected for measurement during calcium-imaging experiments, where 70–88% responded to DHT with an elevation of [Ca2+]i. Cell responses to DHT consisted of an acute ‘spike’ in [Ca2+]i. While the magnitude of this response was unaffected by the concentration of DHT, the fraction of cells responding was significantly reduced at the lower concentrations of DHT investigated in this study (30 and 300 pM). This suggests that responses can be described by an ‘all-or-nothing’ principle, where a threshold of activation must be reached in order to elicit a quantal response. At lower DHT concentrations the likelihood of a given cell reaching this threshold level is low, leading to a reduction in the number of cells responding.
The androgen receptor antagonist, flutamide, blocked all responses to DHT, indicating that androgens elicit an acute rise in [Ca2+]i specifically through the androgen receptor. This finding is consistent with other studies in which androgens acutely regulate [Ca2+]i through activation of the androgen receptor (Gorczynska and Handelsman, 1995; Steinsapir et al., 1991). The DHT-induced elevation of [Ca2+]i was sensitive to thapsigargin and 2-APB, but not ryanodine, indicating that responses are due to release of calcium from IP3, but not ryanodine receptor-sensitive pools. Responses to DHT were also dependent on extracellular calcium and L-type calcium channels, indicating that calcium influx through L-type channels may be involved in this response. The nature of the DHT-induced elevation of [Ca2+]i (rapid and transient) is consistent with release of calcium from intracellular stores, whereas calcium influx through L-type channels usually results in a more sustained elevation of [Ca2+]i (Lieberherr and Grosse, 1994). Thus, the DHT-induced elevation of [Ca2+]i is most likely due to calcium release from intracellular stores. The dependence on extracellular calcium influx may be explained by a store-operated calcium entry mechanism where extracellular calcium influx may be required to maintain adequate calcium levels in intracellular stores.
The finding that responses were sensitive to blockade of the IP3 receptor implicated PLC activation downstream of the androgen receptor. To test this hypothesis we utilized the PLC inhibitor, U-73122, and found that it blocked responses to DHT. Although our data indicated an androgen receptor-dependent activation of PLC, to date, there has been no reported evidence of such a direct interaction. We felt that the most plausible explanation was that the androgen receptor was coupled through another mediator to activate PLC. The androgen receptor interacts with a variety of proteins, most notably the EGFR (Bonaccorsi et al., 2004a; 2004c), which can activate PLC (Bedrin et al., 1997; Tvorogov and Carpenter, 2002). We therefore hypothesized that the acute DHT-induced elevation of [Ca2+]i in HCPSCs was mediated via some link between the androgen receptor and the EGFR, leading to the subsequent activation of PLC and the release of calcium from IP3 receptor-sensitive pools. We tested this hypothesis using the selective EGFR inhibitor, AG 1478, and found that it blocked the response to DHT, indicating some level of interaction between the androgen receptor and the EGF signalling pathway. This finding was supported by immunocytochemistry that showed punctate-phosphorylated EGFR was localized to specific sites in cells following the addition of DHT but not vehicle. This suggests that the androgen receptor may modulate EGFR signalling at specific sites on the plasma membrane that may be regulated by receptor co- localization in lipid rafts. This possibility represents an interesting avenue for future investigation but is beyond the scope of the current study.
Sen and colleagues (2010) have shown that the androgen receptor can activate EGF signalling via activation of MMPs and release of membrane-bound EGF in LNCaP cells. Consistent with their study, we found that the broad-spectrum MMP inhibitor, marimastat, abolished the acute elevation of [Ca2+]i in response to DHT. To confirm this effect of EGF signalling in HCPSCs, we tested the ability of EGF to elevate [Ca2+]i. Cells responded to EGF with a rapid elevation of [Ca2+]i that was blocked by both AG 1478 and 2-APB, confirming that EGFR activation triggers release of calcium from intracellular stores.
In contrast to DHT, HCPSCs did not respond to testosterone, even at 300 nM, with a similar elevation of [Ca2+]i. This was unexpected because testosterone is the major circulating androgen in human males. Within the prostate, however, testosterone is extensively metabolized by the enzyme 5α-reductase to DHT, which is the predominant intraprostatic androgen (Marks et al., 2008). DHT has around a 10-fold higher affinity than testosterone for [3H]-DHT binding sites on the androgen receptor (Toth and Zakar, 1982), but is only approximately threefold more potent than testosterone in regulating transcription activity (Attardi et al., 2010). Our findings suggest that DHT may activate androgen receptor signalling pathways that are distinct from those activated by testosterone. In support of these findings, a study has shown that androgen receptor phosphorylation at serine 213 is increased by binding of DHT but not testosterone, even when testosterone concentrations were 10-fold greater than DHT (Taneja et al., 2005). The androgen receptor may therefore participate in some form of ligand-directed signalling, where activation of the non-genomic signalling pathway described here may be unique to DHT-androgen receptor interactions.
At this stage, the physiological significance of the DHT-mediated elevation of [Ca2+]i is unknown. However, [Ca2+]i regulates a variety of cell functions including growth factor release, proliferation and differentiation in many cell types including smooth muscle (Holl et al., 1988; Kawanishi et al., 1994; Gu and Spitzer, 1995; Watt et al., 2000; Estrada et al., 2006). The finding that smooth muscle-type cells respond to DHT with an elevation of [Ca2+]i raises possibility that DHT may regulate prostate contractility, growth factor secretion and/or proliferation in these cell types. Our finding that DHT induces the release of EGF from stromal cells may have significant implications for stromal activity because EGF stimulates prostatic stromal cell proliferation in vitro and in vivo (Levine et al., 1992; Torring et al., 2001). This may be mediated by PKC (a downstream target of PLC activation) that has been shown to stimulate proliferation of prostate stromal cells after the addition of androgens to the culture medium (Guh et al., 1998; Haynes et al., 2001). Furthermore, EGF released from stromal cells is likely to exert paracrine effects on neighbouring epithelial cells to promote cancer progression as EGF signalling inhibits apoptosis (Baker and Yu, 2001; She et al., 2005) and promotes the invasion and migration of prostate cancer cell lines in vitro (Jarrard et al., 1994; Mamoune et al., 2004). Our findings suggest that these EGF signalling pathways in the prostate may be controlled, to some extent, by DHT. The strength of this study lies in the simplicity of our approach; we have yet to determine, however, whether similar mechanisms are likely to occur in the prostate in vivo and if they do, what is their significance to prostate biology and pathophysiology.
In summary, we propose the following mechanism by which DHT acutely elevates [Ca2+]i in HCPSC: DHT binds to androgen-sensitive receptors, activating MMPs. The MMPs cleave membrane-bound EGF, which acts as a paracrine/autocrine signal to activate EGFRs, leading to stimulation of PLC and production of IP3. Calcium is subsequently released from IP3 receptor-dependent stores, resulting in a rapid and transient elevation of cytosolic calcium. In conclusion, the current study shows that DHT elicits an acute elevation of [Ca2+]i in smooth muscle cells and/or myofibroblasts cultured from the human prostate, an effect most likely mediated by activation of EGFR signalling. This represents a novel mechanism through which DHT, but not testosterone, may exert effects on the stromal cells of the human prostate.
Glossary
- 2-APB
2-aminoethoxydiphenyl borate
- [Ca2+]i
intracellular calcium
- DHT
dihydrotestosterone
- DMSO
dimethyl sulfoxide
- HCPSCs
human-cultured prostatic stromal cells
- NEAAs
non-essential amino acids
- SMA
smooth muscle α-actin
Conflict of interest
The authors state no conflict of interest.
Supporting information
Additional Supporting Information may be found in the online version of this article at the publisher's web-site:
Figure S1 The effect of DMSO vehicle on responses to DHT. Panel A shows a typical trace from one cell: horizontal bar indicates the presence of DMSO (0.5% v/v); arrow marks time of DHT (30 nM) addition. Panel B shows the fraction of cells (mean ± SEM) responding to DHT in the absence ( ) or presence of DMSO (
 ). Data were analysed by unpaired t-test, P > 0.05, n = 80–120 cells from four to six individuals.
References
- Attardi BJ, Hild SA, Koduri S, Pham T, Pessaint L, Engbring J, et al. The potent synthetic androgens, dimethandrolone (7alpha,11beta-dimethyl-19-nortestosterone) and 11betaβ-methyl-19-nortestosterone, do not require 5alpha-reduction to exert their maximal androgenic effects. J Steroid Biochem Mol Biol. 2010;122:212–218. doi: 10.1016/j.jsbmb.2010.06.009. [DOI] [PMC free article] [PubMed] [Google Scholar]
- Baker NE, Yu SY. The EGF receptor defines domains of cell cycle progression and survival to regulate cell number in the developing Drosophila eye. Cell. 2001;104:699–708. doi: 10.1016/s0092-8674(01)00266-5. [DOI] [PubMed] [Google Scholar]
- Bakin RE, Gioeli D, Sikes RA, Bissonette EA, Weber MJ. Constitutive activation of the Ras/mitogen-activated protein kinase signaling pathway promotes androgen hypersensitivity in LNCaP prostate cancer cells. Cancer Res. 2003;63:1981–1989. [PubMed] [Google Scholar]
- Bedrin MS, Abolafia CM, Thompson JF. Cytoskeletal association of epidermal growth factor receptor and associated signaling proteins is regulated by cell density in IEC-6 intestinal cells. J Cell Physiol. 1997;172:126–136. doi: 10.1002/(SICI)1097-4652(199707)172:1<126::AID-JCP14>3.0.CO;2-A. [DOI] [PubMed] [Google Scholar]
- Benten WP, Lieberherr M, Sekeris CE, Wunderlich F. Testosterone induces Ca2+ influx via non-genomic surface receptors in activated T cells. FEBS Lett. 1997;407:211–214. doi: 10.1016/s0014-5793(97)00346-3. [DOI] [PubMed] [Google Scholar]
- Bonaccorsi L, Carloni V, Muratori M, Formigli L, Zecchi S, Forti G, et al. EGF receptor (EGFR) signaling promoting invasion is disrupted in androgen-sensitive prostate cancer cells by an interaction between EGFR and androgen receptor (AR) Int J Cancer. 2004a;112:78–86. doi: 10.1002/ijc.20362. [DOI] [PubMed] [Google Scholar]
- Bonaccorsi L, Marchiani S, Muratori M, Forti G, Baldi E. Gefitinib (‘IRESSA’, ZD1839) inhibits EGF-induced invasion in prostate cancer cells by suppressing PI3 K/AKT activation. J Cancer Res Clin Oncol. 2004b;130:604–614. doi: 10.1007/s00432-004-0581-8. [DOI] [PMC free article] [PubMed] [Google Scholar]
- Bonaccorsi L, Muratori M, Carloni V, Marchiani S, Formigli L, Forti G, et al. The androgen receptor associates with the epidermal growth factor receptor in androgen-sensitive prostate cancer cells. Steroids. 2004c;69:549–552. doi: 10.1016/j.steroids.2004.05.011. [DOI] [PubMed] [Google Scholar]
- Cato AC, Nestl A, Mink S. Rapid actions of steroid receptors in cellular signaling pathways. Sci STKE. 2002;2002:re9. doi: 10.1126/stke.2002.138.re9. [DOI] [PubMed] [Google Scholar]
- Cunha GR, Ricke W, Thomson A, Marker PC, Risbridger G, Hayward SW, et al. Hormonal, cellular, and molecular regulation of normal and neoplastic prostatic development. J Steroid Biochem Mol Biol. 2004;92:221–236. doi: 10.1016/j.jsbmb.2004.10.017. [DOI] [PubMed] [Google Scholar]
- De Wever O, Mareel M. Role of tissue stroma in cancer cell invasion. J Pathol. 2003;200:429–447. doi: 10.1002/path.1398. [DOI] [PubMed] [Google Scholar]
- Estrada M, Uhlen P, Ehrlich BE. Ca2+ oscillations induced by testosterone enhance neurite outgrowth. J Cell Sci. 2006;119(Pt 4):733–743. doi: 10.1242/jcs.02775. [DOI] [PubMed] [Google Scholar]
- Farnsworth WE. The prostate plasma membrane as an androgen receptor. Membr Biochem. 1990;9:141–162. doi: 10.3109/09687689009025836. [DOI] [PubMed] [Google Scholar]
- Franco OE, Shaw AK, Strand DW, Hayward SW. Cancer associated fibroblasts in cancer pathogenesis. Semin Cell Dev Biol. 2010;21:33–39. doi: 10.1016/j.semcdb.2009.10.010. [DOI] [PMC free article] [PubMed] [Google Scholar]
- Gorczynska E, Handelsman DJ. Androgens rapidly increase the cytosolic calcium concentration in Sertoli cells. Endocrinology. 1995;136:2052–2059. doi: 10.1210/endo.136.5.7720654. [DOI] [PubMed] [Google Scholar]
- Gu X, Spitzer NC. Distinct aspects of neuronal differentiation encoded by frequency of spontaneous Ca2+ transients. Nature. 1995;375:784–787. doi: 10.1038/375784a0. [DOI] [PubMed] [Google Scholar]
- Guh JH, Chueh SC, Hwang TL, Chen J, Teng CM. Cell proliferation in human prostatic smooth muscle cells involves the modulation of protein kinase C isozymes. Eur J Pharmacol. 1998;359:281–284. doi: 10.1016/s0014-2999(98)00683-9. [DOI] [PubMed] [Google Scholar]
- Haynes JM. beta(2) and beta(3)-adrenoceptor inhibition of alpha(1)-adrenoceptor-stimulated Ca(2+) elevation in human cultured prostatic stromal cells. Eur J Pharmacol. 2007;570:18–26. doi: 10.1016/j.ejphar.2007.05.035. [DOI] [PubMed] [Google Scholar]
- Haynes JM, Frydenberg M, Majewski H. Testosterone- and phorbol ester-stimulated proliferation in human cultured prostatic stromal cells. Cell Signal. 2001;13:703–709. doi: 10.1016/s0898-6568(01)00205-4. [DOI] [PubMed] [Google Scholar]
- Haynes JM, Iannazzo L, Majewski H. Phorbol ester-induced contractility and Ca2+ influx in human cultured prostatic stromal cells. Biochem Pharmacol. 2002;64:385–392. doi: 10.1016/s0006-2952(02)01211-x. [DOI] [PubMed] [Google Scholar]
- Hiipakka RA, Liao SS. Molecular mechanism of androgen action. Trends Endocrinol Metab. 1998;9:317–324. doi: 10.1016/s1043-2760(98)00081-2. [DOI] [PubMed] [Google Scholar]
- Holl RW, Thorner MO, Mandell GL, Sullivan JA, Sinha YN, Leong DA. Spontaneous oscillations of intracellular calcium and growth hormone secretion. J Biol Chem. 1988;263:9682–9685. [PubMed] [Google Scholar]
- Jaimovich E, Espinosa A. Possible link of different slow calcium signals generated by membrane potential and hormones to differential gene expression in cultured muscle cells. Biol Res. 2004;37:625–633. doi: 10.4067/s0716-97602004000400018. [DOI] [PubMed] [Google Scholar]
- Jarrard DF, Blitz BF, Smith RC, Patai BL, Rukstalis DB. Effect of epidermal growth factor on prostate cancer cell line PC3 growth and invasion. Prostate. 1994;24:46–53. doi: 10.1002/pros.2990240110. [DOI] [PubMed] [Google Scholar]
- Kawanishi T, Kawanishi M, Ohata H, Toyoda K, Takahashi M, Momose K, et al. The relationship between spontaneous calcium oscillations and cell proliferation in cultured smooth muscle cells. Jpn J Pharmacol. 1994;65:59–62. doi: 10.1254/jjp.65.59. [DOI] [PubMed] [Google Scholar]
- Levine AC, Ren M, Huber GK, Kirschenbaum A. The effect of androgen, estrogen, and growth factors on the proliferation of cultured fibroblasts derived from human fetal and adult prostates. Endocrinology. 1992;130:2413–2419. doi: 10.1210/endo.130.4.1372243. [DOI] [PubMed] [Google Scholar]
- Lieberherr M, Grosse B. Androgens increase intracellular calcium concentration and inositol 1,4,5-trisphosphate and diacylglycerol formation via a pertussis toxin-sensitive G-protein. J Biol Chem. 1994;269:7217–7223. [PubMed] [Google Scholar]
- Mamoune A, Kassis J, Kharait S, Kloeker S, Manos E, Jones DA, et al. DU145 human prostate carcinoma invasiveness is modulated by urokinase receptor (uPAR) downstream of epidermal growth factor receptor (EGFR) signaling. Exp Cell Res. 2004;299:91–100. doi: 10.1016/j.yexcr.2004.05.008. [DOI] [PubMed] [Google Scholar]
- Marks LS, Mostaghel EA, Nelson PS. Prostate tissue androgens: history and current clinical relevance. Urology. 2008;72:247–254. doi: 10.1016/j.urology.2008.03.033. [DOI] [PMC free article] [PubMed] [Google Scholar]
- Morley P, Whitfield JF. The differentiation inducer, dimethyl sulfoxide, transiently increases the intracellular calcium ion concentration in various cell types. J Cell Physiol. 1993;156:219–225. doi: 10.1002/jcp.1041560202. [DOI] [PubMed] [Google Scholar]
- Nguyen ST, Prakash R, Anderson CJ, Frydenberg M, Haynes JM. Sex steroids modulate alpha(1)-adrenoceptor-stimulated Ca(2+) elevation in human cultured prostatic stromal cells. Prostate. 2007;67:74–82. doi: 10.1002/pros.20504. [DOI] [PubMed] [Google Scholar]
- Oliver VL, Anderson C, Ventura S, Haynes JM. Androgens regulate adenylate cyclase activity and intracellular calcium in stromal cells derived from human prostate. Prostate. 2010;70:1222–1232. doi: 10.1002/pros.21157. [DOI] [PubMed] [Google Scholar]
- Pennefather JN, Lau WA, Mitchelson F, Ventura S. The autonomic and sensory innervation of the smooth muscle of the prostate gland: a review of pharmacological and histological studies. J Auton Pharmacol. 2000;20:193–206. doi: 10.1046/j.1365-2680.2000.00195.x. [DOI] [PubMed] [Google Scholar]
- Preston A, Haynes JM. Alpha 1-adrenoceptor effects mediated by protein kinase C alpha in human cultured prostatic stromal cells. Br J Pharmacol. 2003;138:218–224. doi: 10.1038/sj.bjp.0705021. [DOI] [PMC free article] [PubMed] [Google Scholar]
- Sen A, O'Malley K, Wang Z, Raj GV, Defranco DB, Hammes SR. Paxillin regulates androgen- and epidermal growth factor-induced MAPK signaling and cell proliferation in prostate cancer cells. J Biol Chem. 2010;285:28787–28795. doi: 10.1074/jbc.M110.134064. [DOI] [PMC free article] [PubMed] [Google Scholar]
- She QB, Solit DB, Ye Q, O'Reilly KE, Lobo J, Rosen N. The BAD protein integrates survival signaling by EGFR/MAPK and PI3K/Akt kinase pathways in PTEN-deficient tumor cells. Cancer Cell. 2005;8:287–297. doi: 10.1016/j.ccr.2005.09.006. [DOI] [PMC free article] [PubMed] [Google Scholar]
- Steinsapir J, Socci R, Reinach P. Effects of androgen on intracellular calcium of LNCaP cells. Biochem Biophys Res Commun. 1991;179:90–96. doi: 10.1016/0006-291x(91)91338-d. [DOI] [PubMed] [Google Scholar]
- Taneja SS, Ha S, Swenson NK, Huang HY, Lee P, Melamed J, et al. Cell-specific regulation of androgen receptor phosphorylation in vivo. J Biol Chem. 2005;280:40916–40924. doi: 10.1074/jbc.M508442200. [DOI] [PubMed] [Google Scholar]
- Torring N, Jensen LV, Wen JG, Sorensen FB, Djurhuus JC, Nexo E. Chronic treatment with epidermal growth factor induces growth of the rat ventral prostate. Scand J Urol Nephrol. 2001;35:339–344. doi: 10.1080/003655901753224378. [DOI] [PubMed] [Google Scholar]
- Toth M, Zakar T. Different binding of testosterone, 19-nortestosterone and their 5 alpha-reduced derivatives to the androgen receptor of the rat seminal vesicle: a step toward the understanding of the anabolic action of nortesterone. Endokrinologie. 1982;80:163–172. [PubMed] [Google Scholar]
- Tvorogov D, Carpenter G. EGF-dependent association of phospholipase C-gamma1 with c-Cbl. Exp Cell Res. 2002;277:86–94. doi: 10.1006/excr.2002.5545. [DOI] [PubMed] [Google Scholar]
- Unni E, Sun S, Nan B, McPhaul MJ, Cheskis B, Mancini MA, et al. Changes in androgen receptor nongenotropic signaling correlate with transition of LNCaP cells to androgen independence. Cancer Res. 2004;64:7156–7168. doi: 10.1158/0008-5472.CAN-04-1121. [DOI] [PubMed] [Google Scholar]
- Watt SD, Gu X, Smith RD, Spitzer NC. Specific frequencies of spontaneous Ca2+ transients upregulate GAD 67 transcripts in embryonic spinal neurons. Mol Cell Neurosci. 2000;16:376–387. doi: 10.1006/mcne.2000.0871. [DOI] [PubMed] [Google Scholar]
Associated Data
This section collects any data citations, data availability statements, or supplementary materials included in this article.


