

Abstract
BACKGROUND & AIMS
Biliary atresia (BA) is a neonatal cholangiopathy of unknown etiology. The bile duct injury that occurs in patients with BA might result from a hepatobiliary viral infection followed by an autoimmune response against the bile duct epithelia. We aimed to identify autoantigens recognized by serum antibodies in the Rhesus rotavirus (RRV)-induced mouse model of BA; findings were correlated with BA in humans.
METHODS
Bile duct epithelial proteins were screened for their reactivity with serum antibodies from the mouse model of BA using immunoblot assays. Unique proteins that reacted with sera antibodies were identified by mass spectrometry and verified using enzyme-linked immunosorbent assay (ELISA) and immunoblot analyses. Candidate autoantibodies in BA patient sera were analyzed by ELISA.
RESULTS
A bile duct epithelial antigen that reacted strongly with serum immunoglobulin (Ig) G from the mouse model of BA was identified as α-enolase. α-Enolase autoantibody specificity was confirmed by ELISA and immunoblot analyses. Anti-RRV and anti-enolase antibodies cross-reacted with enolase and RRV proteins; we identified regions of sequence homology between RRV and enolase. Serum samples from patients with BA had increased levels of anti-enolase IgM and IgG.
CONCLUSIONS
We have identified autoantibodies against α-enolase in a mouse model of BA (infected with RRV) and in serum samples from patients, indicating a role of humoral autoimmunity in disease pathogenesis. The cross-reactivity between an anti-enolase antibody and RRV proteins indicates that molecular mimicry might activate humoral autoimmunity in BA patients; further studies are required.
Keywords: Neonatal Immunity, Neonatal Cholestasis, Biliary Obstruction
Biliary atresia (BA) is a progressive, inflammatory cholangiopathy characterized by periductal inflammation with fibrosis and bile duct obstruction culminating in cirrhosis and the need for pediatric liver transplantation in the majority of patients.1–4 The proposed pathogenesis of BA involves an initial perinatal hepatobiliary viral infection followed by a cellular and humoral autoimmune-mediated response targeting bile duct epithelia.5 To test this hypothesis, work has focused on the Rhesus group A rotavirus (RRV)-induced murine model of BA. Newborn BALB/c mice infected with RRV develop hyperbilirubinemia, acholic stools, and progressive inflammation and obstruction of the extrahepatic bile duct by 2 weeks of age.6 Despite documented clearance of the virus from the liver, the inflammatory injury of the bile ducts continues until death from malnutrition and liver failure by 3 to 4 weeks of life.6 – 8
Support for an autoimmune-mediated etiology derives from 2 recent studies in this murine model that identified autoreactive T cells specific to bile duct epithelia.9,10 In these studies, adoptive transfer of hepatic T cells from BA mice into naïve immunodeficient recipients produced bile duct specific inflammation and injury. In humans, oligoclonal expansion of CD4+ and CD8+ T cells was identified in the livers of BA patients, suggesting an antigen-driven cellular immune response.11 However, little is known about the potential role of humoral auto-immunity in BA. Previous studies of murine and human BA have detected immunoglobulin deposits colocalizing and surrounding bile duct epithelia.9,12 The aim of this study was to investigate serum autoantibodies in BA to identify potential bile duct epithelial protein targets of the antibodies in murine BA and to correlate these findings with human BA.
Materials and Methods
RRV-Induced Murine Model of BA
All animals received humane care in accordance with criteria from the National Institutes of Health “Guide for Care and Use of Laboratory Animals” (publication No. 86-25 1985). Timed-pregnant female BALB/c mice were purchased from rotavirus-free colonies of Jackson Laboratory (Bar Harbor, ME). Newborn pups were injected with either Hank’s balanced salt solution (BSS controls) or RRV as previously described.7 Animals were sacrificed on day 14 of life, and livers and blood were collected at the time of death for analysis. Because of the small quantity of sera from each pup, sera were pooled from an average of 5–10 pups.
Immunofluorescence
Chamber slides (Nalge Nunc Int, Naperville, IL) were plated to confluency with either the BALB/c normal mouse cholangiocyte (NMC) cell line (provided courtesy of Yoshiyuki Ueno, MD, Tohoku University School of Medicine, Sendai, Japan) or the human cholangiocyte cell line (provided courtesy of Gregory Gores, Mayo Clinic, Rochester, MN). The cells were fixed with 2% paraformaldehyde, bathed in 6% hydrogen peroxide (to remove endogenous peroxidases), and blocked with Fc gamma receptor antibody (BD Biosciences, Rockville, MD). Confirmation of bile duct epithelial nature was determined with anti-cytokeratin 19-AlexaFlor55513 for murine studies, and anti-cytokeratin 7 antibody (Dako Cytomation, Glostrup, Denmark) for human studies. For serum immunoglobulin (Ig) G studies, pooled murine BA or BSS sera (1:100 dilution) or individual human BA or control sera (n = 5 each) was added to appropriate cholangiocyte slides followed by goat anti-mouse IgG-fluorescein isothiocyanate (FITC) or mouse anti-human IgG-FITC, respectively (Sigma-Aldrich, St. Louis, MO) and the FITC signal enhanced with the Tyramide Signal Amplification fluorescein system (PerkinElmer, Boston, MA). Cells were counterstained with Hoechst dye and visualized using the Olympus 1X81 inverted motorized microscope (Center Valley, PA). Digital photographs were obtained with the Hamamatsu ORCA IIER monochromatic CCD camera (Bridgewater, NJ) with identical exposure times for all samples.
Western Immunoblot Analysis
The cultured NMC cell line was separated into the cytosolic and membrane components using the Ready-Prep Protein Extraction Kit (Bio-Rad, Hercules, CA), and protein concentrations were determined with the BCA Protein Assay Kit (Pierce Biotechnology, Rockford, IL). Cytosolic NMC proteins, cesium gradient-purified RRV (courtesy of Harry Greenberg, MD, Stanford University, CA), purified rabbit muscle enolase (Sigma-Aldrich; high isoform homology with α-enolase14), or control ovalbumin (Sigma-Aldrich) was separated onto a NuPAGE Bis-Tris acrylamide gel (Invitrogen, Carlsbad, CA) and transferred to polyvinylidene difluoride membrane (Amersham Biosciences, Piscataway, NJ). The membrane was blocked with powdered milk, and diluted sera (1:100) from BA or BSS mice was incubated with the membrane, followed by goat-anti-mouse IgG-peroxidase (KPL, Gaithersburg, MD). The membranes were developed with the Western Lightning Reagent (Millipore, Billerica, MA) and exposed to autoradiographic film. Western blots were repeated 5 times with different pools of sera. For anti-RRV reactivity studies, commercially prepared sheep antiserum to RRV (AbD Serotec, Oxford, UK) was affinity purified in the following manner. Cesium gradient purified RRV was coupled to agarose per manufacturer’s protocol (MicroLink Protein Coupling Kit; Pierce Biotechnology), RRV antiserum was bound to the column, and purified anti-RRV antibody was eluted. For some studies, affinity-purified polyclonal anti-enolase antibody (Santa Cruz Biotechnology, Santa Cruz, CA) was utilized. Other controls included mouse anti-vimentin antibody (NeoMarkers, Fremont, CA) and goat anti-actin antibody (Santa Cruz Biotechnology).
Mass Spectrometry Analysis
Candidate protein bands identified by Western blot were stained with Bio-safe Coomassie (Bio-Rad), excised, trypsin digested, and prepared for mass spectrometry analysis using standard techniques.15 Samples were loaded into a Finnigan Deca LCQ liquid chromatographytandem mass spectrometry, and results were analyzed with the Mascot search engine. Mascot is a proprietary identification program available from Matrix Science (Boston, MA). It performs mass spectrometry data analysis through a statistical evaluation of matches between observed and projected peptide fragments. Probability-based molecular weight search (MOWSE) scores >33 and peptide coverage >20% were considered significant.16 Amino acid homology between RRV and murine α-enolase was assessed by basic local alignment search tool for proteins (BLASTp) search. Protein crystal structures were obtained from the Research Collaboratory for Structural Bioinformatics protein data bank.
Enzyme-Linked Immunosorbent Assay
Proteins were plated onto a Immulon 2B flat bottom microtiter plate (Thermo, Milford, MA), blocked with enzyme-linked immunosorbent assay (ELISA) diluent solution (eBioscience, San Diego, CA), incubated with goat anti-enolase antibody (Santa Cruz Biotechnology) at increasing dilutions, followed by donkey anti-goat IgG peroxidase to generate a standard curve (each dilution was assigned an arbitrary number in units/milliliters). For serum studies, total IgG levels were measured, and equal amounts of total IgG were compared between groups. Serum control groups included BSS; noncholestatic, RRV infected siblings of BA mice; mothers of BA mice; and cholestatic adult mice that had undergone bile duct ligation (courtesy of R. Sokol, University of Colorado Denver, Aurora, CO). A secondary anti-mouse IgG peroxidase was added followed by tetramethylbenzidine substrate (BD Biosciences, San Diego, CA), and optical density readings were obtained at 450 nm on a kinetic microplate reader (Molecular Devices, Sunnyvale, CA). ELISA was repeated using 11 distinct sera pools, and samples were tested in duplicate.
Human Specimens
This study was approved by the Colorado Multiple Institutional Review Board. Sera were collected and stored at −70°C from BA infants at the time of diagnosis (<4 months of age; n = 26), BA children >1 year of age with their native liver (n = 12), and other nonimmune-mediated liver disease age-matched patient controls (n = 35). All infants and children in this study had undergone a Kasai portoenterostomy at the time of diagnosis. Control liver diseases included cystic fibrosis, total parenteral nutrition-induced cholestasis, α-1 antitrypsin deficiency, progressive familial intrahepatic cholestasis, choledochal cyst, portal hypertension, Down syndrome, sickle cell disease, non-alcoholic steatohepatitis, and Wilson’s disease. Clinical data were collected from the medical records at the time of specimen collection and included age, diagnosis, gender, serum total bilirubin, direct bilirubin, and alanine aminotransferase (ALT). For enolase ELISA studies, sera from BA patients or age-matched controls were added at increasing total IgG or IgM concentrations. As a positive control, sera (1:50 dilution) from children >1 year of age with autoimmune hepatitis (n = 12) were analyzed for the presence of anti-enolase IgG.17 Secondary antibodies included goat anti-human IgG peroxidase (Caltag, Carlsbad, CA) or goat anti-human IgM peroxidase (Sigma-Aldrich). Samples were tested in duplicate and repeated twice.
Statistical Analysis
Statistical analysis for ELISA studies was performed with Instat (GraphPad Software, La Jolla, CA), analyzed using a Student 2-tailed t test, and a P level of .05 was considered significant.
Results
Identification of Bile Duct Epithelial Cytosolic Proteins Reactive to Serum IgG From BA Mice
To determine potential bile duct epithelial protein targets of serum IgG, murine BA or BSS control sera was incubated with proteins from the NMC cell line and analyzed by immunofluorescence, ELISA, and Western immunoblot. Confirmation of the NMC cell line as a pure source of cholangiocytes was confirmed by positive cytokeratin 19 expression (Figure 1A, panel 1). The IgG antibody response could be studied in 2-week-old mice because of the fact that these mice are capable of generating substantial amounts of IgG, and maternally acquired IgG antibody is less predominant.18 IgG from sera of BA mice, but not BSS control mice, reacted with proteins within the cytosol of NMC cells (Figure 1A, panels 2 and 3). Similarly, significant amounts of serum IgG reactive to the cytosolic protein fraction of the NMC cell line were identified in BA sera compared with controls by ELISA analysis (P < .05) (Figure 1B). Western immunoblot studies revealed BA mice sera IgG reactivity to unique NMC cytosolic protein bands at 48 kilodaltons and 33 kilodaltons (Figure 1C). The unique NMC cytosolic protein bands represent novel bile duct epithelial autoantigens bound by serum antibodies from 2-week-old BA mice. Sera from BA mice did not show any unique reactivity to the NMC membrane fraction when compared with control sera by Western blot analysis (data not shown).
Figure 1.

Identification of bile duct epithelial cytosolic proteins reactive to IgG within BA sera. (A) Immunofluorescence: Panel 1: The normal mouse cholangiocyte cell line (NMC) was incubated with anti-cytokeratin 19 (CK19)-AF555 (red) and coun-terstained with nuclear Hoechst dye (blue). Panels 2 and 3: Cultured NMCs were incubated with sera from BA or saline (BSS) control mice, followed by anti-IgG-FITC (green). (B) ELISA: Plates were coated with the NMC cytosolic fraction and incubated with sera followed by anti-IgG HRP and substrate. Quantification of serum IgG reactive to NMC proteins is represented by the mean ± standard error of mean optical density. (C) Western blot analysis: The NMC cytosolic fraction was incubated with sera, and IgG reactive to NMC proteins was visualized by chemiluminescence. The IgG from BA sera reacted to unique proteins at 48 kilodaltons and 33 kilodaltons (boxed bands).
Identification of α-Enolase as an Autoantigen in BA Mice
To identify the protein(s) within the bands identified at 48 kilodaltons and 33 kilodaltons, mass spectrometry and peptide fingerprint analysis were utilized. The band at 48 kilodaltons was excised from the gel and trypsin digested, and the peptide mass was determined by mass spectrometry. The identified peptide mass was entered in the Mascot search engine and searched against known proteins within the murine genome. The probability that the protein identified was representative of a known protein within the murine genome was represented by the probability-based MOWSE score. Peptide coverage represents the percentage of peptides identified by mass spectrometry. MOWSE scores >33 and a peptide coverage of >20% are considered a significant match.16 The 48-kilodalton band had 2 significant protein matches of α-enolase and β-enolase (Figure 2). Enolase is composed of 3 isozyme subunits (α, β, and γ), which are cell type and development specific. α-Enolase is ubiquitously expressed in many tissues, including bile duct epithelia and hepatocytes, whereas β-enolase is expressed in muscle, and γ-enolase is expressed in neuroendocrine tissue.14,19 α-Enolase and β-enolase share significant homology. Further evaluation of the identified peptide masses revealed that α-enolase had several unique peptides not found in β-enolase. These unique α-enolase peptides were present in the candidate protein, verifying that the 48-kilodalton band was indeed α-enolase. The 33-kilodalton band was composed of 3 different proteins, which are currently under investigation and will not be addressed in this study.
Figure 2.

Mass spectrometry and peptide fingerprint analysis identified the 48-kilodalton protein band as α-enolase. (A) Protein analysis: Peptide mass of the 48-kilodalton proteins was determined by MALDI-TOF mass spectrometry, entered into the Mascot search engine, and analyzed against the murine genome. Four candidate proteins were identified as significant, with α-enolase demonstrating the highest peptide coverage. (B) α-Enolase peptide coverage within candidate protein: Shown in bold are the peptides from the candidate protein that contribute to 64% of the total peptide coverage of murine α-enolase.
As mentioned above, α-enolase is expressed in both hepatocytes and bile duct epithelia. To determine whether enolase protein expression was higher in bile duct epithelial cells, immunohistochemistry studies were performed on frozen sections of mouse livers utilizing anti-enolase antibody. Positive, low-level staining was found in hepatocytes and bile duct epithelia in both experimental and control groups (data not shown). Therefore, potential differences in level of expression of enolase in bile duct epithelia were not quantifiable by immunohistochemistry.
Generation of Anti-enolase Antibodies Within BA Mice Is Dependent on Both RRV Infection and Biliary Obstruction
Mass spectrometry studies revealed that enolase was a candidate autoantigen associated with the production of anti-enolase autoantibodies in murine BA. To verify the presence of serum anti-enolase autoantibodies in BA mice, ELISA and Western immunoblot analyses were performed using commercially available enolase as the antigen. ELISA studies revealed that the sera of BA mice had significantly higher concentrations of IgG antibodies reactive to enolase, in a dose response fashion, when compared with control mice (P < .05) (Figure 3A). Likewise, Western blot analysis showed that IgG from BA mice sera reacted strongly to the 48-kilodalton protein of the NMC cytosolic fraction as well as to the purified enolase (Figure 3B). One could argue that the presence of anti-enolase antibodies was nonspecific and due to either a nonspecific antibody production in the setting of a primary viral infection, passage of IgG transplacentally or from maternal breast milk, or nonspecific production in the presence of cholestasis. To control for these variables, sera was tested for anti-enolase antibodies from noncholestatic, RRV-infected siblings of BA mice, mothers of BA mice, and cholestatic adult mice that had undergone bile duct ligation. None of these control populations generated significant levels of anti-enolase antibodies (Figure 3A).
Figure 3.

Generation of anti-enolase antibodies within BA mice is dependent on both RRV infection and biliary obstruction. (A) ELISA: Plates were coated with purified enolase and incubated with sera followed by anti-IgG horseradish peroxidase (HRP) and substrate. Standard curves for anti-enolase were obtained and results shown as mean ± standard error of mean. Control mice included BSS; noncholestatic, RRV-infected siblings of BA (RRV infected, without [w/o] BA); mothers of BA; and bile duct ligated, chole-static adult mice. Significant differences in antibody levels were found between each control group and BA (*P < .05). (B) Western blot analysis: The NMC cytosolic fraction or purified enolase was incubated with sera, and IgG reactive to protein was visualized by chemiluminescence. (C) ELISA verification of RRV infection: Plates were coated with RRV and incubated with sera followed by anti-IgG HRP and substrate. Standard curves for anti-RRV were obtained and results shown as mean ± standard error of mean.
Approximately 20%–25% of newborn mice injected with RRV do not develop BA, perhaps because of the narrow window after birth in which mice need to be exposed to RRV to develop BA.20 To confirm that the non-BA, RRV-infected siblings of BA mice had been successfully infected, the anti-RRV antibody response was measured in the sera of BA mice, siblings of BA mice, and BSS controls. A robust anti-RRV antibody production was found in both BA mice and non-BA siblings (Figure 3C). In summary, the generation of anti-enolase autoantibodies in BA mice was associated with both the initial RRV infection and the subsequent development of immune-mediated biliary injury with obstruction. Anti-enolase autoantibody production did not occur with isolated RRV infection or biliary obstruction without infection.
Elevated Serum Anti-enolase IgM and IgG Antibodies in BA Patients
Based on the observation that α-enolase is highly conserved across species,21 the detection of anti-enolase antibodies in human BA patients was evaluated. We first sought to determine whether serum antibodies from BA infants could be detected that would be reactive to a human cholangiocyte cell line. Confirmation of the cell line as a pure source of cholangiocytes was confirmed by uniform cytokeratin 7 expression in all cells (Figure 4A, panel 1). IgG from sera of children >1 year of age with BA, but not control patients (n = 5 each), reacted with proteins within the cytosol of cholangiocytes (Figure 4A, panels 2 and 3). We next attempted to detect anti-enolase IgM antibodies in BA infants compared with liver-disease control infants ≤4 months old and anti-enolase IgG antibodies in BA children >1 year old who had not undergone liver transplantation compared with age-matched controls with other liver diseases. BA patients and control groups were similar in age, gender, degree of cholestasis (serum total bilirubin), and liver injury (serum ALT) (Table 1). Bilirubin and ALT levels were available for >75% of patients. The concentration of total IgM and IgG in the sera from each BA patient and age-matched control was determined to ensure that equal amounts of either IgM (312 ng/mL) or IgG (10 μg/mL) were analyzed for anti-enolase antibodies. The sera of BA patients had significantly higher mean concentrations of anti-enolase IgM antibodies (mean ± standard error of mean U/mL: BA: 56.5 ± 14; control: 21.5 ± 5.4, P = .02) and anti-enolase IgG antibodies (BA: 75.2 ± 21.5; control: 27.4 ± 4.3, P = .006) (Figure 4B). As a positive control, an autoimmune hepatitis population was analyzed. It has been previously reported that sera from autoimmune hepatitis patients have detectable anti-enolase antibodies.14,17 We analyzed the sera of children >1 year of age with a histologic diagnosis of autoimmune hepatitis (n = 12). The mean ± standard error of mean of anti-enolase IgG was 116.7 ± 30.8 U/mL, which is above the mean of the BA patients.
Figure 4.

Elevated serum anti-enolase IgM and IgG antibodies in BA patients. (A) Representative immunofluorescence: Panel 1: The human cholangiocyte cell line was incubated with anti-cytokeratin 7-Cy3 (CK7) (red) and counterstained with nuclear Hoechst dye (blue). Panels 2 and 3: Cultured cholangiocytes were incubated with sera from BA or control patients, followed by anti-human IgG-FITC (green). (B) Sera from BA infants at the time of diagnosis (left panel, IgM), BA children >1 year of age with their native liver (right panel, IgG), and other disease age-matched controls were tested for anti-enolase antibodies by ELISA. Each dot represents the average anti-enolase antibody level from a single patient, and the bar is the mean value of all subjects within the group.
Table 1.
Demographic and Laboratory Characteristics of BA Patients and Controls
| Characteristic | BA: age ≤4 mo | Control: age ≤4 mo | BA: age ≥1 y | Control: age ≥1 y |
|---|---|---|---|---|
| No. patients | 26 | 11 | 12 | 24 |
| Male/female | 13/13 | 5/6 | 5/7 | 14/10 |
| Age (y) | 0.19 ± 0.01 | 0.21 ± 0.01 | 7.27 ± 6.55 | 9.06 ± 5.7 |
| ALT (U/L) | 253 ± 139 | 334 ± 427 | 238 ± 451 | 209 ± 408 |
| Total bili. (mg/dL) | 7.6 ± 2.3 | 10.2 ± 7.4 | 7.4 ± 12.0 | 5.0 ± 13.9 |
| Direct bili. (mg/dL) | 5.5 ± 1.7 | 7.7 ± 5.5 | 5.9 ± 11.0 | 3.7 ± 10.2 |
NOTE. Parameters are expressed as mean ± standard deviation.
ALT, alanine aminotransferase; BA, biliary atresia; bili., bilirubin.
Anti-enolase Antibody Recognizes RRV Protein(s)
One possible theory to explain the increase in production of autoantibodies in the setting of previous viral infection is that there is molecular mimicry between virus and self-antigens. Western immunoblot was utilized to test cross-reactivity between cesium gradient-purified RRV protein and enolase protein with anti-enolase- or anti-RRV-specific antibodies. As shown in Figure 5, the anti-RRV antibody reacted with both multiple RRV proteins and enolase protein, and the anti-enolase antibody reacted with enolase as well as with RRV protein(s) of approximately 102-kilodalton molecular weight. Neither antibody reacted with control ovalbumin. No reactivity with either RRV proteins or enolase was found in other controls, including the secondary detection antibody alone, antivimentin antibody, or antiactin antibody (data not shown). Mass spectrometry and peptide fingerprint analysis revealed that the ~102-kilodalton RRV proteins cross-reactive to anti-enolase antibody included viral protein (VP)6 (MOWSE score, 1074), VP2 (MOWSE score, 489), and VP4 (MOWSE score, 251).
Figure 5.
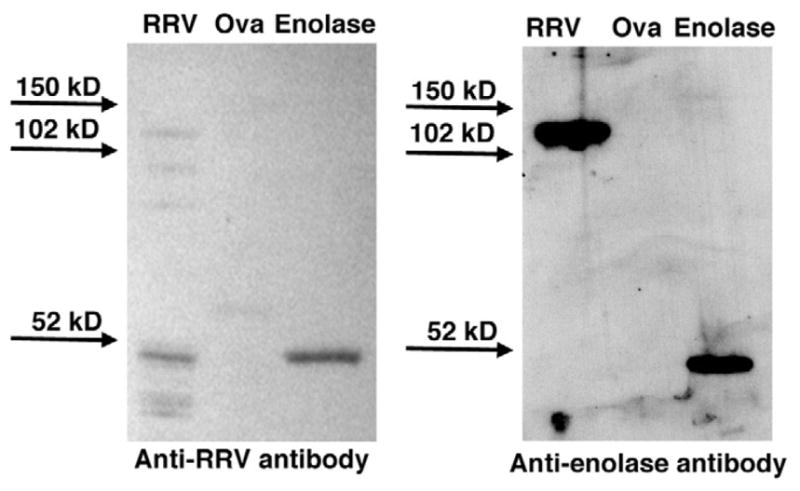
Anti-RRV and anti-enolase antibodies cross-reactive with both RRV and enolase proteins. Western blot: Purified RRV, ovalbumin (ova), and enolase (1 μg each) were incubated with either purified anti-RRV or anti-enolase antibody, and reactivity was visualized by chemiluminescence. The ~120-kilodalton RRV protein band reactive to anti-enolase antibody was identified by mass spectrometry to contain proteins VP2, VP4, and VP6.
Discussion
This is the first study demonstrating the detection of anti-α-enolase autoantibodies in both murine and human BA. α-Enolase is an enzyme involved in glycolysis and is ubiquitously expressed in a variety of cells, including biliary epithelial cells and hepatocytes.21,22 Interestingly, anti-α-enolase antibodies have also been detected in the sera of approximately 30% of patients with auto-immune liver diseases, including autoimmune hepatitis, primary biliary cirrhosis, and primary sclerosing cholangitis.14,22–24 Furthermore, one of the minor antigen targets of antineutrophil cytoplasmic antibodies present in autoimmune liver diseases has been shown to be α-enolase.17,24,25 Similar to our human data, these previous studies reported that a small percentage (3%– 6%) of normal controls had circulating anti-α-enolase antibodies. Thus, our finding of anti-enolase antibodies in BA is similar to that found in other autoimmune diseases, suggesting that this antibody is a potential biomarker of the humoral autoimmune response.
The production of anti-enolase antibodies in the murine model of BA was dependent on both neonatal RRV infection and subsequent development of biliary injury and obstruction. RRV infection or biliary obstruction alone was not sufficient to result in increased levels of anti-enolase antibodies. This implies that the anti-enolase autoantibodies produced after RRV infection may play a role in biliary injury and obstruction. This finding lends support to the viral induced, autoimmune-mediated theory on the pathogenesis of BA in which a primary cholangiocyte infection is followed by a secondary autoimmune response targeting bile duct epithelia that eventually progresses to biliary cirrhosis.
Identification of cross-reactivity of anti-RRV antibody with enolase protein and anti-enolase antibody with RRV protein suggested that perhaps the virus and self-proteins shared similar antigenic motifs. A BLASTp search comparing murine α-enolase to the RRV protein genome showed significant homology between RRV-VP4 and enolase. Evaluation of peptide sequence homology between α-enolase and VP4 revealed a 31% identical amino acid match and a 48% amino acid match if conservative amino acid similarities were included (Figure 6A). VP4 is trypsin-cleaved to subunits VP5 and VP8, with a hinge region between these subunits.26,27 Subunit VP5 (amino acids 383– 402) is an immunogenic region that is essential for initiating a neutralizing antibody response (see Figure 6A, VP4 underlined peptide sequence). Furthermore, this region is within the membrane interaction loop that is necessary for RRV to enter and infect a cell.27–31 The ribbon structures of human α-enolase (Figure 6B) and VP4 subunits VP5/VP8 (Figure 6C) demonstrate this sequence homology. It is possible that the immunogenic RRV peptides could mimic self-peptides (ie, enolase), resulting in a break in immune tolerance and development of autoantibodies to enolase. Molecular mimicry has been shown or hypothesized to trigger autoimmune disease in both animal models and human disease.5,32–34 In our study, it is only speculation at this point that molecular mimicry may be a possible mechanism to explain the onset of the autoimmune response and production of autoantibodies. Future studies addressing this concept are warranted.
Figure 6.

Sequence homology and ribbon diagrams of α-enolase, VP5, and VP8. (A) BLASTp analysis: Murine α-enolase and RRV protein genome were searched for peptide homology. Three significant matches are shown between α-enolase and VP4 (VP4 subunits are VP5 and VP8). Peptides shown in bold represent an exact match, and a “+” sign between the 2 sequences represents conservative amino acid changes. The underlined peptide segment in VP4 is the VP5 subunit that is a known immunogenic region responsible for generating the neutralizing antibody response. Ribbon diagrams: (B) Enolase and (C) VP5/VP8. Homologous amino acids between α-enolase and VP4 (VP5/VP8 subunits) are highlighted in yellow. The underlined VP5 peptide sequence shown in A that is homologous with enolase is highlighted in purple.
The screening method used to detect α-enolase antibodies entailed separating a murine cholangiocyte cell line, using Western immunoblot analysis with sera from BA mice, and mass spectrometry to identify unique protein targets. Although this method is very specific for the presence of autoantibodies against bile duct epithelia, the sensitivity of detecting autoantibodies to other cellular components (ie, nuclear antigens) is low. Supplementary proteomics screening methods, such as using autoantigen microarrays35 or serologic identification of antigens by recombinant expression cloning (SEREX),36 may be useful to identify other potential targets of autoantibodies in BA in the future.
Our study highlights the role of B cell autoimmunity in murine and human BA and identifies a potential autoimmune marker, anti-α-enolase antibody, in the disease process. The detection of autoantibodies in BA is significant because of the potential for the serum antibodies to function as a biomarker in the diagnosis of BA or as a tool to measure response to new treatments.
Acknowledgments
Funding
Supported by NIDDK, National Institutes of Health grant P30 DK048520-09 for the mass spectrometry analysis performed by the Mass Spectrometry Core Facility at University of Colorado Denver and the University of Colorado Cancer Center Proteomics Core, and NIH-NIDDK T32 DK067009-01 and The Children’s Hospital Research Foundation.
Abbreviations used in this paper
- ALT
alanine aminotransferase
- BA
biliary atresia
- BLASTp
basic local alignment search tool for proteins
- BSS
Hank’s balanced salt solution
- ELISA
enzyme-linked immunosorbent assay
- FITC
fluorescein isothiocyanate
- HRP
horse-radish peroxidase
- Ig
immunoglobulin
- MOWSE
molecular weight search
- NMC
normal mouse cholangiocyte
- RRV
Rhesus rotavirus
- VP
viral protein
Footnotes
Conflicts of interest
The authors disclose no conflicts.
References
- 1.Sokol RJ, Mack C, Narkewicz MR, et al. Pathogenesis and outcome of biliary atresia: current concepts. J Pediatr Gastroenterol Nutr. 2003;37:4–21. doi: 10.1097/00005176-200307000-00003. [DOI] [PubMed] [Google Scholar]
- 2.Lykavieris P, Chardot C, Sokhn M, et al. Outcome in adulthood of biliary atresia: a study of 63 patients who survived for over 20 years with their native liver. Hepatology. 2005;41:366–371. doi: 10.1002/hep.20547. [DOI] [PubMed] [Google Scholar]
- 3.Mack CL, Tucker RM, Sokol RJ, et al. Biliary atresia is associated with CD4+ Th1 cell-mediated portal tract inflammation. Pediatr Res. 2004;56:79–87. doi: 10.1203/01.PDR.0000130480.51066.FB. [DOI] [PMC free article] [PubMed] [Google Scholar]
- 4.Davenport M, Gonde C, Redkar R, et al. Immunohistochemistry of the liver and biliary tress in extrahepatic biliary atresia. J Pediatr Surg. 2001;36:1017–1025. doi: 10.1053/jpsu.2001.24730. [DOI] [PubMed] [Google Scholar]
- 5.Mack CL. The pathogenesis of biliary atresia: evidence for a virus-induced autoimmune disease. Semin Liver Dis. 2007;27:233–242. doi: 10.1055/s-2007-985068. [DOI] [PMC free article] [PubMed] [Google Scholar]
- 6.Riepenhoff-Talty M, Schaekel K, Clark HF, et al. Group A rotavirus produce extrahepatic biliary obstruction in orally inoculated newborn mice. Pediatr Res. 1993;33:394–399. doi: 10.1203/00006450-199304000-00016. [DOI] [PubMed] [Google Scholar]
- 7.Mack CL, Tucker RM, Sokol RJ, et al. Armed CD4+ Th1 effector cells and activated macrophages participate in bile duct injury in murine biliary atresia. Clin Immunol. 2005;115:200–209. doi: 10.1016/j.clim.2005.01.012. [DOI] [PMC free article] [PubMed] [Google Scholar]
- 8.Shivakumar P, Campbell KM, Sabla GE, et al. Obstruction of extrahepatic bile ducts by lymphocytes is regulated by IFN-γ in experimental biliary atresia. Clin Invest. 2004;114:322–329. doi: 10.1172/JCI21153. [DOI] [PMC free article] [PubMed] [Google Scholar]
- 9.Mack CL, Tucker RM, Lu BR, et al. Cellular and humoral autoimmunity directed at bile duct epithelia in murine biliary atresia. Hepatology. 2006;44:1231–1239. doi: 10.1002/hep.21366. [DOI] [PMC free article] [PubMed] [Google Scholar]
- 10.Shivakumar P, Sabla G, Mohanty S, et al. Effector role of neonatal hepatic CD8+ lymphocytes in epithelial injury and autoimmunity in experimental biliary atresia. Gastroenterology. 2007;133:268–277. doi: 10.1053/j.gastro.2007.04.031. [DOI] [PMC free article] [PubMed] [Google Scholar]
- 11.Mack CL, Falta MF, Sullivan AK, et al. Oligoclonal expansions of CD4+ and CD8+ T cells in the target organ of patients with biliary atresia. Gastroenterology. 2007;133:278–287. doi: 10.1053/j.gastro.2007.04.032. [DOI] [PMC free article] [PubMed] [Google Scholar]
- 12.Hadchouel M, Hugon RN, Odievre M. Immunoglobulin deposits in the biliary remnants of extrahepatic biliary atresia: a study by immunoperoxidase staining in 128 infants. Histopathology. 1981;5:217–221. doi: 10.1111/j.1365-2559.1981.tb01779.x. [DOI] [PubMed] [Google Scholar]
- 13.Barnes BH, Tucker RM, Wehrmann F, et al. Cholangiocytes as immune modulators in rotavirus-induced murine biliary atresia. Liver Int. 2009;29:1253–1261. doi: 10.1111/j.1478-3231.2008.01921.x. [DOI] [PMC free article] [PubMed] [Google Scholar]
- 14.Terrier B, Degand N, Guilpain P, et al. Alpha-enolase: a target of antibodies in infectious and autoimmune disease. Autoimmun Rev. 2007;6:176–182. doi: 10.1016/j.autrev.2006.10.004. [DOI] [PubMed] [Google Scholar]
- 15.Shevchenko A, Tomas H, Havlis J, et al. Ingel digestion for mass spectrometric characterization of proteins and proteomes. Nat Protoc. 2006;1:2856–2860. doi: 10.1038/nprot.2006.468. [DOI] [PubMed] [Google Scholar]
- 16.Pappin DJC, Hojrup P, Bleasby AJ. Rapid identification of proteins by peptide-mass fingerprinting. Curr Biol. 1993;3:327–332. doi: 10.1016/0960-9822(93)90195-t. [DOI] [PubMed] [Google Scholar]
- 17.Roozendaal C, deJong MA, van den Berg AP, et al. Clinical significance of anti-neutrophil cytoplasmic antibodies (ANCA) in autoimmune liver disease. J Hepatol. 2000;32:734–741. doi: 10.1016/s0168-8278(00)80241-x. [DOI] [PubMed] [Google Scholar]
- 18.Press JL. Neonatal immunity and somatic mutation. Intern Rev Immunol. 2000;19:265–287. doi: 10.3109/08830180009088508. [DOI] [PubMed] [Google Scholar]
- 19.Lundberg K, Kinloch A, Fisher BA, et al. Antibodies to citrullinated α-enolase peptide 1 are specific for rheumatoid arthritis and cross-react with bacterial enolase. Arthritis Rheum. 2008;58:3009–3019. doi: 10.1002/art.23936. [DOI] [PubMed] [Google Scholar]
- 20.Czech-Schmidt G, Verhagen W, Szavay P, et al. Immunological gap in the infectious animal model for biliary atresia. J Surg Res. 2001;101:62–67. doi: 10.1006/jsre.2001.6234. [DOI] [PubMed] [Google Scholar]
- 21.Pancholi V. Multifunctional α-enolase: its role in disease. Cell Mol Life Sci. 2001;58:902–920. doi: 10.1007/PL00000910. [DOI] [PMC free article] [PubMed] [Google Scholar]
- 22.Fukuda Y, Miyazawa Y, Imoto M, et al. In situ distribution of enolase isozymes in chronic liver disease. Am J Gastroenterol. 1989;84:601–605. [PubMed] [Google Scholar]
- 23.Akisawa N, Maeda T, Iwasaki S, et al. Indentification of an autoantibody against α-enolase in primary biliary cirrhosis. J Hepatol. 1997;26:845–851. doi: 10.1016/s0168-8278(97)80251-6. [DOI] [PubMed] [Google Scholar]
- 24.Orth T, Kellner R, Diekmann O, et al. Identification and characterization of autoantibodies against catalase and α-enolase in patients with primary sclerosing cholangitis. Clin Exp Immunol. 1998;112:507–515. doi: 10.1046/j.1365-2249.1998.00583.x. [DOI] [PMC free article] [PubMed] [Google Scholar]
- 25.Moodie FDL, Leaker B, Cambridge G, et al. Alpha-enolase: a novel cytosolic autoantigen in ANCA positive vasculitis. Kidney Int. 1993;43:675–681. doi: 10.1038/ki.1993.97. [DOI] [PubMed] [Google Scholar]
- 26.Denisova E, Dowling W, LaMonica R, et al. Rotavirus capsid protein VP5* permeabilizes membrane. J Virol. 1999;73:3147–3153. doi: 10.1128/jvi.73.4.3147-3153.1999. [DOI] [PMC free article] [PubMed] [Google Scholar]
- 27.Dowling W, Denisova E, LaMonica R, et al. Selective membrane permeabilization by the rotavirus VP5* protein is abrogated by mutations in an internal hydrophobic domain. J Virol. 2000;74:6368–6376. doi: 10.1128/jvi.74.14.6368-6376.2000. [DOI] [PMC free article] [PubMed] [Google Scholar]
- 28.Dormitzer PR, Nason EB, Prasad BVV, et al. Structural rearrangements in the membrane penetration protein of a non-enveloped virus. Nature. 2004;430:1053–1058. doi: 10.1038/nature02836. [DOI] [PMC free article] [PubMed] [Google Scholar]
- 29.Taniguchi K, Maloy WL, Nishikawa K, et al. Identification of cross-reactive and serotype 2-specific neutralization epitopes on VP3 of human rotavirus. J Virol. 1988;62:2421–2426. doi: 10.1128/jvi.62.7.2421-2426.1988. [DOI] [PMC free article] [PubMed] [Google Scholar]
- 30.Tihova M, Dryden KA, Bellamy AR, et al. Localization of membrane permeabilization and receptor binding sites on the VP4 hemagglutinin of rotavirus: implications for cell entry. J Mol Biol. 2001;314:985–992. doi: 10.1006/jmbi.2000.5238. [DOI] [PubMed] [Google Scholar]
- 31.Mackow ER, Barnett JW, Chan H, et al. The Rhesus rotavirus outer capsid protein VP4 functions as a hemagglutinin and is antigenically conserved when expressed by a Baculovirus recombinat. J Virol. 1989;63:1661–1668. doi: 10.1128/jvi.63.4.1661-1668.1989. [DOI] [PMC free article] [PubMed] [Google Scholar]
- 32.Münz C, Lünemann JD, Getts MT, et al. Antiviral immune responses: triggers of or triggered by autoimmunity? Nat Rev Immunol. 2009;9:246–258. doi: 10.1038/nri2527. [DOI] [PMC free article] [PubMed] [Google Scholar]
- 33.Oldstone MBA. Molecular and cellular mechanisms, pathogenesis and treatment of insulin-dependent diabetes obtained through study of a transgenic model of molecular mimicry. Curr Top Microbiol Immunol. 2005;296:65–87. doi: 10.1007/3-540-30791-5_5. [DOI] [PubMed] [Google Scholar]
- 34.Bussone G, Dib H, Dimitrov JD, et al. Identification of target antigens of self-reactive IgG in intravenous immunoglobulin preparations. Proteomics. 2009;9:1–10. doi: 10.1002/pmic.200800819. [DOI] [PubMed] [Google Scholar]
- 35.Robinson WH, DiGennaro C, Hueber W, et al. Autoantigen microarrays for multiplex characterization of autoantibody response. Nat Med. 2002;8:295–301. doi: 10.1038/nm0302-295. [DOI] [PubMed] [Google Scholar]
- 36.Krebs P, Kurrer M, Sahin U, et al. Autoimmunity seen through the SEREX-scope. Autoimmun Rev. 2003;2:339–345. doi: 10.1016/s1568-9972(03)00047-8. [DOI] [PubMed] [Google Scholar]