

SUMMARY
It is not easy to determine the location of the cerebral generators and the other brain regions that may be involved at the time of an epileptic spike seen in the scalp EEG. The possibility to combine EEG recording with functional MRI scanning (fMRI) opens the opportunity to uncover the regions of the brain showing changes in metabolism and blood flow in response to epileptic spikes seen in the EEG. These regions are presumably involved in the abnormal neuronal activity at the origin of epileptic discharges. This paper reviews the methodology involved in performing such studies, including the special techniques required for recording the EEG inside the scanner and the statistical issues in analyzing the fMRI signal. We then discuss the results obtained in patients with different types of focal epileptic disorders and in patients with primary generalized epilepsy. The results in general indicate that interictal epileptic discharges may affect brain areas well beyond the presumed region in which they are generated. The noninvasive nature of this method opens new horizons in the investigation of brain regions involved and affected by epileptic discharges.
Keywords: FMRI, BOLD response, Epilepsy, Spikes, Localization, Activation, Deactivation
Functional magnetic resonance imaging (fMRI) is a powerful and noninvasive method that allows the localization of brain regions in which there is a change in the level of neuronal activity during an experimental condition compared to a control condition. The change in the level of neuronal activity is accompanied by a change in the ratio of concentration of oxy- and deoxyhemoglobin in blood. This change can be measured through the Blood Oxygen Level Dependent (BOLD) effect (Kwong et al., 1992; Ogawa et al., 1992). fMRI is mostly used in the study of sensory, motor, and cognitive functions, where the experimental condition differs from the control condition in a way that is controlled by the experimenter. In the context of epilepsy, one can consider the control condition to occur when the EEG is at baseline and the experimental condition to correspond to the presence of an epileptic discharge.
To define such an experimental condition, it is necessary to record the EEG while the subject is in the MR scanner. Given the intensity of the magnetic field inside a scanner (1 to 7 Tesla), it would seem impossible to record an electrical signal such as the EEG, which is of very low amplitude and therefore very sensitive to external electromagnetic interference. The pioneering study of Ives and colleagues demonstrated that it is possible to record the EEG in such a hostile environment (Ives et al., 1993). This study and other technological advancements result in the possibility to combine EEG and fMRI in the study of epileptic disorders, and therefore to determine the regions of the brain in which there is a change in the BOLD signal as a result of an epileptic discharge seen on scalp EEG, wherever that change takes place in the brain. One can hypothesize that this region is where the spike originates, in a similar way that SPECT studies are performed at the time of epileptic seizures to determine the regions of increased blood flow, which presumably reflect the intense neuronal activity of the seizure discharge (Newton et al., 1993; Berkovic, 2000).
The methods that have been developed for recording and analyzing the EEG in the MR scanner will be presented first, followed by the methods required to analyze the BOLD signal resulting from epileptic discharges. I will then review results in different clinical populations, and finally discuss the difficult issue of the interpretation of EEG–fMRI results in epilepsy. Throughout this paper, I will report primarily results from our laboratory, although much work has also been done in other centers. The work of others is generally in concordance with ours.
Methods
EEG recording in the scanner
Patient safety and EEG quality
The recording of EEG during fMRI scanning raises several questions concerning the safety of the patient and the quality of the resulting EEG and MRI signals. EEG electrodes are metallic and therefore it is possible that the rapidly changing magnetic fields associated with scanning will induce a current within the electrode, which could lead to heating and localized burn to the patient’s scalp. Although this is a potential issue, it has been shown that using nonferrous electrodes and leads, perhaps with current-limiting resistors (Lemieux et al., 1997), and avoiding current loops involving the patient (Lazeyras et al., 2001), result in safe recordings.
The quality of the EEG within the scanner is reduced compared to the EEG outside because of the presence of conducting electrodes and wires within the static magnetic field. Several factors are involved in this reduction, such as small movements of the electrode wires caused by subtle head movements or vibrations of the scanner. We found, however, that a careful EEG setup, involving immobilization of the wires between the head and the amplifier with sand bags, of the head with a vacuum cushion and of the wires by a head bandage, results in very acceptable quality (Bénar et al., 2003).
During scanning the situation is different. While the currents induced in the electrodes and leads by the rapidly changing magnetic fields may be sufficiently small to be safe for the patient, they result in artifacts on the EEG, which can be of the order of 50 times the background EEG (“gradient artifacts”). In order to remove such large artifacts, they must be recorded with an amplifier having a dynamic range sufficiently large to prevent saturation. Several commercial amplifiers are now available, that can be placed in the scanner room and allow short cables from the electrodes to the amplifier (minimizing noise pick-up), and are connected to a recording computer outside the scanner room via an optic fiber cable. The optic cable ensures the absence of an electrically conductive bridge between the outside and the inside of the scanner room, which would break the magnetic shielding of the scanner room and deteriorate the quality of MR images. In general, good quality MR images can be achieved despite the EEG apparatus (Krakow et al., 2000).
Gradient and pulse artifact removal
The most widely used method to remove the gradient artifact was originally proposed by Allen et al. (2000) and consists of estimating the artifact and subtracting it from each frame, followed by adaptive noise cancellation. For this approach to be valid, the assumption is made that the recorded signal consists of artifact plus EEG, which is reasonable assuming that the amplifier remains within the linear range (i.e., does not saturate). Moreover, the artifact must have been faithfully recorded, which requires a sampling rate of several kHz (Fig. 1). Several variations on the subtraction scheme have been proposed (Goldman et al., 2000; Anami et al., 2003; Bénar et al., 2003; Garreffa et al., 2003; Negishi et al., 2004). Another artifact that is often observed on the EEG recorded within the scanner is the pulse or ballistocardiogram artifact. This consists of deviations following each heartbeat and possibly originates from small movements of the head or the electrodes following each pulsation because of fast movement of the blood in the arteries. It has been noted from the first report as one of the main problems when recording EEG in an MR scanner (Ives et al., 1993). It can be removed by averaging and subtraction (Allen et al., 1998), adaptive filtering (Bonmassar et al., 2002), wavelet filtering (Kim et al., 2004), or independent component analysis (ICA) (Bénar et al., 2003; Srivastava et al., 2005). An example is shown in Fig. 2. This artifact is more prominent with magnets of higher field strengths.
Figure 1.
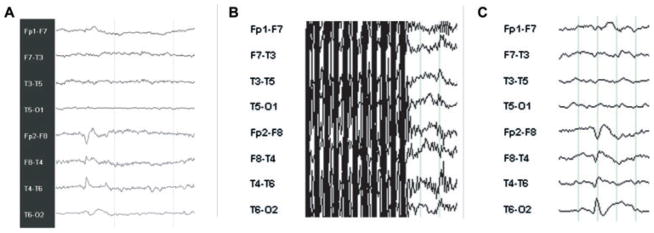
Eight channels bipolar EEG samples to illustrate quality of recordings. (A) Routine EEG with normal electrodes in the EEG laboratory, showing a right temporal spike with equipotentiality at F8-T4. (B) EEG acquired inside the scanner with Ag/AgCl electrodes during the acquisition of EPI sequences, during which EEG activity is not visible. (C) same segment as in B, after removal of the MRI artifact and filter, disclosing a spike similar to that shown in A.
Epilepsia © ILAE
Figure 2.
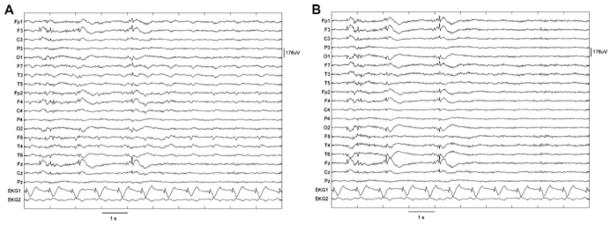
Results of ballistocardiogram removal. (A) Original recording. (B) After independent component analysis (ICA) filtering. The epileptic spikes were left intact and ICA filtering essentially eliminated ballistocardiographic activity (from Bénar et al., 2003).
Epilepsia © ILAE
Acquisition and analysis of MR images
fMRI scanning protocol: EEG-triggered or continuous
One method of avoiding the problems associated with the gradient artifact is to only scan after the observation of an EEG event, triggering fMRI acquisition 3 or 4 s after each spike, when the hemodynamic response is presumed to be close to its maximum. An equivalent number of baseline frames also has to be acquired to allow statistical comparison of the post-event and baseline periods. This technique was widely used in the first reports of combined EEG-fMRI (Warach et al., 1996; Seeck et al., 1998; Krakow et al., 1999), but has several drawbacks: Only as many frames as spikes can be acquired in total; low-frequency drifts cannot be taken into account; and an experienced observer needs to be actively monitoring the EEG during the whole session.
The most common method is to scan continuously and filter the gradient artifact afterwards as described above, thus revealing the timing of epileptic spikes. An electroencephalographer identifies epileptic events after artifact removal. This has a higher sensitivity to detect spike-related signal changes than triggered acquisition (Al-Asmi et al., 2003). Continuous recording also has the advantage that the hemodynamic response function (HRF) can be calculated, which allows more detailed investigation of the link between neuronal activity and vascular response (neurovascular coupling). For example, since the HRF associated with a spike lasts 10–15 s (Lemieux et al., 2001; Bénar et al., 2002), the issue of linearity becomes relevant if spikes are separated by less than this duration (Buckner, 1998). Also, very little work has been done to determine whether the hemodynamic response to epileptic activity is equivalent to that to normal brain function, although there are suggestions that neurovascular coupling is preserved in patients with epilepsy (Bagshaw et al., 2005; Stefanovic et al., 2005).
Patients’ movements and preprocessing of fMRI data
Patient movement can have a severe effect on the quality of fMRI data, particularly over the course of a long scanning session such as those required for obtaining a reasonable number of spikes. The patients have to remain as still as possible throughout the scanning session. However, even the most cooperative patient will move slightly over the course of 2 h, and image realignment is usually necessary and provided by most statistical processing packages. This can only go some way towards correcting the problem and scans with more than a few millimeters of movement are unlikely to be usable. Realigning the images is not sufficient for complete recovery of the fMRI signal, as pointed out by Friston and colleagues, who used the parameters of motion correction as regressors in the statistical analysis (Friston et al., 1996; Salek-Haddadi et al., 2003). Following motion correction, images are smoothed, which helps to reduce noise. A Gaussian filter of 6–8 mm full width at half maximum is generally used.
Statistical analysis and interpretation
In event-related fMRI (Josephs et al., 1998), the statistical methods most widely used are probably those developed by Worsley and Friston (Friston et al., 1995; Worsley & Friston, 1995; Worsley et al., 2002). In this approach, the signal at each voxel is statistically compared with a model constructed by convolving impulses corresponding to the timing of the spikes (the events) with the HRF. A statistical map (t or F statistic) is constructed where the value at each voxel reflects the resemblance between the model and the data, and therefore the plausibility that this voxel is activated in response to the spikes. A wide variety of functions have been used to describe the HRF. The simplest uses a standard HRF, which is the measured response to a brief stimulus, such as an auditory tone (Glover, 1999). The model assumes that following each spike the BOLD signal will change according to the shape of the HRF. This does not take into account differences related to age, differences between control subjects and patients, between patients, between different brain regions, or between sessions within a single patient, although it is known that these effects can be considerable (Aguirre et al., 1998). Several approaches allow for variability in the shape and timing of the modeled HRF. One is to add the derivative of the HRF to capture small departures from a standard model (Friston et al., 1998a). Another is to analyze the data with a series of standard HRFs with different latencies (Bagshaw et al., 2004) or, when even more flexibility is required, a set of basis functions can be used, such as sines and cosines (“Fourier set”) (Josephs et al., 1998) or consecutive impulse functions (“finite impulse response,” or FIR) (Henson et al., 2001).
Low-frequency drifts in the fMRI data, which possibly originate from scanner instability (Smith et al., 1999), must also be modeled. This can be accomplished by using a third-order polynomial, although this may not always be flexible enough (Bénar et al., 2002), or by using a basis set of sine and cosine functions (Holmes et al., 1997), which is similar to Fourier filtering.
The analysis usually results in a statistical parametric map. This shows the probability of the data from each voxel being correlated with the model, in the form of the t or F statistics. In order to interpret the map, a statistical threshold is applied so that only voxels above the threshold remain. This reveals the regions that are presumably involved in the generation of the spikes. The threshold can either be calculated based on a Bonferroni correction, which takes into account the many comparisons inherent in the univariate approach of testing on a voxel wise basis, or by examining the magnitude of random excursions in the t or F fields (Worsley et al., 1996). In the final interpretation of the map, it is worth remembering that BOLD fMRI is prone to recording signal changes from large draining veins (Lai et al., 1993), which may be at some distance from the actual site of neuronal activation (Turner, 2002).
Clinical Epilepsy Studies
We will review two interictal studies of patients with focal epilepsy and a study of patients with primary generalized epilepsy.
Focal epilepsy
We studied a series of temporal lobe epilepsy patients with a variety of underlying structural abnormalities (Kobayashi et al., 2006a), and assessed the involvement of the temporal and extratemporal regions as the result of temporal lobe spiking activity. We analyzed 35 EEG–fMRI studies derived from 27 patients who showed spikes during scanning. BOLD responses occurred in 83% of studies, predominantly in the spiking temporal lobe, and manifested as activation or deactivation. Responses were sometimes very focal (Fig. 3), but often involved also the contralateral homologous cortex as well as extra-temporal regions, suggesting a widespread effect of temporal lobe epileptic spikes (Fig. 4). The frequent involvement of the contralateral homologous region, at a time when the spike is unilateral, is an unexpected finding. It could be argued that a “projected” spike is indeed present in the contralateral side but is too small to be seen with scalp electrodes; if intracranial electrodes were present, it would be visible. This is in fact unlikely as bitemporal intracerebral studies very rarely show synchronous spikes in the two temporal lobes. The contralateral response may be due to projected neuronal activity that is not sufficiently synchronized to be visible in the EEG.
Figure 3.

EEG–fMRI findings from study 43, in a patient with a remote left amygdalohippocampectomy (bottom right) for left hippocampal atrophy. (A) EEG recorded in the scanner showing left temporal (LT) spikes (F7-T3-T5). The large gradient artifact was filtered, leaving, nevertheless, some transient waveforms. The epileptic discharges of this patient could be identified unambiguously from their morphology and spatial distribution. (B) Posterior LT lobe activation associated with a smaller and less significant activation in the contralateral homologous region. From Kobayashi et al. (2006a).
Epilepsia © ILAE
Figure 4.
Blood oxygenation level-dependent response to F7-T3 spikes (study 14), in a patient with bilateral amygdala enlargement, showing bilateral frontotemporal activation, maximum in the perisylvian regions and superior temporal gyri. Note also the involvement of other extratemporal areas including the thalami. From Kobayashi et al. (2006a).
Epilepsia © ILAE
The responses outside the temporal lobe may be similarly caused by activity projected from the epileptic focus. It is possible that unspecific changes take place as a result of activation of regions such as the thalamus, as in the case of the patient illustrated in Fig. 4.
We also evaluated a series of patients with grey matter heterotopia (Kobayashi et al., 2006b), These patients, as the temporal lobe group, showed a broad spectrum of results, including activations and deactivations, sometimes located in or very close to the lesion, and sometimes in a region unrelated to the lesion. Fig. 5 shows the example of a patient with nodular heterotopia and an activation circumscribed to the nodule. The posterior temporal spike recorded in this patient is almost certainly generated by neurons located in the cortex overlying the nodule (if it were generated by neurons located in the nodule, it could not have the large amplitude that was seen on the scalp). The fMRI study indicates that there must be an intense discharge in the nodule at the time of the scalp EEG discharge, information that could otherwise only be obtained with intracerebral electrodes (Aghakhani et al., 2005).
Figure 5.

EEG–fMRI study from a patient with a periventricular nodule located in the right occipital horn (arrow, A), related to right temporal spikes and polyspikes. Activation (B) was observed in the nodule, also involving the mesial aspect of the occipital lobe. Deactivation (C) was seen bilaterally in the mesial occipital regions, but did not coincide with activation. From Kobayashi et al. (2006b).
Epilepsia © ILAE
Generalized epilepsy
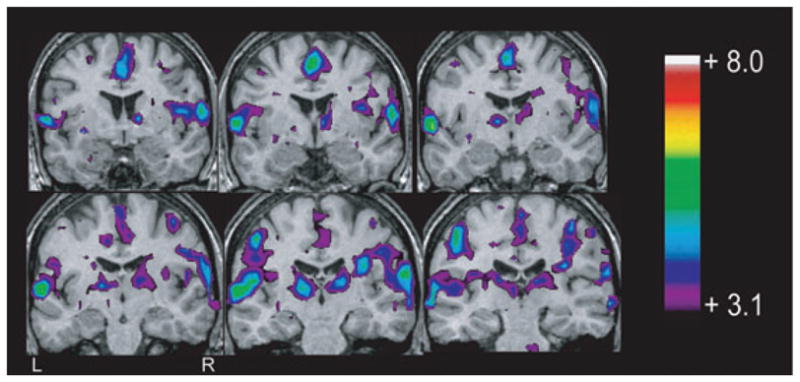
Aghakhani et al. (2004) studied a group of patients with idiopathic generalized epilepsy (IGE), selected on the basis of frequent bursts of generalized spike or polyspikes and wave activity. In this group of patients, 14 of 15 studies in which EEG bursts were present showed a BOLD response. Responses were found in the thalamus, most often in the form of activation, and were widespread, bilateral, and symmetrical in the cerebral cortex, predominantly in the form of deactivation (although activations were also commonly seen). This study clearly demonstrated an involvement of the thalamus in generalized spike–wave bursts of IGE, providing further evidence for the thalamocortical circuit involvement in the generation of interictal and ictal spike-and-wave activity. Secondly, in contrast to the predominantly frontal EEG distribution of the spike-and-wave activity, the BOLD response was more diffuse and the posterior head regions were almost as involved as the frontal areas. A group analysis later performed in this series of IGE patients (Gotman et al., 2005), showed bilateral activations in the thalamus, mesial frontal region, insulae, midline cerebellum, and on the borders of the lateral ventricles. Deactivations were found bilaterally in the anterior frontal and parietal regions and in the posterior cingulate gyri (Fig. 6), in a pattern very similar to that seen in the “default” state of the brain hypothesized by Raichle and collaborators (Raichle et al., 2001; Laufs et al., 2003). The default state of the brain is a state in which the brain is attentive but not engaged in any specific activity. As soon as it performs a specific activity, this state is suspended. We hypothesize that during spike-and-wave discharges, the default state of the brain may also be suspended; in this case it is not because the brain is engaged in a specific task, but because it is “absent,” that is not attentive (we realize that the patients we evaluated did not have clinical absence attacks with every spike–wave bursts, but they probably have a mild, possibly not visible by casual observation, decrease in attention). Thus, the symptom of absence may not result directly from the frontal discharge seen in the EEG, but from this lifting of the default state of the brain, which occurs as a result of the discharge.
Figure 6.

Significant negative blood oxygen level dependent (BOLD) response observed from the group analysis of 15 idiopathic generalized epilepsy (IGE) patients obtained by using hemodynamic response function (HRF) peaking at 9 s, corrected p < 0.05 for spatial extent. (A) Axial view showing bilateral deactivations in mesial and lateral anterior frontal areas and in the left posterior temporal area. (B) Axial view 1 cm higher than A and showing deactivations in frontal regions, in parietal areas, and in the posterior cingulate gyrus. (C) Axial view 2 cm above B and showing the same frontal and parietal clusters. (D) Sagittal view of the right hemisphere 1 cm away from the midline and showing a deactivation within the mesial prefrontal area and the posterior cingulate gyrus (from Gotman et al., 2005).
Epilepsia © ILAE
Activation and Deactivation
In most fMRI studies of sensory, motor, and cognitive functions, the paradigm implies that the experimental condition activates a part of the brain more than the control condition. For instance, there can be a contrast between auditory stimulation and silence, motor activity and rest, and hearing words in contrast to nonword sounds. It is expected that the target condition results in a higher level of neuronal activity, thus an increase in the BOLD signal (or activation). Increases in postsynaptic activity, whether excitatory or inhibitory, result in an increase in oxidative metabolism (Attwell & Laughlin, 2001) and eventually in an increase in the BOLD signal. Action potentials, on their own, appear to play a lesser role in explaining changes in the BOLD signal. In this view, an increased BOLD signal in a given region results from increased synaptic activity, because action potentials arrive in that region and create post-synaptic activity or because of a change in local circuitry.
Sensory and cognitive tasks may, however, result in a decrease in the BOLD signal (or deactivation), when comparing the experimental condition to the control condition (Czisch et al., 2002). Such deactivations are common in response to epileptic discharges (Kobayashi et al., 2006c). Four mechanisms can be envisaged to explain this phenomenon: (1) a relative reduction of cerebral blood flow (CBF) in the deactivated areas is caused by a steal phenomenon secondary to the increased CBF in activated regions. This can only explain a decrease that is adjacent to a region of increased BOLD signal. (2) There is an abnormal coupling between neuronal activity and regional CBF. If increased neuronal activity is not accompanied by the usual increase in blood flow, for instance in pathological conditions involving the cerebral circulation, then a decrease in the BOLD signal will be observed. A preserved neurovascular coupling has in fact been demonstrated in epileptic patients, during a motor task and at the time of interictal epileptic discharges (Stefanovic et al., 2005). (3) Regions of deactivation correspond to decreased synaptic activity, such as that caused by reduced neuronal input or by functional deafferentation, (Logothetis, 2003) compared to the control condition. (4) GABAergic-mediated inhibition results in a profound decrease in neuronal firing and at a very low cost of energy (Chatton et al., 2003; Stefanovic et al., 2004). On balance, this would result in a decrease in energy requirements (neuronal firing is not the major contributor to energy demands but is nevertheless a significant factor).
We found that both focal and generalized epileptic discharges are frequently associated with deactivation (Aghakhani et al., 2004; Kobayashi et al., 2006c; Jacobs et al., 2007). This is a surprising finding as it is usually expected that an epileptic discharge results from intense neuronal activity, which should cause an increase in BOLD signal. We believe that this could be explained either by a reduced synaptic activity or by a low energy requirement GABAergic inhibition (hypotheses 3 and 4).
Discussion
These studies illustrate the potential of combining EEG and fMRI in the understanding of the pathophysiological mechanisms of epileptic discharges. The method of continuous scanning followed by the removal of the scanning artifact from the EEG is probably the most efficient for data acquisition. Differences are present in the results between the expected EEG source of the scalp EEG discharge and the regions of BOLD response. Some of these differences may be caused by problems inherent to the fMRI data collection and analysis. It is probable that some of the responses we have seen are “noise” in the sense that they do not correspond to a genuine change in the BOLD signal. They may be caused by technical artifacts, such as movement, an erroneous HRF model, or inappropriate statistical approaches. Despite this noise, the vast majority of responses can be considered valid, in the sense that they make sense in the context of our understanding of an epileptic condition (e.g., activation of a nodule, Fig. 5), or they show consistency across patients with similar events (patients with spike-and-wave and IGE). BOLD responses are all the more interesting when they do not correspond to where we expect the main neuronal activation to take place: these cases teach us something new about an epileptic discharge. If we expect a spike to be generated in the neocortex and the BOLD activation is in a nodule, the two do not match, but we have learned that the nodule may be the source of the discharge. If we see a contralateral homologous BOLD increase at the time of a unilateral discharge, we can infer that the discrepancy may tell us that there may be nonsynchronized neuronal activity involved at a distance from the EEG epileptic discharge.
More generally, it is important to keep in mind that one cannot expect a strict one-to-one correspondence between the EEG and fMRI observations. First, the EEG records only activity from superficial cortical layers, whereas the BOLD signal is measured everywhere. Second, we are measuring very different types of activity, one electrical and the other based on a venous response to metabolic changes (where BOLD results from complex interactions between blood flow, blood volume, and O2 consumption). It is likely that in some cases one modality measures activity to which the other is blind. For this reason EEG and fMRI should be regarded as providing complementary information.
The majority of patients with focal and generalized epileptic activity now show BOLD responses in relation to the EEG events, although the optimal method of data analysis remains to be specified. A future challenge will be to adapt fMRI analysis techniques to the specific requirements of epileptic activity, in contrast to using techniques developed for functional activation. Some approaches do not rely on the linear assumption, such as that presented by Friston et al. (1998b). Others, such as temporal clustering, attempt to analyze the BOLD signal independently of the occurrence of spikes in the EEG (Gao & Yee, 2003; Morgan et al., 2004). In the deconvolution approach, no assumption is made with respect to the HRF (Lu et al., 2006, 2007). In the ICA approach (McKeown et al., 1998), fMRI data sets are decomposed into spatially independent components. One or several of these components could be related to epileptic activity. With some of these methods, it would be possible to detect epileptic activity anywhere in the brain, independently of its presence on the scalp EEG.
The significance of the different BOLD responses also remains to be fully evaluated. In particular, the presence of both activation and deactivation is puzzling in the context of epilepsy, where one expects that excessive neuronal firing is the predominant phenomenon and that it would lead exclusively to activation. It is not clear why negative responses are seen more frequently in children (Jacobs et al., 2007), although it is possible that the sedation required for the scan may play a role.
In generalized spike–wave discharges, the combination of activation and deactivation may be explained in a different way and may give a clue regarding the interpretation of deactivations in some situations. Activation was found in the thalamus, insula and mesial mid-frontal region, as well as in the cerebellum, bilaterally; deactivation was observed in anterior frontal and parietal regions, also bilaterally, in a global pattern strongly reminiscent of the proposed default state of the brain (Raichle et al., 2001). This would imply that this default state, present during the rest period between epileptic discharges, is suspended during these discharges. The mechanism by which this occurs may be related to thalamic activity but this deactivation does not result directly from firing of neurons that are part of the epileptic discharge, but from the indirect effect of the discharge on attention mechanisms. It is now possible to perform similar studies in experimental animals and these may shed some light on the human results (Tenney et al., 2003; 2004).
Most studies have been done with 1.5T MR machines, although a few have used 3T. As more studies are performed with 3T, one might expect a better sensitivity in detection of BOLD changes, but also worsening of some problems: the susceptibility artifact will result in higher signal loss, the ballistocardiogram and head movements will result in worse artifacts in the EEG. Since there are good methods for artifact removal, one can hope that studies at 3T will increase the yield of EEG-fMRI studies in epilepsy.
In conclusion, combining EEG and fMRI appears a promising tool in the study of epileptic discharges. Although the technique is not simple, it is now very feasible and opens a new way to investigate the source and the effect of epileptic activity. Its application to individual patients for the purpose of localizing epileptogenic regions is not yet warranted, as more needs to be learned about the meaning of the various responses. It could be considered, however, in the context of indicating potential regions for further investigation, such as focused anatomical MRI analysis or possibly electrode implantation (Zijlmans et al., 2007).
Acknowledgments
This work was supported by grant MOP 38079 of the Canadian Institutes of Health Research.
Footnotes
Conflict of interest: The author has no conflict of interest.
References
- Aghakhani Y, Bagshaw AP, Bénar CG, Hawco C, Andermann F, Dubeau F, Gotman J. fMRI activation during spike and wave discharges in idiopathic generalized epilepsy. Brain. 2004;127:1127–1144. doi: 10.1093/brain/awh136. [DOI] [PubMed] [Google Scholar]
- Aghakhani Y, Kinay D, Gotman J, Soualmi L, Andermann F, Olivier A, Dubeau F. The role of periventricular nodular heterotopia in epileptogenesis. Brain. 2005;128:641–651. doi: 10.1093/brain/awh388. [DOI] [PubMed] [Google Scholar]
- Aguirre GK, Zarahn E, D’esposito M. The variability of human, BOLD hemodynamic responses. Neuroimage. 1998;8:360–369. doi: 10.1006/nimg.1998.0369. [DOI] [PubMed] [Google Scholar]
- Al-Asmi A, Bénar CG, Gross DW, Khani YA, Andermann F, Pike B, Dubeau F, Gotman J. fMRI activation in continuous and spike-triggered EEG-fMRI studies of epileptic spikes. Epilepsia. 2003;44:1328–1339. doi: 10.1046/j.1528-1157.2003.01003.x. [DOI] [PubMed] [Google Scholar]
- Allen PJ, Polizzi G, Krakow K, Fish DR, Lemieux L. Identification of EEG events in the MR scanner: the problem of pulse artifact and a method for its subtraction. Neuroimage. 1998;8:229–239. doi: 10.1006/nimg.1998.0361. [DOI] [PubMed] [Google Scholar]
- Allen PJ, Josephs O, Turner R. A method for removing imaging artifact from continuous EEG recorded during functional MRI. Neuroimage. 2000;12:230–239. doi: 10.1006/nimg.2000.0599. [DOI] [PubMed] [Google Scholar]
- Anami K, Mori T, Tanaka F, Kawagoe Y, Okamoto J, Yarita M, Ohnishi T, Yumoto M, Matsuda H, Saitoh O. Stepping stone sampling for retrieving artifact-free electroencephalogram during functional magnetic resonance imaging. Neuroimage. 2003;19:281–295. doi: 10.1016/s1053-8119(03)00048-x. [DOI] [PubMed] [Google Scholar]
- Attwell D, Laughlin SB. An energy budget for signaling in the grey matter of the brain. J Cerebral Blood Flow & Metabolism. 2001;21:1133–1145. doi: 10.1097/00004647-200110000-00001. [DOI] [PubMed] [Google Scholar]
- Bagshaw AP, Aghakhani Y, Bénar CG, Kobayashi E, Hawco C, Dubeau F, Pike GB, Gotman J. EEG-fMRI of focal epileptic spikes: analysis with multiple haemodynamic functions and comparison with gadolinium-enhanced MR angiograms. Hum Brain Mapp. 2004;22:179–192. doi: 10.1002/hbm.20024. [DOI] [PMC free article] [PubMed] [Google Scholar]
- Bagshaw AP, Hawco C, Bénar C-G, Kobayashi E, Aghakhani Y, Dubeau F, Pike GB, Gotman J. Analysis of the EEG-fMRI response to prolonged bursts of interictal epileptiform activity. Neuroimage. 2005;24:1099–1112. doi: 10.1016/j.neuroimage.2004.10.010. [DOI] [PubMed] [Google Scholar]
- Bénar CG, Gross DW, Wang Y, Petre V, Pike B, Dubeau F, Gotman J. The BOLD response to interictal epileptiform discharges. Neuroimage. 2002;17:1182–1192. doi: 10.1006/nimg.2002.1164. [DOI] [PubMed] [Google Scholar]
- Bénar C, Aghakhani Y, Wang Y, Izenberg A, Al-Asmi A, Dubeau F, Gotman J. Quality of EEG in simultaneous EEG-fMRI for epilepsy. Clin Neurophysiol. 2003;14:569–580. doi: 10.1016/s1388-2457(02)00383-8. [DOI] [PubMed] [Google Scholar]
- Berkovic SF. SPECT: neurobiology of periictal blood flow alterations. Adv Neurol. 2000;83:33–39. [PubMed] [Google Scholar]
- Bonmassar G, Purdon PL, Jaaskelainen IP, Chiappa K, Solo V, Brown EN, Belliveau JW. Motion and ballistocardiogram artifact removal for interleaved recording of EEG and EPs during MRI. Neuroimage. 2002;16:1127–1141. doi: 10.1006/nimg.2002.1125. [DOI] [PubMed] [Google Scholar]
- Buckner RL. Event-related fMRI and the hemodynamic response. Hum Brain Mapp. 1998;6:373–377. doi: 10.1002/(SICI)1097-0193(1998)6:5/6<373::AID-HBM8>3.0.CO;2-P. [DOI] [PMC free article] [PubMed] [Google Scholar]
- Chatton JY, Pellerin L, Magistretti PJ. GABA uptake into astrocytes is not associated with significant metabolic cost: implications for brain imaging of inhibitory transmission. Proc Natl Acad Sci USA. 2003;100:12456–12461. doi: 10.1073/pnas.2132096100. [DOI] [PMC free article] [PubMed] [Google Scholar]
- Czisch M, Wetter TC, Kaufmann C, Pollma cher T, Holsboer F, Auer DP. Altered processing of acoustic stimuli during sleep: reduced auditory activation and visual deactivation detected by a combined fMRI/EEG study. Neuroimage. 2002;16:251–258. doi: 10.1006/nimg.2002.1071. [DOI] [PubMed] [Google Scholar]
- Friston KJ, Holmes AP, Poline JB, Grasby PJ, Williams SC, Frackowiak RS, Turner R. Analysis of fMRI time-series revisited. Neuroimage. 1995;2:45–53. doi: 10.1006/nimg.1995.1007. [DOI] [PubMed] [Google Scholar]
- Friston KJ, Williams S, Howard R, Frackowiak RS, Turner R. Movement-related effects in fMRI time-series. Magn Reson Med. 1996;35:346–355. doi: 10.1002/mrm.1910350312. [DOI] [PubMed] [Google Scholar]
- Friston KJ, Fletcher P, Josephs O, Holmes A, Rugg MD, Turner R. Event-related fMRI: characterizing differential responses. Neuroimage. 1998a;7:30–40. doi: 10.1006/nimg.1997.0306. [DOI] [PubMed] [Google Scholar]
- Friston KJ, Josephs O, Rees G, Turner R. Nonlinear event-related responses in fMRI. Magn Reson Med. 1998b;39:41–52. doi: 10.1002/mrm.1910390109. [DOI] [PubMed] [Google Scholar]
- Gao JH, Yee SH. Iterative temporal clustering analysis for the detection of multiple response peaks in fMRI. Magn Reson Imaging. 2003;21:51–53. doi: 10.1016/s0730-725x(02)00627-6. [DOI] [PubMed] [Google Scholar]
- Garreffa G, Carni M, Gualniera G, Ricci GB, Bozzao L, De Carli D, Morasso P, Pantano P, Colonnese C, Roma V, Maraviglia B. Real-time MR artifacts filtering during continuous EEG/fMRI acquisition. Magn Reson Imaging. 2003;10:1175–1189. doi: 10.1016/j.mri.2003.08.019. [DOI] [PubMed] [Google Scholar]
- Glover GH. Deconvolution of impulse response in event-related BOLD fMRI. Neuroimage. 1999;9:416–429. doi: 10.1006/nimg.1998.0419. [DOI] [PubMed] [Google Scholar]
- Goldman RI, Stern JM, Engel J, Jr, Cohen MS. Acquiring simultaneous EEG and functional MRI. Clin Neurophysiol. 2000;111:1974–1980. doi: 10.1016/s1388-2457(00)00456-9. [DOI] [PubMed] [Google Scholar]
- Gotman J, Grova C, Bagshaw AP, Kobayashi E, Aghakhani Y, Dubeau F. Generalized epileptic discharges: Thalamo-cortical activation and suspension of the default state of the brain. Proc Natl Acad Sci USA. 2005;102:15236–15240. doi: 10.1073/pnas.0504935102. [DOI] [PMC free article] [PubMed] [Google Scholar]
- Henson RNA, Rugg MD, Friston KJ. The choice of basis functions in event-related fMRI. NeuroImage. 2001;13(Suppl 1):149. [Google Scholar]
- Holmes AP, Josephs O, Büchel C, Friston KJ. Statistical modeling of low-frequency confounds in fMRI. Proc. 3rd Int Conf on Functional Mapping of the Human Brain; Copenhagen, Denmark. 1997. p. S480. [Google Scholar]
- Ives JR, Warach S, Schmitt F, Edelman RR, Schomer DL. Monitoring the patient’s EEG during echo planar MRI. Electroencephalogr Clin Neurophysiol. 1993;87:417–420. doi: 10.1016/0013-4694(93)90156-p. [DOI] [PubMed] [Google Scholar]
- Jacobs J, Kobayashi E, Boor R, Muhle H, Wolff S, Hawco C, Dubeau F, Jansen O, Stephani U, Gotman J, Siniatchkin M. Hemodynamic responses to interictal epileptiform discharges in children with symptomatic epilepsy. Epilepsia. 2007;48:2068–2078. doi: 10.1111/j.1528-1167.2007.01192.x. [DOI] [PubMed] [Google Scholar]
- Josephs O, Turner R, Friston KJ. Event related fMRI. Human Brain Mapp. 1998;2:189–210. doi: 10.1002/(SICI)1097-0193(1997)5:4<243::AID-HBM7>3.0.CO;2-3. [DOI] [PubMed] [Google Scholar]
- Kim KH, Yoon HW, Park HW. Improved ballistocardiac artifact removal from the electroencephalogram recorded in fMRI. J Neurosci Methods. 2004;135:193–203. doi: 10.1016/j.jneumeth.2003.12.016. [DOI] [PubMed] [Google Scholar]
- Kobayashi E, Bagshaw AP, Benar CG, Aghakhani Y, Andermann F, Dubeau F, Gotman J. Temporal and extratemporal BOLD responses to temporal lobe interictal spikes. Epilepsia Feb. 2006a;47(2):343–354. doi: 10.1111/j.1528-1167.2006.00427.x. [DOI] [PubMed] [Google Scholar]
- Kobayashi E, Bagshaw AP, Grova C, Gotman J, Dubeau F. Grey Matter Heterotopia: what EEG-fMRI can teach us about epileptogenicity of neuronal migration disorders. Brain. 2006b;129:366–367. doi: 10.1093/brain/awh710. [DOI] [PubMed] [Google Scholar]
- Kobayashi E, Bagshaw AP, Grova C, Dubeau F, Gotman J. Negative BOLD responses to interictal epileptic spikes. Human Brain Mapp. 2006c;27:488–497. doi: 10.1002/hbm.20193. [DOI] [PMC free article] [PubMed] [Google Scholar]
- Krakow K, Woermann FG, Symms MR, Allen PJ, Lemieux L, Barker GJ, Duncan JS, Fish DR. EEG-triggered functional MRI of interictal epileptiform activity in patients with partial seizures. Brain. 1999;122:1679–1688. doi: 10.1093/brain/122.9.1679. [DOI] [PubMed] [Google Scholar]
- Krakow K, Allen PJ, Symms MR, Lemieux L, Josephs O, Fish DR. EEG recording during fMRI experiments: image quality. Hum Brain Mapp. 2000;10:10–15. doi: 10.1002/(SICI)1097-0193(200005)10:1<10::AID-HBM20>3.0.CO;2-T. [DOI] [PMC free article] [PubMed] [Google Scholar]
- Kwong KK, Belliveau JW, Chesler DA, Goldberg IE, Weisskoff RM. Dynamic magnetic resonance imaging of human brain activity during primary sensory stimulation. Proc Nat Acad Sci USA. 1992;89:5675–5679. doi: 10.1073/pnas.89.12.5675. [DOI] [PMC free article] [PubMed] [Google Scholar]
- Lai S, Hopkins AL, Haacke EM, Li D, Wasserman BA, Buckley P, Friedman L, Meltzer H, Hedera P, Friedland R. Identification of vascular structures as a major source of signal contrast in high resolution 2D and 3D functional activation imaging of the motor cortex at 1.5T: preliminary results. Magn Reson Med. 1993;30:387–392. doi: 10.1002/mrm.1910300318. [DOI] [PubMed] [Google Scholar]
- Laufs H, Krakow K, Sterzer P, Eger E, Beyerle A, Salek-Haddadi A, Kleinschmidt A. Electroencephalographic signatures of attentional and cognitive default modes in spontaneous brain activity fluctuations at rest. Proc Natl Acad Sci USA. 2003;100:11053–11058. doi: 10.1073/pnas.1831638100. [DOI] [PMC free article] [PubMed] [Google Scholar]
- Lazeyras F, Zimine I, Blanke O, Perrig SH, Seeck M. Functional MRI with simultaneous EEG recording: feasibility and application to motor and visual activation. J Magn Reson Imaging. 2001;13:943–948. doi: 10.1002/jmri.1135. [DOI] [PubMed] [Google Scholar]
- Lemieux L, Allen PJ, Franconi F, Symms MR, Fish DR. Recording of EEG during fMRI experiments: patient safety. Magn Reson Med. 1997;38:943–952. doi: 10.1002/mrm.1910380614. [DOI] [PubMed] [Google Scholar]
- Lemieux L, Salek-Haddadi A, Josephs O, Allen P, Toms N, Scott C, Krakow K, Turner R, Fish DR. Event-related fMRI with simultaneous and continuous EEG: description of the method and initial case report. Neuroimage. 2001;14:780–787. doi: 10.1006/nimg.2001.0853. [DOI] [PubMed] [Google Scholar]
- Logothetis NK. The underpinnings of the BOLD functional magnetic resonance imaging signal. J Neurosci. 2003;3:3963–3971. doi: 10.1523/JNEUROSCI.23-10-03963.2003. [DOI] [PMC free article] [PubMed] [Google Scholar]
- Lu Y, Bagshaw AP, Grova C, Kobayashi E, Dubeau F, Gotman J. Using voxel-specific hemodynamic response function in EEG-fMRI data analysis. Neuroimage. 2006;32(1):238–247. doi: 10.1016/j.neuroimage.2005.11.040. [DOI] [PubMed] [Google Scholar]
- Lu Y, Grova C, Kobayashi E, Dubeau F, Gotman J. Using voxel-specific hemodynamic response function in EEG-fMRI data analysis: an estimation and detection model. Neuroimage. 2007;34(1):195–203. doi: 10.1016/j.neuroimage.2006.08.023. [DOI] [PubMed] [Google Scholar]
- McKeown MJ, Makeig S, Brown GG, Jung TP, Kindermann SS, Bell AJ, Sejnowski TJ. Analysis of fMRI data by blind separation into independent spatial components. Hum Brain Mapp. 1998;6:160–188. doi: 10.1002/(SICI)1097-0193(1998)6:3<160::AID-HBM5>3.0.CO;2-1. [DOI] [PMC free article] [PubMed] [Google Scholar]
- Morgan VL, Price RR, Arain A, Modur P, Abou-Khalil B. Resting functional MRI with temporal clustering analysis for localization of epileptic activity without EEG. Neuroimage. 2004;21:473–481. doi: 10.1016/j.neuroimage.2003.08.031. [DOI] [PubMed] [Google Scholar]
- Negishi M, Abildgaard M, Nixon T, Constable RT. Removal of time-varying gradient artifacts from EEG data acquired during continuous fMRI. Clin Neurophysiol. 2004;115:2181–2192. doi: 10.1016/j.clinph.2004.04.005. [DOI] [PubMed] [Google Scholar]
- Newton MR, Austin MC, Chan JG, McKay WJ, Rowe CC, Berkovic SF. Ictal SPECT using technetium-99m-HMPAO: methods for rapid preparation and optimal deployment of tracer during spontaneous seizures. J Nucl Med. 1993;34:666–670. [PubMed] [Google Scholar]
- Ogawa S, Tank DW, Menon R, Ellermann JM, Kim S-G. Intrinsic signal changes accompanying sensory stimulation: functional brain mapping with magnetic resonance imaging. Proc Nat Acad Sci USA. 1992;89:5951–5955. doi: 10.1073/pnas.89.13.5951. [DOI] [PMC free article] [PubMed] [Google Scholar]
- Raichle ME, MacLeod AM, Snyder AZ, Powers WJ, Gusnard DA, Shulman GL. A default mode of brain function. Proc Natl Acad Sci USA. 2001;98:676–682. doi: 10.1073/pnas.98.2.676. [DOI] [PMC free article] [PubMed] [Google Scholar]
- Salek-Haddadi A, Lemieux L, Merschhemke M, Friston KJ, Duncan JS, Fish DR. Functional magnetic resonance imaging of human absence seizures. Ann Neurol. 2003;53:663–667. doi: 10.1002/ana.10586. [DOI] [PubMed] [Google Scholar]
- Seeck M, Lazeyras F, Michel CM, Blanke O, Gericke CA, Ives J, Delavelle J, Golay X, Haenggeli CA, de Tribolet N, Landis T. Non-invasive epileptic focus localization using EEG-triggered functional MRI and electromagnetic tomography. Electroencephalogr Clin Neurophysiol. 1998;106:508–512. doi: 10.1016/s0013-4694(98)00017-0. [DOI] [PubMed] [Google Scholar]
- Smith AM, Lewis BK, Ruttimann UE, Ye FQ, Sinnwell TM, Yang Y, Duyn JH, Frank JA. Investigation of low frequency drift in fMRI signal. Neuroimage. 1999;9:526–533. doi: 10.1006/nimg.1999.0435. [DOI] [PubMed] [Google Scholar]
- Srivastava G, Crottaz-Herbette S, Lau KM, Glover GH, Menon V. ICA-based procedures for removing ballistocardiogram artifacts from EEG data acquired in the MRI scanner. Neuroimage. 2005;24:50–60. doi: 10.1016/j.neuroimage.2004.09.041. [DOI] [PubMed] [Google Scholar]
- Stefanovic B, Warnking JM, Pike GB. Hemodynamic and metabolic responses to neuronal inhibition. Neuroimage. 2004;22:771–778. doi: 10.1016/j.neuroimage.2004.01.036. [DOI] [PubMed] [Google Scholar]
- Stefanovic B, Warnking JM, Kobayashi E, Bagshaw AP, Hawco C, Dubeau F, Gotman J, Pike B. Hemodynamic and metabolic responses to activation, deactivation and epileptic discharges. Neuroimage. 2005;28(1):205–215. doi: 10.1016/j.neuroimage.2005.05.038. [DOI] [PubMed] [Google Scholar]
- Tenney JR, Duong TQ, King JA, Ludwig R, Ferris CF. Corticothalamic modulation during absence seizures in rats: a functional MRI assessment. Epilepsia. 2003;44:1133–1140. doi: 10.1046/j.1528-1157.2003.61002.x. [DOI] [PMC free article] [PubMed] [Google Scholar]
- Tenney JR, Marshall PC, King JA, Ferris CF. fMRI of generalized absence status epilepticus in conscious marmoset monkeys reveals corticothalamic activation. Epilepsia. 2004;45:1240–1247. doi: 10.1111/j.0013-9580.2004.21504.x. [DOI] [PubMed] [Google Scholar]
- Turner R. How much cortex can a vein drain? Downstream dilution of activation-related cerebral blood oxygenation changes. Neuroimage. 2002;16:1062–1067. doi: 10.1006/nimg.2002.1082. [DOI] [PubMed] [Google Scholar]
- Warach S, Ives JR, Schlaug G, Patel MR, Darby DG, Thangaraj V, Edelman RR, Schomer DL. EEG-triggered echo-planar functional MRI in epilepsy. Neurology. 1996;47:89–93. doi: 10.1212/wnl.47.1.89. [DOI] [PubMed] [Google Scholar]
- Worsley KJ, Friston KJ. Analysis of fMRI time-series revisited-again. Neuroimage. 1995;2:173–181. doi: 10.1006/nimg.1995.1023. [DOI] [PubMed] [Google Scholar]
- Worsley KJ, Marrett S, Neelin P, Vandal AC, Friston KJ, Evans AC. A unified statistical approach for determining significant signals in images of cerebral activation. Hum Brain Mapp. 1996;4:58–73. doi: 10.1002/(SICI)1097-0193(1996)4:1<58::AID-HBM4>3.0.CO;2-O. [DOI] [PubMed] [Google Scholar]
- Worsley KJ, Liao C, Aston J, Petre V, Duncan GH, Morales F, Evans AC. A general statistical analysis for fMRI data. Neuroimage. 2002;15:1–15. doi: 10.1006/nimg.2001.0933. [DOI] [PubMed] [Google Scholar]
- Zijlmans M, Huiskamp G, Hersevoort M, Seppenwoolde JH, van Huffelen AC, Leijten FS. EEG-fMRI in the preoperative work-up for epilepsy surgery. Brain. 2007;130(pt 9):2343–2353. doi: 10.1093/brain/awm141. [DOI] [PubMed] [Google Scholar]