

Summary
Purpose
Combined electroencephalography (EEG) and functional MRI (EEG-fMRI) can be useful in the evaluation of epilepsy patients. The reproducibility of EEG-fMRI findings needs to be established to consider it as a clinically valuable method. We addressed the intrasubject reproducibility of EEG-fMRI and the possible superiority of higher magnetic field strength in patients who were scanned twice.
Methods
Fifteen patients were studied: Seven had one 1.5T and one 3T scan and eight had two 3T EEG-fMRI studies. Equal numbers of events of the same interictal epileptic discharge (IED) were included, and IED-related blood oxygenation level dependent (BOLD) results were compared.
Key Findings
In 1.5T–3T comparisons, five patients had BOLD responses in both studies, but in four there was a better response (higher maximum t-score and larger cluster) in 3T studies. One patient had a BOLD response in the 3T study only. The remaining patient had no BOLD response in either study. In 3T–3T comparisons, results were reproducible in five of eight patients, and one patient had no response in both studies. The two remaining patients had previous extensive surgery and extremely frequent IEDs. Some of the reproduced patterns in other patients, however, differed in terms of maximum t-score and cluster size.
Significance
EEG-fMRI appears to provide reasonable reproducibility, although repeated studies may show differences. The absence of BOLD response seems to be reproducible as well. EEG-fMRI results tend to benefit from higher field scanners (3T over 1.5T). Further studies are needed to determine if reproducibility depends on specific clinical, electrographic, or anatomic findings.
Keywords: EEG-fMRI, Reliability, Localization, Blood oxygenation level dependent, Epilepsy surgery
The development of methods that help to recover electroencephalography (EEG) signal recorded in the harsh environment of the magnetic resonance imaging (MRI) scanner allowed EEG–functional MRI (fMRI) to become a feasible and a potentially useful clinical tool to study epileptic activity (Ives et al., 1993; Benar et al., 2003). EEG-fMRI combines the high temporal resolution of EEG signal with the high spatial resolution of blood oxygen level dependent (BOLD) MRI images. An increasing number of studies describe the interictal epileptic discharge (IED) –related BOLD signal changes and show that these measures are useful to characterize various forms of focal and generalized epilepsy and may help in the presurgical evaluation of patients with refractory focal seizures (Zijlmans et al., 2007; Jacobs et al., 2008b; Tyvaert et al., 2008; Jacobs et al., 2009; Moeller et al., 2009). However, the reproducibility of EEG-fMRI results has scarcely been addressed in the literature (Krakow et al., 1999; Salek-Haddadi et al., 2006) and needs to be established.
A good quality of the images and of the EEG recording, as well as frequently occurring spikes are essential to obtain good EEG-fMRI results (Gotman, 2008; Walker et al., 2010). Results have been reported for a variety of epileptic discharges. For instance, a significant BOLD response has been shown to be present for temporal lobe spikes in 83% of cases (Kobayashi et al., 2006a) and in 93% of idiopathic generalized epilepsy (IGE) discharges (Aghakhani et al., 2004). These results have been consistently found by different research centers (Salek-Haddadi et al., 2006). The BOLD response is usually an activation, which may be followed by a deactivation. Less often, this BOLD response consists only of a deactivation (Kobayashi et al., 2006b). On the other hand, some scans yield no significant BOLD response despite frequent epileptic events (Salek-Haddadi et al., 2006).
In this study, we addressed a fundamental question about the potential use of EEG-fMRI as a clinical tool: How reproducible are the results? We performed a controlled scan–rescan study of epileptic activity in patients with focal or generalized epilepsy, in order to show to what extent EEG-fMRI results, independently from the etiology or pathogenesis, could be reproduced.
Higher magnetic field MR has significantly contributed to better structural imaging (Alvarez-Linera, 2008) and is known to improve the signal-to-noise ratio of fMRI studies (Kruger et al., 2001). However, the yield of this improvement has not been systematically evaluated in the clinical context of epileptic discharges. To address this issue, we also examined the possible advantage of using a higher magnetic field (3T) MRI scanner over the more standard 1.5T in a subgroup of our patients.
Patients and Methods
All patients provided written informed consent for the EEG-fMRI studies. During the scan, all safety measures were performed and the patients were monitored using an MR-compatible camera.
Subjects
Fifteen patients underwent EEG-fMRI scans twice (Table 1). Patients were included in the study if they had at least 10 occurrences of the same IED type during each scan. Seven patients (A1–A7) had first an EEG-fMRI study using a 1.5T and then a second scan in a 3T scanner. The median duration between the two scans was 39 months (range 11–57 months). Patient A7 had two 1.5T (1 month apart) scans and one 3T scan. These seven patients were recruited from our EEG/fMRI database, and observers were aware of the first results when the patient was investigated for the second time.
Table 1.
Summary of findings in 1.5T–3T comparison group
| Patient | Age1/Age2/AO/sex | IED during fMRI | MRI finding(s) | >Congruent BOLD response | BOLD (1.5/3T) | Cluster position match | Max t-score (1.5/3T) | Cluster size |
|---|---|---|---|---|---|---|---|---|
| A1 | 35/37/4/F | F3, C3 | L frontocentral cortical dysplasia | Perilesional | Act./Act. | Fair | 5.5/6.2 | 1.5T < 3T |
| A2 | 29/32/15/F | Irregular sharp and wave, left > right | Normal | Left superior temporal gyrus | Deact./Deact. | Fair | −7.2/−8.4 | 1.5T < 3T |
| A3 | 25/28/13/F | F7, T3, T5 | Bilateral small hippocampi | Left lateral temporal and TPO junction | Act./Act. | Good | 9.9/11.9 | 1.5T < 3T |
| A4 | 29/33/5/M | C3, P3, Cz | L centroparietal cortical dysplasia | Perilesional | Not sig./Act | – | –/6 | 1.5T < 3T |
| A5 | 33/35/9/F | Generalized with left temporal accentuation | Normal | Left middle temporal gyrus | Not sig./Act. | Gooda | –/6.1 | 1.5T < 3T |
| A6 | 46/50/18/M | Diffuse left, max. over T3, F9, T9 | Normal | Left TPO | Act./Act. | Good | 16.5/16.3 | 1.5T = 3T |
| A7 | 51/52/12/F | T4, T6 | L temporal resection, PNH | – | Not sig./Not sig. | – | –, –/– | – |
IED, interictal epileptic discharge; TPO, temporoparietooccipital; PNH, paraventricular nodular heterotropia. Age1, Age2, and AO are age of the patient at first and second scans, and age of epilepsy onset in years, respectively.
Considering the full length of 1.5T study; the adjusted length showed no significant activation.
Eight other patients (B1–B8) were consecutively recruited from the inpatient or outpatient epilepsy services. They were offered to reparticipate in this study before the fMRI results from the first study were revealed, and patient selection was, therefore, independent of the fMRI results. They were included based on the same EEG criteria as for the 1.5T–3T study (at least 10 occurrences of the same IED). The median distance between the two scans in this group was 18 days (range 2 days to 3 years).
Data acquisition
EEG was continuously recorded while the patients were scanned in the MRI machines (Siemens 1.5T Sonata, or 3T Magnetom Trio; Siemens, Erlangen, Germany). EEG was recorded using 25 Ag/AgCl electrodes placed based on 10–20 and 10–10 system, as described elsewhere (Moeller et al., 2009). An MR-compatible amplifier (BrainAmp-MR, Brain Products, Munich, Germany; 5 kHz sampling rate) transmitted data to the software through fiber optic cable.
After a whole-brain T1-weighted global anatomic image (1-mm slice thickness, 256 × 256 matrix and flip angle 30 degrees; for 1.5T: TE = 9.2 ms TR = 22 ms; and for 3T: TE = 7.4 ms, TR = 23 ms;), a series of ~6 min echo planar image runs were acquired (T2*weighted single-shot sequences, 64 × 64 matrix, flip angle 90 degrees; for 1.5T: 25 slices, voxel dimension 5 × 5 × 5 mm, TE = 50 ms, TR = 3 s; and for 3T: either 25 slices, 5 × 5 × 5 mm, TE = 30 ms, TR = 1.7 s, or 33 slices, 3.7 × 3.7 × 3.7 mm, TE = 25 ms, TR = 1.9 s).
EEG preparation
Scanner artifacts were corrected using Brain Vision Analyzer software (Brain Products) with a previously described method (Allen et al., 2000). The ballistocardiogram component of records was removed by visual recognition, or using the assistance of independent component analysis (ICA) (Benar et al., 2003), or by semiautomatic detection of the R waves on the simultaneous ECG, averaging and subtracting the data. We used the generally suggested method to obtain an acceptable quality (de Munck & Ossenblok, 2009; Flanagan et al., 2009). EEGs were then reviewed by an experienced electroencephalographer to mark IEDs. Only events similar to those seen outside the scanner were marked. To compare two sessions with a similar number of IEDs, EEGs from both studies were reviewed, and sets of runs with an approximately equal number of the same type of IED were included in the analysis.
Functional image processing
Dynamic motion correction for functional images, followed by three-dimensional (3D) Gaussian filtering and smoothing (6-mm full width at half maximum) was performed using the software package provided by the Brain Imaging Center of Montreal Neurological Institute (http://www.bic.mni.mcgill.ca/ServicesSoftware). Movement parameters were used as confound regressors in the general linear model analysis. Using the FMRISTAT functions (Worsley et al., 2002) in MATLAB (MathWorks Inc., Natick, MA, U.S.A.), a design matrix for a linear model was created by convolving the IED time markers with four gamma functions peaking at 3, 5, 7, and 9 s after the IED (Bagshaw et al., 2004). Analysis of fMRI data using these regressors in a general linear model was performed (Worsley et al., 2002) and statistical probability maps with a threshold of t-score >3.1 for BOLD activation or t-score <−3.1 for deactivation (p < 0.05 corrected for multiple comparisons) was generated and visually analyzed.
The BOLD responses were compared to their corresponding electrographic events and described as “congruent” if the anatomic region of BOLD response was in agreement with the source suggested by EEG findings. The activation or deactivation clusters or patterns were compared between the two studies and reported as a good, fair, or bad match based on the anatomic position and pattern of the cluster or clusters of interest, including the value of maximum t-score. Similar BOLD responses with a maximum t-score in the same region of the same lobe were considered as a good match; similar BOLD responses with maximum in the same lobe but in a different region were considered a fair match (e.g., inferior temporal vs. superior temporal activation), and all other possible situations of BOLD responses as a bad match (Fig. S1).
Results
Comparison between 1.5T and 3T
Table 1 summarizes the results in this group. One patient (A7) had been operated in the right temporal lobe prior to the first scan (Figs 1, 2, and3, Figs S2–S5).
Figure 1.

Patient A3: Left temporal spike and wave in EEG with referential montage (FCz as reference). BOLD response reproducibility shown in 1.5T and 3T studies.
Epilepsia © ILAE
Figure 2.

Patient A5: The 1.5T study failed to show any BOLD response with 14 events (upper row), whereas the 3T study revealed a BOLD activation over the left superior temporal gyrus and medial frontal area. Reanalyzing the 1.5T study with 107 events (bottom row) showed an activation pattern similar to the 3T study but even more marked.
Epilepsia © ILAE
Figure 3.

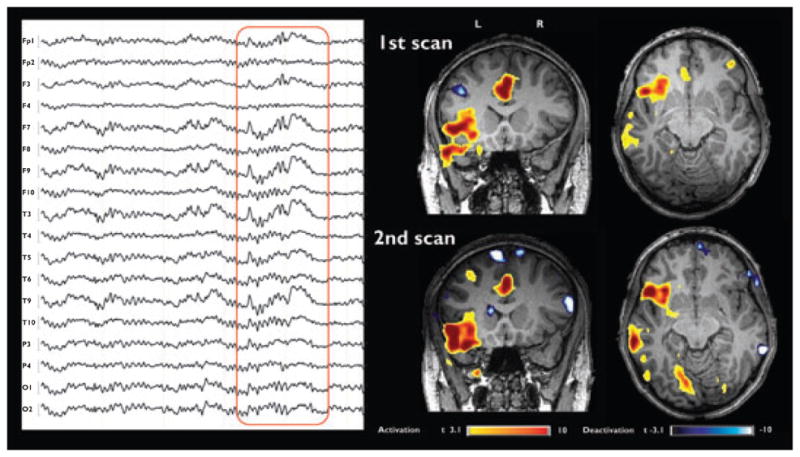
Patient A6: Very similar pattern and distribution of BOLD activation response in axial and coronal slices related to the interictal event shown in a referential montage (FCz as reference).
Epilepsia © ILAE
In Patient A1, both studies showed a congruent perilesional activation pattern, but this activation cluster was larger and with a higher maximum t-score in 3T results. The contralateral (but noncongruent) activation was, however, clearer at 1.5T (Fig. S2).
In Patient A2, the BOLD activation was minimal and inconsistent in the two studies, and the deactivation patterns were marked and matched well, with a higher maximum t-score and larger response over the left temporal lobe in the 3T study. This left side deactivation was considered a congruent response (Fig. S3).
In Patient A3, a congruent activation pattern was reproduced in the left temporal and temporoparietooccipital regions, with higher maximum t-score statistical results in the 3T study. The deactivation pattern was neither congruent with the epileptic discharge nor reproducible (Fig. 1).
In Patient A4, the 1.5T study showed no congruent activation, but the 3T study revealed a clear positive BOLD response over the lesion. No significant deactivation pattern was seen in this patient (Fig. S4).
In Patient A5, using the same number of IEDs in the 1.5 and 3T studies, no response was found at 1.5T but a clear activation was seen at 3T in the left temporal region. However, the 1.5T could detect a similar activation pattern when more IEDs were included. Again, no significant deactivation pattern was seen (Fig. 2).
In Patient A6, the BOLD results of the 1.5T and 3T studies were extremely similar, even though they were four years apart. In addition to the activation localizing a possible left parietal focus, a contralateral noncongruent deactivation was also similar, but more marked at 3T (Fig. 3).
Patient A7 underwent operation before the first scan (anterior right temporal resection, including mesial structures), but still had active interictal spiking in the right temporal electrodes. Neither the two 1.5T scans nor the 3T scan showed a significant BOLD response (Fig. S5).
In summary, five patients (A1, 2, 3, 6, and 5 before IED number adjustment) had similar BOLD activation pattern at 1.5 and 3T. The responses were considered to have fair (in two) or good (in three) matches between the two studies. However, in these five patients the maximum t-scores was higher and in four the cluster size was larger during the 3T studies. One patient (A7) showed no BOLD response during both 1.5 and 3T studies. Finally, one patient (A4) had activation only during the 3T analysis. The BOLD deactivations, whether they were congruent with the focus as in Patient A2 or found at a distance, were more pronounced during the 3T studies.
Comparison between 3T and 3T
Table 2 gives an overview of results in this group, which are shown in Figs 4, 5, 6 and Figs S6–S10. Patients B5 and B6 had been operated previously, and both showed a very active EEG, with virtually no event-free sections in the EEG. In the majority of patients in this group, visual comparison of t-maps from first and second scan had a similar pattern of activation and deactivation. However, the maximum t-score and cluster size was variable to some extent.
Table 2.
Summary of findings in 3T–3T comparison group
| Patient | Age/AO/sex | IED during fMRI | MRI findings | Congruent BOLD response | BOLD (1st/2nd) | Cluster position match | Max t-score (1st/2nd) |
|---|---|---|---|---|---|---|---|
| B1 | 32/9/M | F8, F10, T4, T10 | Right hemimegalencephaly | – | Deact./Deact. | Good | −5/−5 |
| B2 | 19/17/F | L Temporal (max. T3) | Normal | Left temporal lobe | Act./Act. | Good | 6.5/7.5 |
| B3 | 20/16/M | C3, P3 | Normal | Superior postcentral region | Not sig./Not sig. | – | –/– |
| B4 | 34/?/F | Generalized spike and wave | Normal | Thalami DMN |
Act./Act. Deact./Deact. |
Good | 7/10 −11/−13 |
| B5 | 58/10/M | P4 | Extensive right frontotemporal surgical removal | – | Act./Act. | Bad | 4.2/4.3 |
| B6 | 39/25/F | C3, T5, F7 | Left ant. temporal surgical removal, no lesion | Left posttemporal | Act./Act. | Bad | 5.5/5.0 |
| B7 | 26/14/F | T3, T5, T9, P9 | Nodular heterotopia in left posterior quadrant | Perilesional, insuloparietotemporooccipital | Act./Act. | Good | 10/13 |
| B8 | 21–23/12/F | Spike and wave with accentuation over right hemisphere | Normal | Multiple right frontal and insular DMN |
Act./Act. Deact./Deact. |
Good | 24/28 −19/−19 |
IED, interictal epileptic discharge; DMN, default mode network deactivation; LT, left temporal. Age and AO are age of the patient at first and second scans, and age of epilepsy onset in years, respectively.
Figure 4.
Patient B2: Left-sided interictal abnormality and related BOLD response in axial and coronal slices of two 3T scans. The medial frontal and insular activation clusters are similar in both studies.
Epilepsia © ILAE
Figure 5.

Patient B7: Bursts of slow wave are shown with their related BOLD results. Red arrows in the anatomic T1 images point to the periventricular nodular heterotopia. The reproducibility of activation results is good, but the activation cluster size and maximum t-value are bigger in the second scan. EEG is in referential montage with FCz as reference.
Epilepsia © ILAE
Figure 6.

Patient B8 Asymmetric burst of irregular spike and wave, with accentuation in right and anterior electrodes, shown in a bipolar montage. Note the similarities in positive and negative BOLD responses pattern in two scans.
Epilepsia © ILAE
Patient B1 had no BOLD activation despite active and clear EEG discharges in both studies. However, both scans showed a deactivation distribution. Given the anterior and posterior bilateral distribution, this pattern is suggestive of an incomplete default mode network (Raichle et al., 2001; Fig. S6).
In Patient B2, the analysis showed strong and reproducible BOLD activation in multiple clusters in the medial frontal (noncongruent) and temporal (congruent) regions of the left hemisphere. Small deactivation clusters were non-congruent and nonreproducible (Fig. 4).
In Patient B3, the EEG of the first study met the borderline of our selection criteria for a second scan (only 11 interictal events). The first study failed to show any congruent BOLD activation for the interictal discharges. In addition, he had few long electrographic seizures in this study. The second EEG recording yielded 33 events and, before adjusting the length for comparison, showed a well-demarcated BOLD activation congruent with the EEG. Interestingly, cutting the length of the second scan to achieve a similar number of interictal events abolished the BOLD response. The ictal EEG-fMRI result, and later the intracranial EEG recording using a subdural grid, pointed to the area of the interictal BOLD result. No significant deactivation was noted in relation to IEDs in this patient (Fig. S7).
Patient B4 had asymptomatic IGE. She showed activation and deactivation BOLD patterns well known in IGE patients (Aghakhani et al., 2004), in both studies. This consists of a strong bilateral activation in thalami and insular cortices, with a widespread symmetrical deactivation pattern in anterior frontal, parietal, and posterior cingulate cortices (Fig. S8). The structures showing deactivation match the frequently quoted “default mode network” pattern (Raichle et al., 2001). Despite maximum possible adjustment for the number and length of generalized spike and wave discharge, the BOLD response was more pronounced in the second scan.
Patients B5 and B6 had a congruent BOLD activation response in one of the two scans, with a pattern that failed to be reproduced in the other (Fig. S9 and S10, respectively). They both had unsuccessful brain surgeries for removing the epileptogenic tissue.
In Patient B7, interictal events consisted of slow wave seen over the left posterior electrodes occurring in forms of single waves or bursts. The general activation pattern was again reproduced: A strong BOLD activation was found in the perilesional area and in the overlying posterior temporal and temporooccipital cortical regions. The cluster sizes and maximum t-score value were similar for BOLD activation (Fig. 5). Deactivation clusters were noncongruent and non-reproducible.
In Patient B8, the results consisted of a number of activation clusters in the right frontal and frontotemporal areas with a deactivation pattern resembling the posterior part of the default mode network, with some lateralization over the right parietal regions. These results were completely reproduced (Fig. 6).
In summary, activation BOLD responses in four patients (B2, 4, 7, and 8) were considered to have a good match between the two studies and were hence well reproduced. In two other patients (B1 and 3) there was no activation response in both studies. Finally, in the two remaining patients (B5 and 6), the results were not reproduced. Deactivation BOLD responses were reproduced in Patients B1, 4, and 8, approximately representing the default mode network pattern. Other deactivation results in this group were not reproduced. Although some of the scans had unreproduced minor clusters of deactivation, these clusters could be major as well, but never considered congruent.
Discussion
In our results, we demonstrated a relatively good reproducibility of EEG-fMRI of the interictal events in most cases of BOLD activation and many cases with a deactivation response. The first part of this study defends a superiority of 3T over 1.5T EEG-fMRI.
Epilepsy surgery is widely accepted as a treatment option in patients with pharmacoresistant epilepsy. Resective surgery in particular shows a high success rate in terms of seizure freedom (Spencer & Huh, 2008) and quality of life (Spencer et al., 2007). Progress in neuroimaging and nuclear medicine helped to uncover more structural lesions, for example, subtle cortical dysplasias in patients with previously unremarkable scans (Widdess-Walsh et al., 2006; Duncan, 2009). But even finding a lesion does not necessary mean finding the epileptogenic zone that is the surgical target. This is a reason that many patients with or without lesions on MRI are invasively monitored using subdural grids or stereo-EEG (McGonigal et al., 2007). However, there is no noninvasive “gold standard” for presurgical evaluation of these cases (Rosenow & Luders, 2001).
In functional MRI, neuronal activity can be detected indirectly by mapping the signal changes caused by an increased regional blood flow and hemoglobin oxygenation (Kwong et al., 1992; Logothetis et al., 2001). Combined fMRI and EEG recording is a noninvasive method that allows mapping of brain areas involved during IEDs or seizures. By using EEG-fMRI in complex presurgical cases, Zijlmans et al. (2007) showed improvement of source localization or confirmation of a negative decision regarding surgical candidacy. Moeller et al. (2009) reported the added value of EEG-fMRI in the presurgical evaluation of patients with nonlesional frontal lobe epilepsy. The validity of this method to delineate the epileptic focus was supported by concordance with other diagnostic tools as well as postoperative histology.
Yet results of EEG-fMRI in epilepsy may be variable and in a subset of patients fail to show a clear BOLD response (Aghakhani et al., 2004; Kobayashi et al., 2006a). Furthermore, some results are considered noncongruent with the electrographic or clinical picture. It is not clear if this comes from a limitation of the technique, which creates unreliable false activations in some cases. Repeatable but noncongruent BOLD responses could be a result of neuronal connections through synaptic pathways. Examples of these patterns are the medial frontal activity in Patient B2 (Fig. 4) and the contralateral homologous activation seen in temporal lobe spikes (Kobayashi et al., 2006a). It is a strength of EEG-fMRI studies that they are able to reveal such changes. On the other hand, there are also nonrepeatable and noncongruent results, which can be caused by artifacts or by responses that genuinely change from one examination to the next.
Few studies addressed the issue of reproducibility in EEG-fMRI of IEDs. Krakow et al. (1999) reported the reproducibility of EEG-triggered fMRI in 10 patients with partial epilepsy using a 1.5T scanner. Nine patients had a good reproducibility either in showing a congruent BOLD response (six patients) or by showing no significant BOLD in either of the scans (three patients). The authors proposed that lower amplitude or nonstereotyped morphology of IEDs might explain the absence of a BOLD response. Only one patient had a nonreproducible BOLD result in that study. In another study also using 1.5T scanner but with continuous EEG-fMRI recording, Salek-Haddadi et al. (2006) presented five scan–rescan results in patients with focal epilepsy. They concluded that the results are reproducible, including two cases with no significant BOLD result.
In this study, we investigated the reliability of EEG-fMRI results in a controlled study, by analyzing similar types and numbers of IEDs when comparing the two studies. As shown in the 1.5T–3T and 3T–3T comparisons, the results were reproduced in most cases. Even scans that fail to show a significant BOLD response despite an adequate number of IEDs (Patients A7 and B1) reproduce the same results in a repeat scan. However, cases like Patients A5 or B3 remind us that the statistical power due to number of events is always important, and that failure to detect a BOLD signal might be due to small number of events (Salek-Haddadi et al., 2006).
Patients B5 and B6 had undergone operations before. They showed a nonreproducible BOLD response that matched the EEG and clinical data in one of the two 3T scans. They were both extremely active electrographically, and the number of events was around one every 3–5 s. This may affect the statistical power and make it harder to uncover any significant BOLD response. For very frequent IEDs, the general linear model analysis may no longer be valid, since the linearity of the model may not hold if the events are closely spaced in time (Friston et al., 1998; Jacobs et al., 2008a).
We also addressed the potential benefits of using a 3T scanner for EEG-fMRI in the first part of our study. For Patients A4 and A5, with a similar number of interictal events in both scans, relevant BOLD activation was shown in the 3T study only. This suggests a better sensitivity for 3T. Higher magnetic field has been shown to improve the signal-to-noise and contrast-to-noise ratio in functional imaging, which could lead to shorter scan time (Kruger et al., 2001; Briellmann et al., 2003) and better sensitivity by making smaller voxel sizes possible (Gati et al., 1997; Briellmann et al., 2003). However, various types of artifacts in MRI images could be aggravated, namely susceptibility loss and physiologic noise. Despite this, it is suggested that the benefits of a 3T rather than a 1.5T scanner outweigh the disadvantages in BOLD images (Kruger et al., 2001). Importantly, EEG quality and detection of IEDs are not considered worse with 3T. Our EEG artifact removal process was as effective at 3T as it was at 1.5T. In line with previous findings in fMRI, our results for EEG-fMRI study of IEDs revealed better results for 3T scans in terms of maximum t-score and number of significantly activated/deactivated voxels. This was generally the case for BOLD activation, but for Patient A2 this was also evident in the deactivation pattern.
Event-related EEG-fMRI of IEDs is becoming a tool in clinical evaluations. Like any diagnostic technique, controlled studies are needed to assess if and in which patients EEG-fMRI offers reliable and helpful results. Those results in turn could be used to guide invasive evaluations. However, EEG-fMRI results have to be interpreted in the context of the entire clinical and electrographic picture of the patient (Groening et al., 2009; Vulliemoz et al., 2010). This study shows that results are generally reproducible, thus adding confidence in their value, and that a higher MR field shows an advantage in detecting a BOLD response. Fields higher than 3T (up to 8T) are assumed to be safe for clinical studies, and EEG-fMRI under very high field is reported as safe and feasible (Wiesinger et al., 2006; Mullinger et al., 2008). Since the signal-to-noise ratio is directly correlated with the magnetic field strength, one might assume that EEG-fMRI studies performed at fields higher than 3T could further increase the yield of the EEG-fMRI approach.
Supplementary Material
Acknowledgments
The authors wish to thank Natalja Zazubovits for her help with data collection and analysis. This work was supported by grant MOP-38079 of the Canadian Institutes of Health Research.
Footnotes
Disclosure
We confirm that we have read the Journal’s position on issues involved in ethical publication and affirm that this report is consistent with those guidelines. None of the authors has any conflict of interest to disclose.
Please note: Wiley-Blackwell is not responsible for the content or functionality of any supporting information supplied by the authors. Any queries (other than missing material) should be directed to the corresponding author for the article.
References
- Aghakhani Y, Bagshaw AP, Benar CG, Hawco C, Andermann F, Dubeau F, Gotman J. fMRI activation during spike and wave discharges in idiopathic generalized epilepsy. Brain. 2004;127:1127–1144. doi: 10.1093/brain/awh136. [DOI] [PubMed] [Google Scholar]
- Allen PJ, Josephs O, Turner R. A method for removing imaging artifact from continuous EEG recorded during functional MRI. Neuroimage. 2000;12:230–239. doi: 10.1006/nimg.2000.0599. [DOI] [PubMed] [Google Scholar]
- Alvarez-Linera J. 3T MRI: advances in brain imaging. Eur J Radiol. 2008;67:415–426. doi: 10.1016/j.ejrad.2008.02.045. [DOI] [PubMed] [Google Scholar]
- Bagshaw AP, Aghakhani Y, Benar CG, Kobayashi E, Hawco C, Dubeau F, Pike GB, Gotman J. EEG-fMRI of focal epileptic spikes: analysis with multiple haemodynamic functions and comparison with gadolinium-enhanced MR angiograms. Hum Brain Mapp. 2004;22:179–192. doi: 10.1002/hbm.20024. [DOI] [PMC free article] [PubMed] [Google Scholar]
- Benar C, Aghakhani Y, Wang Y, Izenberg A, Al-Asmi A, Dubeau F, Gotman J. Quality of EEG in simultaneous EEG-fMRI for epilepsy. Clin Neurophysiol. 2003;114:569–580. doi: 10.1016/s1388-2457(02)00383-8. [DOI] [PubMed] [Google Scholar]
- Briellmann RS, Pell GS, Wellard RM, Mitchell LA, Abbott DF, Jackson GD. MR imaging of epilepsy: state of the art at 1.5 T and potential of 3 T. Epileptic Disord. 2003;5:3–20. [PubMed] [Google Scholar]
- de Munck JC, Ossenblok PP. Towards clinical standards for EEG/fMRI. Clin Neurophysiol. 2009;120:1617–1618. doi: 10.1016/j.clinph.2009.06.021. [DOI] [PubMed] [Google Scholar]
- Duncan J. The current status of neuroimaging for epilepsy. Curr Opin Neurol. 2009;22:179–184. doi: 10.1097/WCO.0b013e328328f260. [DOI] [PubMed] [Google Scholar]
- Flanagan D, Abbott DF, Jackson GD. How wrong can we be? The effect of inaccurate mark-up of EEG/fMRI studies in epilepsy. Clin Neurophysiol. 2009;120:1637–1647. doi: 10.1016/j.clinph.2009.04.025. [DOI] [PubMed] [Google Scholar]
- Friston KJ, Josephs O, Rees G, Turner R. Nonlinear event-related responses in fMRI. Magn Reson Med. 1998;39:41–52. doi: 10.1002/mrm.1910390109. [DOI] [PubMed] [Google Scholar]
- Gati JS, Menon RS, Ugurbil K, Rutt BK. Experimental determination of the BOLD field strength dependence in vessels and tissue. Magn Reson Med. 1997;38:296–302. doi: 10.1002/mrm.1910380220. [DOI] [PubMed] [Google Scholar]
- Gotman J. Epileptic networks studied with EEG-fMRI. Epilepsia. 2008;49(suppl 3):42–51. doi: 10.1111/j.1528-1167.2008.01509.x. [DOI] [PMC free article] [PubMed] [Google Scholar]
- Groening K, Brodbeck V, Moeller F, Wolff S, van Baalen A, Michel CM, Jansen O, Boor R, Wiegand G, Stephani U, Siniatchkin M. Combination of EEG-fMRI and EEG source analysis improves interpretation of spike-associated activation networks in paediatric pharmacoresistant focal epilepsies. Neuroimage. 2009;46:827–833. doi: 10.1016/j.neuroimage.2009.02.026. [DOI] [PubMed] [Google Scholar]
- Ives JR, Warach S, Schmitt F, Edelman RR, Schomer DL. Monitoring the patient’s EEG during echo planar MRI. Electroencephalogr Clin Neurophysiol. 1993;87:417–420. doi: 10.1016/0013-4694(93)90156-p. [DOI] [PubMed] [Google Scholar]
- Jacobs J, Hawco C, Kobayashi E, Boor R, LeVan P, Stephani U, Siniatchkin M, Gotman J. Variability of the hemodynamic response as a function of age and frequency of epileptic discharge in children with epilepsy. Neuroimage. 2008a;40:601–614. doi: 10.1016/j.neuroimage.2007.11.056. [DOI] [PMC free article] [PubMed] [Google Scholar]
- Jacobs J, Rohr A, Moeller F, Boor R, Kobayashi E, LeVan Meng P, Stephani U, Gotman J, Siniatchkin M. Evaluation of epileptogenic networks in children with tuberous sclerosis complex using EEG-fMRI. Epilepsia. 2008b;49:816–825. doi: 10.1111/j.1528-1167.2007.01486.x. [DOI] [PubMed] [Google Scholar]
- Jacobs J, Levan P, Moeller F, Boor R, Stephani U, Gotman J, Siniatchkin M. Hemodynamic changes preceding the interictal EEG spike in patients with focal epilepsy investigated using simultaneous EEG-fMRI. Neuroimage. 2009;45:1220–1231. doi: 10.1016/j.neuroimage.2009.01.014. [DOI] [PubMed] [Google Scholar]
- Kobayashi E, Bagshaw AP, Benar CG, Aghakhani Y, Andermann F, Dubeau F, Gotman J. Temporal and extratemporal BOLD responses to temporal lobe interictal spikes. Epilepsia. 2006a;47:343–354. doi: 10.1111/j.1528-1167.2006.00427.x. [DOI] [PubMed] [Google Scholar]
- Kobayashi E, Bagshaw AP, Grova C, Dubeau F, Gotman J. Negative BOLD responses to epileptic spikes. Hum Brain Mapp. 2006b;27:488–497. doi: 10.1002/hbm.20193. [DOI] [PMC free article] [PubMed] [Google Scholar]
- Krakow K, Woermann FG, Symms MR, Allen PJ, Lemieux L, Barker GJ, Duncan JS, Fish DR. EEG-triggered functional MRI of interictal epileptiform activity in patients with partial seizures. Brain. 1999;122(Pt 9):1679–1688. doi: 10.1093/brain/122.9.1679. [DOI] [PubMed] [Google Scholar]
- Kruger G, Kastrup A, Glover GH. Neuroimaging at 1.5 T and 3.0 T: comparison of oxygenation-sensitive magnetic resonance imaging. Magn Reson Med. 2001;45:595–604. doi: 10.1002/mrm.1081. [DOI] [PubMed] [Google Scholar]
- Kwong KK, Belliveau JW, Chesler DA, Goldberg IE, Weisskoff RM, Poncelet BP, Kennedy DN, Hoppel BE, Cohen MS, Turner R, Cheng HM, Brady TJ, Rosen BR. Dynamic magnetic resonance imaging of human brain activity during primary sensory stimulation. Proc Natl Acad Sci U S A. 1992;89:5675–5679. doi: 10.1073/pnas.89.12.5675. [DOI] [PMC free article] [PubMed] [Google Scholar]
- Logothetis NK, Pauls J, Augath M, Trinath T, Oeltermann A. Neurophysiological investigation of the basis of the fMRI signal. Nature. 2001;412:150–157. doi: 10.1038/35084005. [DOI] [PubMed] [Google Scholar]
- McGonigal A, Bartolomei F, Regis J, Guye M, Gavaret M, Trebuchon-Da Fonseca A, Dufour H, Figarella-Branger D, Girard N, Peragut JC, Chauvel P. Stereoelectroencephalography in presurgical assessment of MRI-negative epilepsy. Brain. 2007;130:3169–3183. doi: 10.1093/brain/awm218. [DOI] [PubMed] [Google Scholar]
- Moeller F, Tyvaert L, Nguyen DK, Levan P, Bouthillier A, Kobayashi E, Tampieri D, Dubeau F, Gotman J. EEG-fMRI: adding to standard evaluations of patients with nonlesional frontal lobe epilepsy. Neurology. 2009;73:2023–2030. doi: 10.1212/WNL.0b013e3181c55d17. [DOI] [PMC free article] [PubMed] [Google Scholar]
- Mullinger K, Brookes M, Stevenson C, Morgan P, Bowtell R. Exploring the feasibility of simultaneous electroencephalography/functional magnetic resonance imaging at 7 T. Magn Reson Imaging. 2008;26:968–977. doi: 10.1016/j.mri.2008.02.014. [DOI] [PubMed] [Google Scholar]
- Raichle ME, MacLeod AM, Snyder AZ, Powers WJ, Gusnard DA, Shulman GL. A default mode of brain function. Proc Natl Acad Sci U S A. 2001;98:676–682. doi: 10.1073/pnas.98.2.676. [DOI] [PMC free article] [PubMed] [Google Scholar]
- Rosenow F, Luders H. Presurgical evaluation of epilepsy. Brain. 2001;124:1683–1700. doi: 10.1093/brain/124.9.1683. [DOI] [PubMed] [Google Scholar]
- Salek-Haddadi A, Diehl B, Hamandi K, Merschhemke M, Liston A, Friston K, Duncan JS, Fish DR, Lemieux L. Hemodynamic correlates of epileptiform discharges: an EEG-fMRI study of 63 patients with focal epilepsy. Brain Res. 2006;1088:148–166. doi: 10.1016/j.brainres.2006.02.098. [DOI] [PubMed] [Google Scholar]
- Spencer SS, Berg AT, Vickrey BG, Sperling MR, Bazil CW, Haut S, Langfitt JT, Walczak TS, Devinsky O. Health-related quality of life over time since resective epilepsy surgery. Ann Neurol. 2007;62:327–334. doi: 10.1002/ana.21131. [DOI] [PubMed] [Google Scholar]
- Spencer S, Huh L. Outcomes of epilepsy surgery in adults and children. Lancet Neurol. 2008;7:525–537. doi: 10.1016/S1474-4422(08)70109-1. [DOI] [PubMed] [Google Scholar]
- Tyvaert L, Hawco C, Kobayashi E, LeVan P, Dubeau F, Gotman J. Different structures involved during ictal and interictal epileptic activity in malformations of cortical development: an EEG-fMRI study. Brain. 2008;131:2042–2060. doi: 10.1093/brain/awn145. [DOI] [PMC free article] [PubMed] [Google Scholar]
- Vulliemoz S, Lemieux L, Daunizeau J, Michel CM, Duncan JS. The combination of EEG source imaging and EEG-correlated functional MRI to map epileptic networks. Epilepsia. 2010;51:491–505. doi: 10.1111/j.1528-1167.2009.02342.x. [DOI] [PubMed] [Google Scholar]
- Walker MC, Chaudhary UJ, Lemieux L. EEG-fMRI in adults with focal epilepsy. In: Mulert C, Lemieux L, editors. EEG-fMRI. Springer; Heidelberg: 2010. pp. 308–331. [Google Scholar]
- Widdess-Walsh P, Diehl B, Najm I. Neuroimaging of focal cortical dysplasia. J Neuroimaging. 2006;16:185–196. doi: 10.1111/j.1552-6569.2006.00025.x. [DOI] [PubMed] [Google Scholar]
- Wiesinger F, Van de Moortele PF, Adriany G, De Zanche N, Ugurbil K, Pruessmann KP. Potential and feasibility of parallel MRI at high field. NMR Biomed. 2006;19:368–378. doi: 10.1002/nbm.1050. [DOI] [PubMed] [Google Scholar]
- Worsley KJ, Liao CH, Aston J, Petre V, Duncan GH, Morales F, Evans AC. A general statistical analysis for fMRI data. Neuroimage. 2002;15:1–15. doi: 10.1006/nimg.2001.0933. [DOI] [PubMed] [Google Scholar]
- Zijlmans M, Huiskamp G, Hersevoort M, Seppenwoolde JH, van Huffelen AC, Leijten FS. EEG-fMRI in the preoperative work-up for epilepsy surgery. Brain. 2007;130:2343–2353. doi: 10.1093/brain/awm141. [DOI] [PubMed] [Google Scholar]
Associated Data
This section collects any data citations, data availability statements, or supplementary materials included in this article.