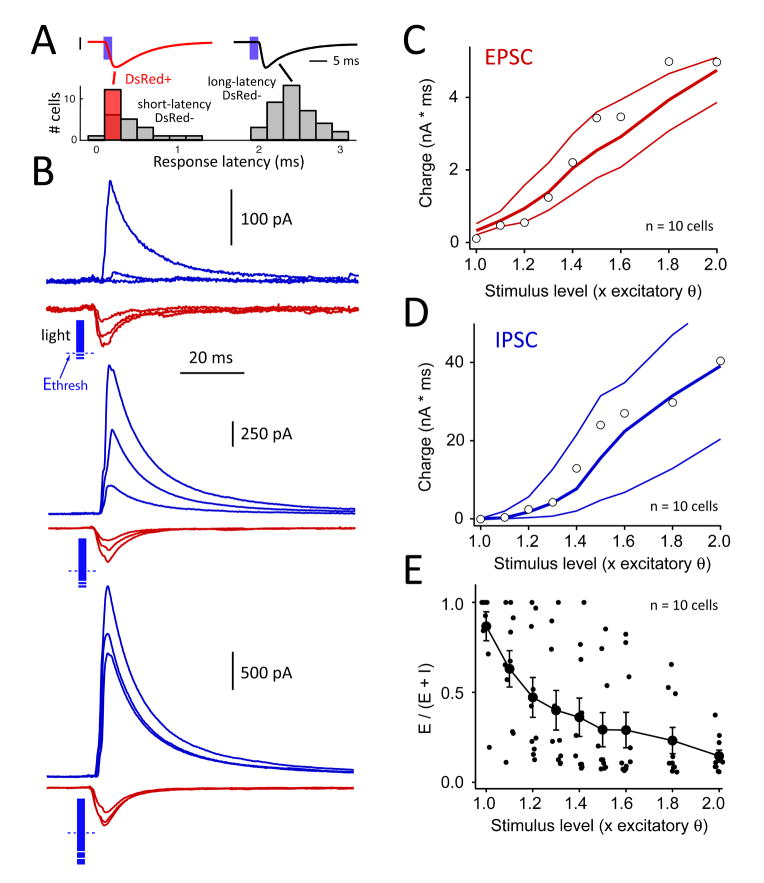
Figure 3. Activation of the recurrent L2/3 network by a 2-ms light pulse.
A, Bimodal distribution of response latency allowed identification of directly light-responsive vs. synaptically responsive cells. Gray bars, DsRed-negative cells under normal recording conditions. Red bar, DsRed+ cells with TTX, kynurenic acid and PTX present in the bath (in addition to the standard APV and saclofen). B, Recruitment of recurrent EPSCs and IPSCs in an example neuron. Each trace is mean of 10–14 sweeps. Top, 1.0, 1.1 and 1.2 x Ethresh. Middle, 1.3, 1.4, 1.5 x Ethresh. Bottom, 1.6, 1.8, 2.0 x Ethresh. Blue bar length indicates photostimulus intensity relative to Ethresh (dashed line). Cell was located in B column. C and D, EPSC and IPSC charge as a function of light intensity, for all cells in B columns (n = 10 cells). Open symbols show cell in (B). Lines are bootstrapped 25th, 50th, and 75th percentiles. E, Fractional excitatory charge for all cells in B columns. See also Figure S2.

