

Abstract
Neuronal activity in the frontal eye field (FEF) ranges from purely motor (related to saccade production) to purely visual (related to stimulus presence). According to numerous studies, visual responses correlate strongly with early perceptual analysis of the visual scene, including the deployment of spatial attention, whereas motor responses do not. Thus, functionally, the consensus is that visually responsive FEF neurons select a target among visible objects, whereas motor-related neurons plan specific eye movements based on such earlier target selection. However, these conclusions are based on behavioral tasks that themselves promote a serial arrangement of perceptual analysis followed by motor planning. So, is the presumed functional hierarchy in FEF an intrinsic property of its circuitry or does it reflect just one possible mode of operation? We investigate this in monkeys performing a rapid-choice task in which, crucially, motor planning always starts ahead of task-critical perceptual analysis, and the two relevant spatial locations are equally informative and equally likely to be target or distracter. We find that the choice is instantiated in FEF as a competition between oculomotor plans, in agreement with model predictions. Notably, although perception strongly influences the motor neurons, it has little if any measurable impact on the visual cells; more generally, the more dominant the visual response, the weaker the perceptual modulation. The results indicate that, contrary to expectations, during rapid saccadic choices perceptual information may directly modulate ongoing saccadic plans, and this process is not contingent on prior selection of the saccadic goal by visually driven FEF responses.
Introduction
The frontal eye field (FEF) is involved both in generating voluntary saccadic eye movements (Bruce and Goldberg, 1985; Bruce et al., 1985; Hanes and Schall, 1996; Schall, 2002) and in two related perceptual processes, (1) the orienting of visuospatial attention (Thompson et al., 2005; Schafer and Moore, 2007, 2011; Monosov et al., 2008, 2010; Monosov and Thompson, 2009; Zhou and Thompson, 2009; Zhou and Desimone, 2011; Gregoriou et al., 2012), and (2) the selection of targets among objects in the visual scene (Thompson et al., 1996; Schall, 2001, 2002). For our purposes, the distinction between attentional deployment and target selection (Juan et al., 2004)—if any—is not important; we are concerned with the broader distinction between the perceptual and motor functions of the FEF.
That they are heavily intertwined is clear. For instance, the neural substrates of visuospatial attention and saccade planning often seem identical: attention is oriented to a given point when an eye movement is planned to that point (Rizzolatti et al., 1987; Moore and Fallah, 2001; Müller et al., 2005; Armstrong et al., 2006; Awh et al., 2006). Also, the preparation of a motor plan may be indistinguishable from a gradual accumulation of sensory evidence for making a discrimination (Gold and Shadlen, 2000).
Other experiments, however, suggest that perceptual and motor functions in FEF are dissociable, and implemented by at least partially non-overlapping neural populations. Both visually responsive and motor-related FEF neurons fire differently depending on whether a target or a distracter is in the response field (RF). For motor neurons, such differential activation culminates in activity that reaches a fixed threshold for generating a saccade to a specific location (Hanes and Schall, 1996; Thompson et al., 1997; Heitz and Schall, 2012; Steinmetz and Moore, 2012). For visually responsive cells, the differentiation is consistent with a strictly perceptual signal: (1) its timing is independent of saccadic reaction time (RT) (Thompson et al., 1996; DiCarlo and Maunsell, 2005), (2) it is affected by target/distracter similarity (Bichot and Schall, 1999; Sato et al., 2001), (3) it is synchronous with attentional modulation in area V4 (Gregoriou et al., 2012), and (4) it occurs even when task rules require a spatially incompatible saccadic report (Murthy et al., 2001, 2009; Sato and Schall, 2003) or no saccade at all (Thompson et al., 2005; Gregoriou et al., 2012).
This means that perceptual analysis (as implemented by activation of visually responsive neurons) is not necessarily accompanied by saccade planning (as implemented by activation of motor-related neurons) (Juan et al., 2004). Furthermore, it suggests that perceptual analysis is accomplished first, before motor planning is initiated (Schall et al., 2011; Purcell et al., 2012)—but is such a sequential arrangement necessary, and is it intrinsic to the FEF circuitry? Intuitively, it would seem that motor planning must follow a target selection process; however, the large majority of experimental tasks used in this context impose, by their design, a strong bias in favor of deploying attention to the target and completing perceptual analysis before committing to a motor choice. Therefore, the question remains unanswered. In neuronal terms, must visually responsive FEF neurons differentiate target from distracter before the motor neurons can select a specific saccadic response?
We investigate this with the compelled-saccade (CS) task, a choice task in which, in contrast to most decision-making paradigms, motor planning always starts ahead of relevant perceptual processing (Stanford et al., 2010; Shankar et al., 2011), thus precluding a serial visuomotor strategy (Salinas et al., 2010). We find that the ongoing activity of motor-related FEF neurons is modulated according to the outcome and timing of the perceptual judgment, in close agreement with model predictions. In contrast, visually responsive neurons show meager evidence of perceptual modulation, which implies that their target/distracter differentiation is not essential for the motor neurons in FEF to execute rapid, perceptually informed saccadic choices.
Materials and Methods
Subjects and setup.
Two adult male rhesus monkeys (Macaca mulatta) served as experimental subjects. All experimental procedures were conducted in accordance with the NIH Guide for the Care and Use of Laboratory Animals, USDA regulations, and the polices set forth by the Institutional Animal Care and Use Committee (IACUC) of Wake Forest School of Medicine. Under general anesthesia, an MRI-compatible post was secured to the skull. The post served to stabilize the head during subsequent behavioral training and recording sessions. Analog signals of eye position were monitored via scleral search coil (Riverbend Electronics) for Monkey S and infrared tracking (EyeLink 1000, SR Research) for Monkey G. Stimulus presentation, reward delivery, and data acquisition were controlled using a purpose designed software/hardware package (Ryklin Software). Yellow, red, and green stimuli were illuminated on a 48 × 42 element array of tri-color light-emitting diodes (LEDs). At a viewing distance of 145 cm, the distance between adjacent LEDs subtended 1° of visual angle. Saccade onset was identified as the time at which eye velocity exceeded 50°/s.
Stereotactic coordinates and MRI images were used to guide surgical placement of a recording cylinder over the left arcuate sulcus of each monkey. Neural activity was recorded using single tungsten microelectrodes (FHC, 2–4 MΩ) driven by hydraulic microdrive (FHC). Neural signals were amplified and filtered and individual neurons were isolated based on amplitude criteria and/or waveform characteristics (FHC; Plexon). Putative FEF neurons were recorded within the boundaries of areas from which saccade-like movements could be evoked by low current microstimulation (70 ms stimulus trains at 350 Hz, with amplitude ≤ 50 μA) (Bruce and Goldberg, 1985; Bruce et al., 1985; Stanford et al., 2010).
Behavioral tasks.
In the CS task (Fig. 1a), each trial begins with the presentation of a central stimulus, and its color, either red or green, identifies the eventual saccade target. While the monkey fixates the central spot, two yellow stimuli, each a potential target, appear at diametrically opposed locations. The Go signal (offset of the fixation spot) instructs the subject to initiate a saccade to a peripheral stimulus, although at the time of the Go, both are still yellow. The identities of the target and distracter are revealed (Cue) during the RT interval after a delay termed “Gap” (50–250 ms). At the Cue, one yellow spot turns red and the other green. Subjects receive a liquid reward for executing a saccade to the stimulus that matches the color of the fixation point (the target) within 600 ms. The RT is measured from the onset of the Go signal until the onset of the saccade (as in the other tasks). The control parameter is the Gap, which specifies the length of time that the sensory information is withheld. The raw processing time, or rPT, is the maximum cue viewing time; it is the interval between Cue onset and saccade onset: rPT = RT − Gap, where all values are trial-specific.
Figure 1.
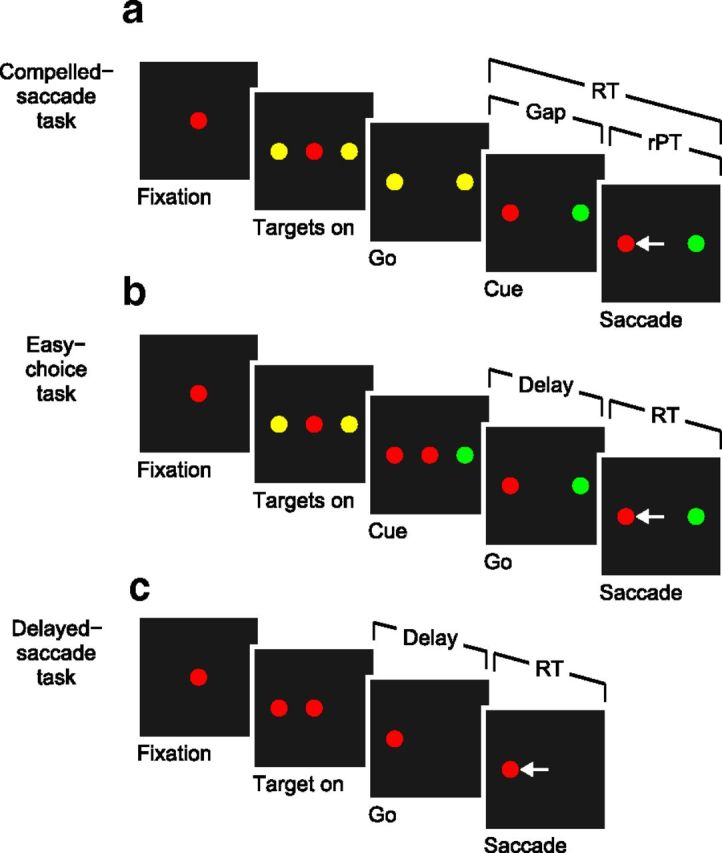
Three tasks used. a, The CS task. The subject is required to make a saccade when the fixation point disappears (Go signal). If the chosen target matches the color of the fixation point (red, in this example), the choice is correct and a reward is obtained. The Go instruction is given first, before the relevant sensory information is revealed (Cue). The Gap (50–250 ms) is the time interval between the Go and the Cue. The rPT is the amount of time during which the color information can potentially inform the saccadic choice. b, The easy-choice task. Events are as in the CS task, except that the Cue is revealed before the Go signal. c, The delayed-saccade task. A single target appears (Target on) and the subject is required to make a saccade to it after a delay, when the fixation point disappears (Go). In all tasks, RT is measured from the Go signal to saccade onset.
In the easy-choice task (Fig. 1b), the events, perceptual discrimination (red vs green) and saccadic choice rule (target matches fixation spot color) are identical to those for the CS task, except that the Cue is revealed before the Go signal, allowing the subject ample time to discriminate target and distracter before initiating a motor response. The key experimental parameter is the delay between the Cue and the Go (50–250 ms), which specifies the amount of time available to process the Cue information. The total cue viewing time in this case is rPT = RT + delay.
In the delayed-saccade task (Fig. 1c), each trial begins with fixation of a central red spot, and a single red target appears at a peripheral location during fixation. After a variable delay (500–1000 ms) following target onset, the fixation spot is extinguished (Go signal) and the subject receives a liquid reward if a saccade to the peripheral target is made.
During recording sessions, the delayed-saccade task was first used to locate the RF of the recorded neuron. For the purpose of online RF mapping, peripheral targets could appear at any one of 16 directions and 4 eccentricities (6°, 10°, 15°, 20°). Once this spatial characterization was completed, the three trial types were randomly interleaved. For the two choice tasks, one stimulus always appeared within the RF and the other at the diametrically opposed location. Target/distracter locations and colors were randomly assigned across trials.
All data analyses were performed in Matlab (The MathWorks). Behavioral curves were constructed as described in previous reports (Salinas et al., 2010; Stanford et al., 2010; Shankar et al., 2011).
Neuron classification.
Neurons were classified as visual (V), visuomotor (VM), or motor (M) by evaluating activity during the CS task within time windows keyed to stimulus onset (Fig. 1a, Targets on) and saccade onset. A neuron was considered to be visually responsive if its firing rate in a poststimulus window (20–150 ms with zero at stimulus onset) significantly exceeded its firing rate in a prestimulus window (−300–0 ms with zero at stimulus onset). Significance (p < 0.01) was assessed via permutation test (Siegel and Castellan, 1988) (20,000 permutations). A neuron was considered to have motor-related activity if the firing rate in a presaccadic window significantly exceeded that in a preplanning window (−50–50 ms with zero at the Go). Because presaccadic increases in activity ranged from gradual to steep, each neuron was evaluated with two presaccadic windows (either −110 to −10 ms, or −60 to −10 ms with zero at saccade onset), and was considered to have motor-related activity if the test was significant in either of them. Accordingly, neurons were classified as V, M, or VM based on whether activity exceeded baseline significantly in the visual, motor, or both visual and motor epochs.
Based on responses evoked during performance of the CS task, 96 of 119 recorded neurons (74 for monkey S and 45 for monkey G) were activated during either the visual, presaccadic, or both visual and presaccadic epochs. Of these, 87 neurons were classified as M (n = 33), VM(n = 36), or V (n = 18) based on stated statistical criteria and 9 failed to meet one or more inclusion criteria (see below). Of the 87 classified neurons, 83 were also tested with the single-target delayed-saccade task for verification of response properties.
Normalization of neural activity.
Continuous firing rate traces were computed by convolving evoked spike trains with a Gaussian function (σ = 10 ms) and averaging across trials. From such traces, peak firing rates during a sensory epoch (0–250 ms with zero at stimulus onset) and a motor epoch (−300–300 ms with zero at saccade onset) were determined, and responses were normalized to the larger of the two values. For each neuron, this same factor was applied to the responses obtained in the three behavioral tasks. All population averages are based on normalized firing rate.
Evaluation of presaccadic spatial selectivity.
For neurons determined to have significant presaccadic activation (see above, Neuron classification), the firing rate for movements into the RF was compared with that for movements to the diametrically opposed location. The same two presaccadic windows described above were tested, and both correct and incorrect CS trials for all rPTs were included for this comparison. A permutation test (Siegel and Castellan, 1988) (20,000 permutations, p < 0.01) was used to establish significance. These trial inclusion criteria were designed specifically to identify neurons with spatially selective presaccadic activity, and thus putatively related to response selection. Beyond the main criteria, neurons were excluded if maximum firing rate was ≤10 spikes/s, or, in rare cases, when the RF location appeared to be inconsistent across the different task types.
Time of the neural discrimination.
The time at which neurons differentiated saccades into versus saccades away from the RF (or target vs distracter) was calculated as follows. Trials were sorted into two conditions, correct saccades into the RF versus correct saccades away from the RF. For each neuron, spike counts for each condition were computed over a time window of 50 ms sliding in steps of 1 ms, and the separation between in and out responses at each time point was quantified according to a receiver operating characteristic (ROC) index (Wyder et al., 2004). This index goes from −1 to 1, with 0 indicating no separation between conditions. A mean separation index as a function of time was then obtained by averaging across the population of neurons under consideration. To determine whether this mean value was significantly different from 0, a sign-rank test (Siegel and Castellan, 1988) was applied to the set of individual ROC indices from all the neurons. The time of neural discrimination, Tsep, was defined as the time point at which the sign-rank test indicated p < 0.01; at that point, the observed inward and outward responses were considered statistically different. The SE of Tsep was calculated using a jackknife procedure (Efron, 1982), in which Tsep was recomputed multiple times, each time omitting data from one neuron. Results were obtained for specific rPT intervals (short, long), with data synchronized on different events (Targets on, Go, Cue, and saccade onset). This method was applied to CS and easy-choice trials.
Quantifying acceleration/deceleration of neural activity.
According to the model, perceptual information acts by accelerating, positively or negatively (deceleration), the oculomotor activity as it rises to threshold, thus producing inflections in the firing rate profiles (see Fig. 3d–h). To quantify such inflections, we measured the convexity of the recorded firing rate traces. The convexity between two points on a curve is equal to the average difference between the straight line that joins the two points and the actual curve values. Trajectories that decelerate are above the line, have negative convexity and curve downward, whereas trajectories that accelerate are below the line, have positive convexity and curve upward.
Figure 3.

Psychophysical and model performance on the CS task. a, Percentage of correct responses as a function of Gap, or psychometric curve. b, Mean RT (±1 SD) as a function of Gap, or chronometric curve. c, Percentage of correct responses as a function of rPT (equal to RT − Gap), or tachometric curve. In a–c, experimental data (blue lines and data points) correspond to behavior during the recording sessions of 119 FEF neurons from monkey S (74 cells, 18,293 trials) and monkey G (45 cells, 7953 trials). Model results (black lines and data points) are from computer simulations of the accelerated race-to-threshold model. d–h, Five simulated trials. The two competing variables xR (red) and xL (green) represent oculomotor activity that triggers an eye movement either to the right or to the left, respectively. In these examples the target is on the right, so races in which xR wins produce correct choices. The two variables start racing 75 ms (afferent delay) after the Go signal and a saccade is triggered 15 ms (efferent delay) after threshold is crossed. Initial build-up rates are drawn randomly in each trial. Gray shades indicate the time during which the Cue information is available to modulate the motor activity. d, e, Two trials (guesses) with Gap = 250 ms and negative rPTs. f–h, Three trials (informed choices) with Gap = 100 ms and positive rPTs.
The definition of convexity applied here was the same as in a previous report (Stanford et al., 2010), but the data were processed slightly differently. Here, instead of measuring convexity on the standard firing rate traces as functions of time, such traces were first temporally normalized according to the RT in each trial. That is, the time axis in each trial was stretched or shrunk so that all trials had the same RT (set to 300 ms). After this step, the averaging across trials and neurons proceeded as usual. With this transformation, the rise to threshold always starts with the Go signal at 0 and ends with saccade onset at 300 ms (see Fig. 9, right). This eliminates variance due simply to differences in overall build-up rate across trials, and results in slightly more pronounced and more significant convexity curves.
Figure 9.
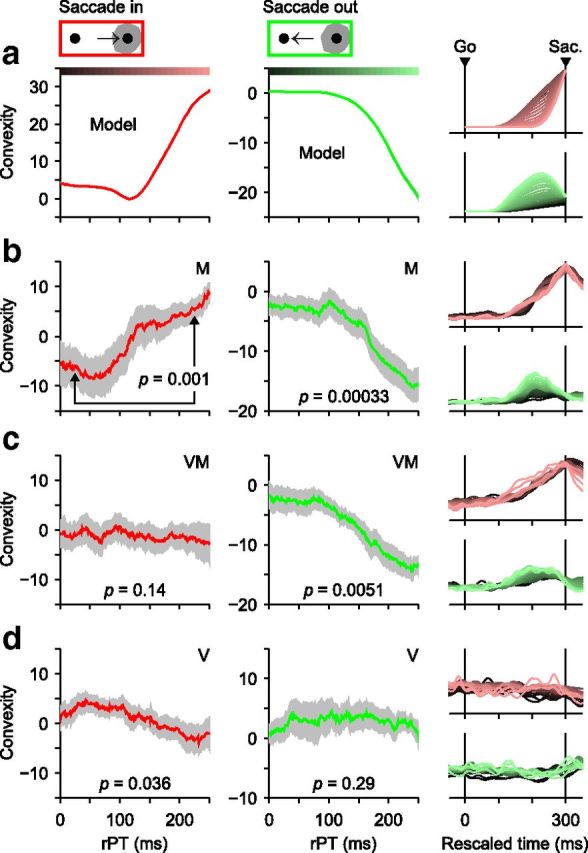
Perceptual modulation, quantified by convexity, varies across neuronal types. a, Convexity as a function of rPT as predicted by the accelerated race-to-threshold model. Simulated trials were aligned on saccade onset, temporally rescaled (i.e., RT-equalized), and grouped according to rPT (bin width = 80 ms). Separate firing rate traces, averaged across trials, were generated for responses into the RF (right column, top) and away from the RF (right column, bottom). The convexity of those traces was then calculated and plotted as a function of rPT for inward (red curve, left column) and outward responses (green curve, middle column). Color bars indicate rPT bins for example traces on the rightmost column. Positive, negative, and zero convexities correspond to trajectories that curve upward, downward, or are straight, respectively. b, As in a, but for 26 spatially selective M neurons. Gray shades indicate SEs obtained by bootstrapping. Significance values shown (p, from permutation test) are for the difference in convexity across the two rPT bins indicated (rPT = 25 and 225 ms). c, As in b, but for 19 spatially selective VM neurons. d, As in b, but for 18 V neurons.
Curves of convexity as a function of rPT (see Fig. 9, left, middle) were constructed by (1) selecting an rPT interval, (2) generating a population-averaged, temporally rescaled firing rate trace for trials within the specified rPT interval, (3) computing its convexity between two chosen time points, and (4) repeating the procedure for all other rPT intervals. For activity into the RF, the chosen time points were 120 and 0 ms (rescaled) before saccade onset, whereas for activity away from the RF the time points were 200 and 0 ms (rescaled) before saccade. These points were chosen to maximize the range of resulting convexity values. Convexity was calculated in the same way for simulated and recorded data.
The statistical significance of the convexity curves obtained experimentally was evaluated in three ways. First, error bars (see Fig. 9, gray shades) were generated through bootstrapping (Efron, 1982; Davison and Hinkley, 2006); that is, by resampling with replacement across cells multiple times. Second, a paired permutation test (Siegel and Castellan, 1988) was designed to compare the convexities at two rPT bins (80 ms bin width) near the edges of the range (rPT = 25 and 225 ms, shown in Fig. 7b, left) using the contributions of individual neurons. And third, to quantify an increasing or decreasing trend in a convexity curve, the correlation between convexity and rPT was computed, and its null distribution was generated (Efron, 1982; Davison and Hinkley, 2006) by randomizing the rPT labels of all trials and all cells 20,000 times, each time recomputing the curve and the correlation. The fraction of times that the randomized correlation was larger than or equal to the original correlation obtained from the unshuffled data was taken as the p value. Results are quoted for method 2, but method 3 produced similar numbers.
Figure 7.

Expected motor activity in the absence of perceptual modulation. a, Mean RT as a function of delay in the easy-choice task. Data are combined from all recording sessions for each monkey (4870 and 3684 trials for monkeys S and G, respectively), grouped into the same three delay bins used in Figure 6b–d. Error bars show ±1 SEM. b, Mean model responses in the preferred (red traces) and antipreferred (green traces) directions in the absence of perceptual modulation. The model was simulated with the same parameters as in Figure 4, except that the Cue was never presented. Trials were then sorted according to RT into three equally populated groups.
Quantifying the choice bias.
To quantify the choice bias, spikes were counted in a preplanning time window (−250–20 ms with zero at the Go), with responses into and away from the RF analyzed separately. First, for each cell, the spike count in the window was converted to a z score based on all rPTs. Second, the mean z score was computed for specific rPT bins. And finally, the results were combined across cells and plotted as a function of rPT (see Fig. 10, left, middle).
Figure 10.
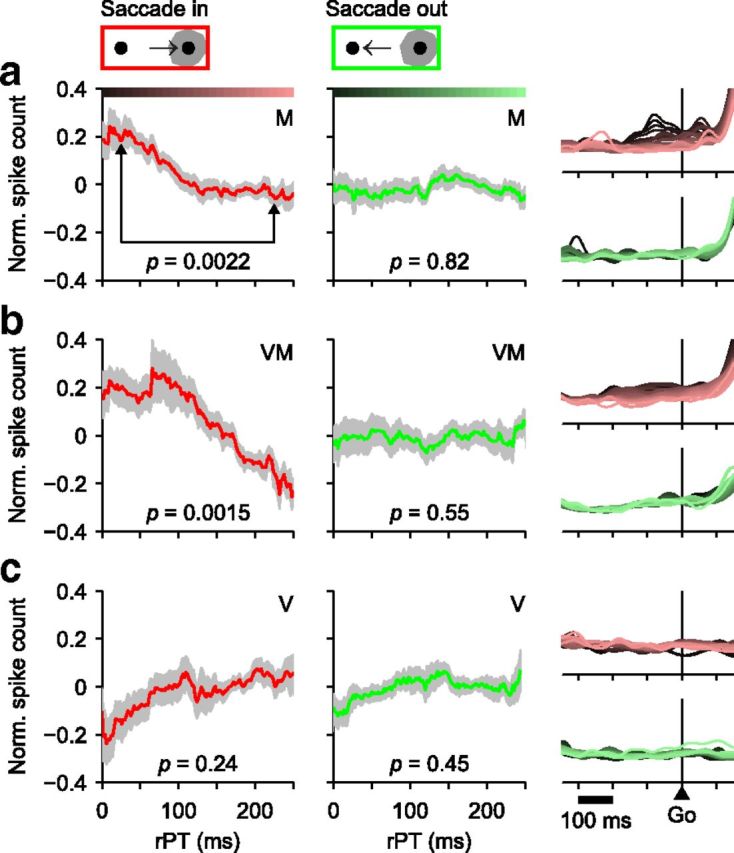
The neural correlate of choice bias varies across neuronal types. a, Normalized activity before the Go as a function of rPT for 26 spatially selective M neurons. Responses for each neuron were aligned on the Go. Spike counts in the analysis window (250 ms before to 20 ms after the Go) were calculated for all trials, turned into z scores, grouped according to rPT (bin width = 80 ms), and averaged across neurons. Data were analyzed separately for trials into (red, left column) and away (green, middle column) from the RF. Gray shades indicate ±1 SE across neurons. Significance values shown (p, from permutation test) are for the difference in activity across the two rPT bins indicated (rPT = 25 and 225 ms). Color bars indicate rPT bins for the firing rate traces shown on the rightmost column, for which the mean firing rate of each neuron in the analysis window was normalized to 1. b, As in a, but for 19 spatially selective VM neurons. c, As in a, but for 18 V neurons.
The statistical significance of the resulting bias curves was evaluated as done with the convexity curves (methods 1 and 2). That is, error bars (see Fig. 10, gray shades) were generated through bootstrapping, and a permutation test was designed to compare, in each curve, the values obtained near the edges of the rPT range (rPT = 25 vs 225 ms).
Model simulations.
The race-to-threshold model was implemented and fitted to the current datasets exactly as detailed earlier (Shankar et al., 2011), except for one minor modification: in each trial, after threshold was exceeded, the two motor plans decreased exponentially toward baseline with a fixed time constant of 90 ms (Ratcliff et al., 2007). This postsaccadic tail had no impact whatsoever on the simulated outcomes or RTs; it simply produced more realistic average traces aligned on the Go or Cue.
Predicted neural activity was generated by averaging over multiple simulated trials after fitting the model to the behavioral data of monkey S. Neural predictions did not involve any additional parameter adjustments. The race model has 11 parameters that may vary to fit a given psychophysical dataset. For completeness—and to show how heavily constrained each one of these parameters is—we briefly outline their roles here, but all details are as explained in the study by Shankar et al. (2011). At the beginning of each trial, the two competing motor plans start building up after an afferent delay following the Go signal; two parameters determine the mean (TND) and SD (σA) of this delay across trials. The initial build-up rates of the two motor plans also vary randomly across trials, and are drawn from a bivariate Gaussian distribution with a given mean (rG), SD (σG), and correlation coefficient (ρG). Once the Gap period elapses, the color information identifying target and distracter arrives after an afferent delay following the presentation of the Cue; this delay is drawn from the same distribution as the delay associated with the Go signal. Once the Cue information becomes available to the model circuit, two things happen. First, both motor plans are briefly interrupted, i.e., they momentarily stop increasing; two parameters specify when such interruption starts (I1) and ends (I2). Second, once the interruption is over, the motor plan congruent with the target location accelerates and the one congruent with the distracter location decelerates; two parameters determine how strong the acceleration (rT) and the deceleration (rD) are, and another one (τ) determines how long they last. Finally, to account for incorrect choices that are not due to limited Cue viewing times, in each trial there is a small probability (pe) that the Cue will simply be missed or ignored; this lapse rate is the eleventh parameter.
Simulating ideal V neurons.
If we knew for a fact that, in a task lacking any time pressure, a population of V neurons differentiated target from distracter to a given degree, what would their responses be in the context of the CS task? To answer this, we simulated the activity of a population of ideal V neurons. We assumed that the firing rate of an ideal V cell would be relatively high once the two choice targets had been presented, that the neuron would start differentiating 110 ms after Cue onset, and that the differentiation would be nearly complete within 10–30 ms (exponential rise/decay with 16 ms time constant), following the findings of Thompson et al. (1996). We also assumed that the firing rate would decay to baseline after the saccade (90 ms time constant) and that the maximum and minimum firing rates attained before saccade onset, which represent target- and distracter-related responses, would correspond to changes of ±50% with respect to the pre-Cue firing rate (see Fig. 11a, arrows); this amount of differentiation is well within the range of modulations reported using highly discriminable stimuli (Thompson et al., 1996, 1997; Sato et al., 2001; Sato and Schall, 2003; Murthy et al., 2009), but is not critical (see Results). Results were similar when the onset of the differentiation changed by ±20 ms, and when the time constants varied by ±50%.
Figure 11.
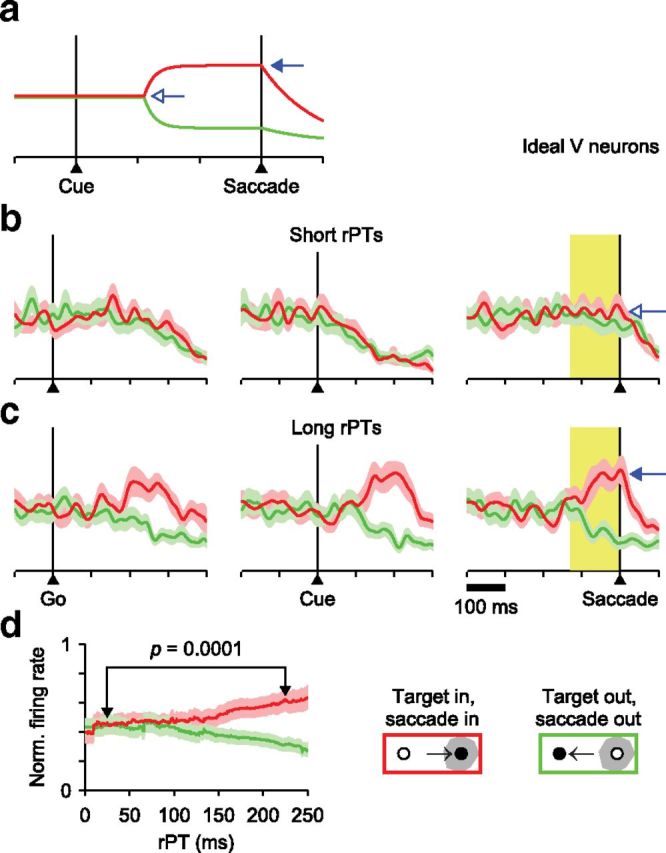
Expected V-neuron differentiation in the CS task. a, Firing rate as a function of time for an ideal model V neuron. The response starts differentiating target from distracter 110 ms after Cue onset, with activity increasing (filled arrow) or decreasing by 50% relative to the initial level (open arrow). b, Aggregate responses of 18 ideal V neurons simulated in the CS task and aligned on the Go signal (left), Cue (middle), or saccade onset (right) in short-rPT trials. Red and green traces are for target and distracter in the RF, respectively. c, As in b, but for long-rPT trials. Short-rPT and long-rPT ranges are as in Figure 4e. On average across simulations, the firing rate levels attained at saccade onset (arrows) correspond directly to the predifferentiation and postdifferentiation levels shown in a (arrows). d, Mean responses as functions of rPT from the same simulations in b and c. Firing rates were computed in a 130 ms time window preceding saccade onset (yellow shades in a and b) for all trials within each rPT bin (bin width = 80 ms). The shown p value is for the target-related response compared across the two rPT bins indicated (rPT = 25 and 225 ms, permutation test).
In any given trial of the CS task, the mean firing rate of this ideal V neuron as a function of time was produced by assuming that it always followed the same temporal course relative to Cue onset, and that if the Cue was revealed after saccade onset the response would simply decay to baseline without having differentiated. Poisson spike trains were then generated by converting the resulting firing rate trace into a firing probability, and via a random-number generator, producing a 0 (no spike) or a 1 (yes spike) in each 1 ms time step. Finally, to generate a simulated population response that was directly comparable to that of our 18 recorded V neurons, the simulation was repeated 18 times, each time using the RTs and rPTs from a corresponding recording session and using the pre-Cue firing rate of the recorded neuron to scale the ideal V response (i.e., the traces in Fig. 11a). The resulting 18 sets of simulated spike trains were then combined and analyzed exactly as done with the actual data.
Results
Neuronal classification in FEF
Monkeys performed three tasks during recording of the 119 FEF neurons included in this report (see Materials and Methods). The CS or compelled-saccade task (Salinas et al., 2010; Stanford et al., 2010; Shankar et al., 2011) required saccadic choices to be made on the basis of rapid perceptual judgments (Fig. 1a); the easy-choice task required identical perceptual discriminations but choices were made in the absence of any time pressure (Fig. 1b); and the traditional delayed-saccade task required movements to a lone peripheral target (Fig. 1c).
Neurons recorded in the CS task were classified as motor, visuomotor, and visual, or M, VM and V, according to established criteria (Bruce and Goldberg, 1985) (see Materials and Methods), and the delayed-saccade task allowed us to verify the consistency of this classification. Responses were aligned either on stimulus onset (Fig. 2, left) or saccade onset (Fig. 2, right), and were averaged separately for stimuli/saccades within the RF (magenta traces) or outside the RF (blue traces). FEF neurons were characterized by strong, transient firing bursts temporally linked to the saccade alone (Fig. 2a), the visual stimulus alone (Fig. 2c), or both (Fig. 2b), which is the basis of the traditional classification scheme.
Figure 2.
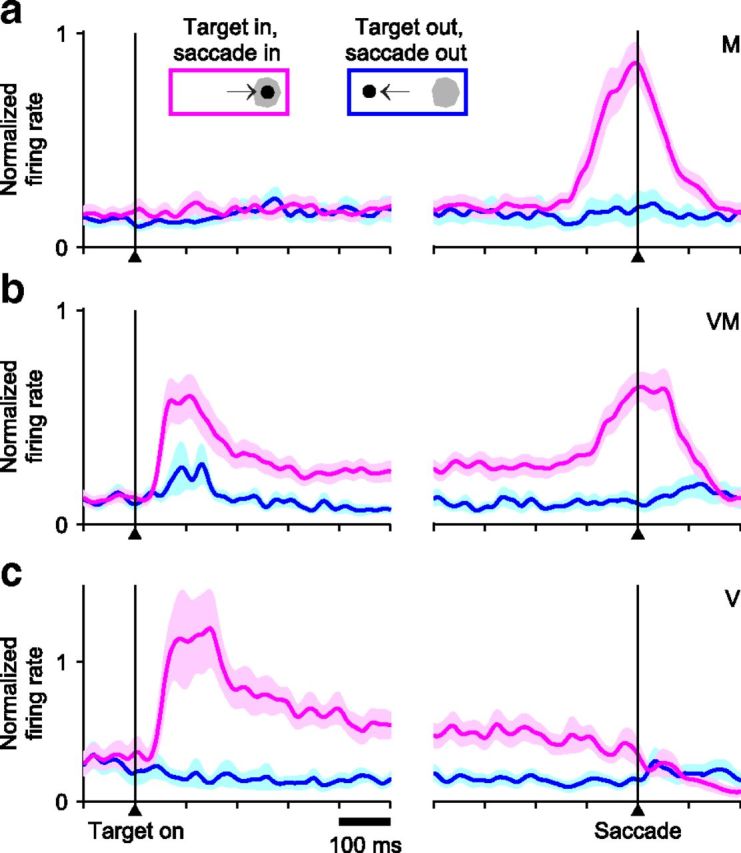
Basic response types in FEF. Neural activity was recorded while monkeys performed a single-target delayed-saccade task. Traces show mean firing rate as a function of time for correct responses into (magenta) or away from (blue) the RF, with spike trains aligned either on target onset (left) or saccade onset (right). Shaded areas indicate ±1 SE across neurons. Neurons were classified as M, VM, or V. a, Average activity of 31 M neurons. b, Average activity of 35 VM neurons. c, Average activity of 17 V neurons.
As explained in the Introduction, visual and motor activations in FEF likely contribute to the distinct functions of target selection and saccadic planning, respectively, even when present on the same neurons. In an earlier study using the CS task (Stanford et al., 2010), we found that, under time pressure, a developing perceptual judgment modulates the ongoing activities of M, or “purely motor” FEF neurons, but because during this task a color-based discrimination is a prerequisite to differentiating target from distracter, a principal objective of the current study was to examine the impact of perceptual information on the activities of visually responsive (V and VM) FEF neurons. We first establish a mechanistic intuition for how oculomotor planning relates to psychophysical performance in the CS task and then analyze and compare the participation of the different neuronal categories in it.
Psychophysical performance during urgent decision making
The sequence of events in the CS task (see Materials and Methods) is schematized in Figure 1a. In all trials, saccade planning is initiated by the Go signal and is modified by perceptual information (Cue) that is delivered later; the probability of success varies according to when that information arrives. Thus, by design, the perceptual-evaluation and motor-planning stages of the choice process are temporally decoupled.
The main experimental parameter is the Gap interval, which controls the difficulty of the task. Because Gap values are randomly interleaved across trials, the timing of the Cue is unpredictable and the subject's performance consists of a mixture of guesses and informed choices. Indeed, the psychometric curves for both monkeys (Fig. 3a) show that performance varied from ∼95% correct at a Gap of 50 ms to <60% correct at a Gap of 250 ms. In contrast, the mean RT remained relatively constant over the same Gap range (Fig. 3b), indicating that the monkeys did not try to wait for the Cue as the Gap increased (Salinas et al., 2010). This shows that large changes in accuracy are dissociable from any systematic change in RT.
Although the Gap is important, ultimately however, the probability of success in each trial depends fundamentally on the rPT, which is the maximum time available to view the Cue before committing to a motor choice (Fig. 1a; see Materials and Methods). In each trial, the maximum viewing time is simply the difference between the recorded RT and the applied gap, so rPT = RT − Gap. The function relating the probability of success to rPT is the tachometric curve (Fig. 3c); it characterizes the perceptual performance of a subject and is the crucial behavioral metric in the CS task (Stanford et al., 2010). This curve reveals that, based on a 75% correct benchmark, perceptual information has a significant impact ∼150 ms after Cue onset (rPT ≈ 150 ms). Thus, trials with rPT ≤ 100 ms or so (near chance performance) correspond to uninformed choices, or guesses, whereas trials with rPT ≥ 200 ms or so (near 100% correct) correspond to fully informed choices. The tachometric curve saturates very near 100% correct, so the color information is fully exploited by the subjects when they have enough time to view the Cue. Also, the perceptual judgment unfolds extremely rapidly: half of the performance range (from 62.5% to 87.5% correct) is covered within 29 ± 2 ms and 33 ± 2 ms for monkeys S and G, respectively. These temporal features are important for evaluating the time course of neural discrimination later on.
A mechanistic framework for describing urgent decisions
Performance on the CS task is well characterized by the “accelerated race-to-threshold” model (Salinas et al., 2010; Stanford et al., 2010; Shankar et al., 2011), and this heuristic model fits the current behavioral datasets too (Fig. 3a–c, black traces; see Materials and Methods). In it, a saccadic choice is conceived as the outcome of a competition between two simultaneously developing oculomotor plans, each racing to a threshold for triggering a movement to one of the two potential target locations. The model hinges on two crucial assumptions. (1) That the Cue information accelerates the ongoing plan that is congruent with its perceptual content (target) and decelerates the plan that is not (distracter). And (2), that in each trial, shortly after the Go signal, the competing motor plans begin rising toward threshold with initial build-up rates drawn randomly from a distribution. So, in this framework the outcome of any given trial depends not only on when the Cue is provided (Gap), but also on how advanced each of the developing oculomotor plans is at that time. In essence, this interaction can take just five distinct forms (Fig. 3d–h).
In this illustration (Fig. 3d–h), correct choices correspond to races in which the red activity trace wins. In trials in which a saccade is triggered before the arrival of the Cue information (Fig. 3d,e), the build-up rates randomly favor one of the potential targets, reflecting the subject's initial guess. These are uninformed choices, and their probability of occurrence increases both with longer Gap durations and—notably—with higher initial build-up rates. In contrast, informed choices are those in which the Cue information arrives early enough to influence the ongoing motor plans (Fig. 3f–h); however, the outcome and dynamics again depend on the initial build-up rates. If the leading motor plan is congruent with the target, it curves upward slightly and quickly triggers a correct saccade (Fig. 3f). Alternatively, if the leading plan is congruent with the distracter, a correct choice takes considerably longer to trigger because the lagging process starts slowly and far from threshold when it begins to accelerate (Fig. 3g). Success on such trials also requires that the leading plan be decelerated, but if the erroneous motor plan is sufficiently advanced, the Cue information cannot prevent it from reaching threshold and an incorrect choice is produced (Fig. 3h).
Thus, the mechanistic signature of the model is this: uninformed choices (short or negative rPTs) are associated with intense motor activity that commits strongly to a potential target shortly after the Go signal, whereas informed choices (long rPTs) are associated with activity that is more moderate and less biased initially, and is disambiguated in favor of the correct response by the later arriving sensory information. This essential distinction leads to key predictions.
Predicted versus recorded motor-related activity
Having fitted the model to the behavioral data (see Materials and Methods), expected neural responses (Fig. 4b–d) were generated by dividing the simulated CS trials into separate rPT ranges (short, intermediate, and long) based on the tachometric curve (Fig. 4a) and averaging across trials within each range. The resulting mean activity traces for correct choices in the preferred (red) or antipreferred (green) directions produced two specific predictions.
Figure 4.

Comparison between model and FEF motor-related responses. The accelerated race-to-threshold model was simulated with parameters that fitted the behavioral data of Money S, as in Figure 3. a, Tachometric curve obtained from simulated responses. Simulated trials were sorted according to rPT into the three groups indicated: short (left gray shade; guesses), intermediate (middle white region), and long (right gray shade; fully informed choices). b–d, Average model responses for short- (b), intermediate- (c), and long- (d) rPT trials aligned either on the Go signal (left column), the Cue (middle column), or saccade onset (right column). All data are from correct responses. Separate averages were calculated for choices in the preferred (red traces) and antipreferred (green traces) direction of the model neurons. e–h, As in a–d, but for 45 FEF neurons (26 M, 19 VM) that differentiated significantly between movements into and away from the RF before the saccade. Shaded areas indicate ±1 SE across neurons. In all plots, the y-axis corresponds to normalized firing rate.
First, motor activity for uninformed choices (short rPTs) should show a strong preference for movements into the RF shortly after the Go signal (Fig. 4b, left column). This preference should be evident before the Cue is even presented (Fig. 4b; middle column) and corresponds to strong differentiation well in advance of saccade onset (Fig. 4b, right column). Second, motor activity for informed choices (long rPTs) must build up more slowly and without a strong initial bias (Fig. 4d). This requirement specifically predicts a somewhat counterintuitive effect: during the prolonged period of motor ambivalence, the distracter motor plan may even lead temporarily (green traces above red), but ultimately the conflict must be resolved in favor of the correct choice. One such simulated trial was depicted earlier (Fig. 3g), but the same pattern is evident when averaging over many trials (Fig. 4d). Finally, the patterns of activity for intermediate rPTs should fall between the two extreme cases (Fig. 4c).
The essential elements of the model predictions are evident (Fig. 4f–h) in the mean responses of M and VM neurons that had spatially selective presaccadic activity (see Materials and Methods). In particular, informed choices (Fig. 4h) display prolonged conflict between the target (red traces) and distracter (green traces) motor plans, with that for the distracter being slightly more advanced initially. The motor conflict is resolved late and abruptly in favor of the correct choice via acceleration of the target activity and deceleration of the distracter activity, a process that is analyzed quantitatively further below. Guesses, in contrast, show no such ambiguity (Fig. 4f).
The recorded neural data are also in agreement with predicted differences between correct and incorrect choices in the direction of the cell's RF (Fig. 5). The mean responses in short-rPT trials (Fig. 5b,e) are identical because all guesses are equally uninformed, regardless of their outcome; however, the Cue does have an impact on relatively long-rPT trials, in which case errors can be explained as follows. First, shortly after the Go signal, activity happens to build up more rapidly than average (Fig. 5f, left column) in the direction of the distracter. This motor plan is decelerated once the perceptual signal arrives (Fig. 5c,f, right column), but the bias is too strong to be overcome in time to prevent motor activity from reaching threshold, and an incorrect movement is produced despite the deceleration. One such simulated trial was discussed above (Fig. 3h), but a similar pattern is again observed in the average across trials (Fig. 5c).
Figure 5.

Correct versus incorrect responses as predicted by the model and as observed in FEF motor-related activity. Model results are from the same simulation runs used in Figure 4. a, Tachometric curve obtained from simulated trials. Two rPT ranges were used to parse the data: short (white region; guesses) and long (gray shade; informed choices). b, c, Average model responses for correct (red) and incorrect (cyan) responses in the preferred direction of the model neurons. d–f, As in a–c, but for 45 FEF neurons (26 M, 19 VM) that differentiated significantly between movements into and away from the RF before the saccade (same cells as in Fig. 4). Shaded areas indicate ±1 SE across neurons. In all plots, the y-axis corresponds to normalized firing rate.
Temporal interaction between perceptual judgment and response selection
If informed choices on the CS task depend, as we contend, on the temporal convolution of a perceptual and a motor process, their separate contributions should still be evident when the time constraint is gradually relaxed and they are allowed to unfold in a more serial fashion. To investigate this, neurons were simultaneously studied with the CS and the easy-choice tasks (Fig. 1a,b; see Materials and Methods), which differ only in the relative timing of the Cue and the Go; a 0 ms Gap is equivalent to a 0 ms delay, and the longer the delay, the more time to view the red and green stimuli. Thus, whereas in the CS task the maximum Cue viewing time is rPT = RT − Gap, in the easy-choice task it is equal to RT + delay. We compared motor-related activity in subsets of trials grouped according to progressively longer Cue viewing times.
This analysis revealed a time-varying interaction between perceptual and motor-planning processes. As Cue viewing time increases (Fig. 6a–d), the activity profile expands progressively, reaching its largest temporal spread at the longest delays (Fig. 6d). Here, it is possible to visually resolve two distinct peaks in the target-related activity (red traces) aligned on either the Cue (Fig. 6d, left) or the Go (Fig. 6d, middle). These two activations, which presumably correspond to perceptual and motor-related responses, become less distinct when the Cue and saccade onset are closer in time (Fig. 6a–c). Aligned on saccade onset (Fig. 6, right), the progressively earlier impact of the Cue is evident both in the increasingly earlier resolution of the target/distracter conflict and in the decreasing slope of the target-related motor activity.
Figure 6.
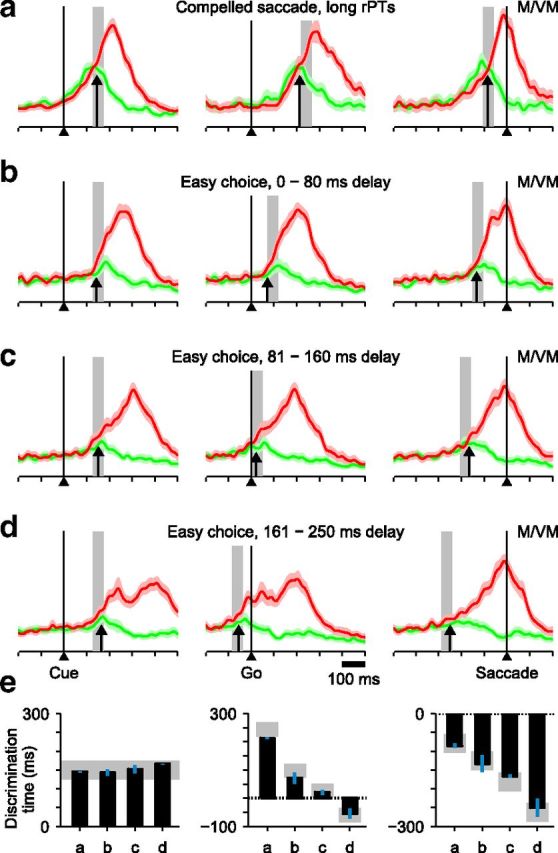
Temporal interaction between perceptual processing and motor planning. Normalized firing rates from neurons (19 M, 15 VM) that had significant presaccadic differentiation in the CS task and were also tested in the easy-choice task. Spike trains were aligned either on the Cue (left column), the Go signal (middle column), or saccade onset (right column). a, Neural responses in CS trials with long rPTs (>200 ms). Gray bars indicate the expected time of neural discrimination, taken as 150 ± 25 ms after Cue onset. Black arrows indicate the time of neural discrimination as measured with an ROC index (see Materials and Methods). b, Neural responses in easy-choice trials with short delays (0–80 ms) between the Cue and the Go. c, As in b, but for intermediate delays (81–160 ms). d, As in b, but for long delays (161–250 ms). e, Measured (black bars) and expected (gray regions) times of neural discrimination from a–d for each column. Blue lines are SEs estimated through a jackknife procedure (see Materials and Methods).
To appreciate the impact of perceptual information in determining the shapes of these activity profiles, it is important to note that, for saccades to single targets, the slope or build-up rate of FEF presaccadic responses is inversely related to RT (Hanes and Schall, 1996; Heitz and Schall, 2012); that is, shorter RTs are associated with steeper motor plans. This basic relationship, which is built into the accelerated race-to-threshold model, could potentially explain the variations in build-up rate that we observe as functions of Cue viewing time (because, in general, RT and rPT are positively correlated). This explanation is wrong, however, because in the easy-choice task RTs actually decrease for longer delays (Fig. 7a). Thus, based on differences in RT alone, one would expect the exact opposite of the progression seen in Figure 6 (Fig. 7b). This demonstrates a profound effect of the Cue information on the observed motor plans: to produce the observed association of shallower slope and shorter RT (Fig. 6), the impact of perceptual information must be powerful enough to overcome the natural and opposite association between steepness and RT.
Although performance in the CS and easy-choice tasks is very different—easy choices are fully informed and virtually 100% correct at all delays—both tasks require the same color judgment. Therefore, the time course of neural discrimination should be the same, and it should coincide with the behavioral time course provided by the tachometric curve (Fig. 3c). So, taking the center point of the curve (75% correct) to be at rPT = 150 ms, the neural discrimination should always occur ∼150 ms after Cue onset (Fig. 6a–d, gray areas show average time of Cue presentation plus 150 ± 25 ms). This is, indeed, what we found: regardless of how the data are aligned, the measured discrimination time (Fig. 6a–d, arrows; see Materials and Methods) is always close to that predicted (Fig. 6e).
Impact of perceptual modulation as a function of cell type
To this point, analysis has been restricted to neurons (M and VM) with spatially selective presaccadic activity because of their likely role in response specification—and their dynamics are largely consistent with the predictions of the model. However, as explained in the Introduction, evidence indicates that visually responsive FEF neurons (VM and V) play an important role in perceptual-based target selection, which is associated with the deployment of spatial attention and thought to precede motor planning.
If this serial scheme is obligate, one would expect visually responsive cells to demonstrate robust and perhaps slightly earlier target/distracter discrimination during informed choices. To examine this prediction, we compared activity from four groups of neurons recorded in the CS and easy-choice tasks (Fig. 8): the V (n = 12) and M (n = 19) categories, plus a distinction between VM neurons that did (n = 15) or did not (n = 17) have significant, spatially selective presaccadic activation (see Materials and Methods). In contrast to the intuitive expectation, evidence of the perceptual judgment declined systematically with decreasing motor and increasing sensory response dominance (Fig. 8a–d). Moreover, this effect was not specifically due to the unique demands of the CS task (Fig. 8, right), as the magnitude of Cue-linked differentiation demonstrated the same diminishing trend on the easy-choice task (Fig. 8, middle).
Figure 8.
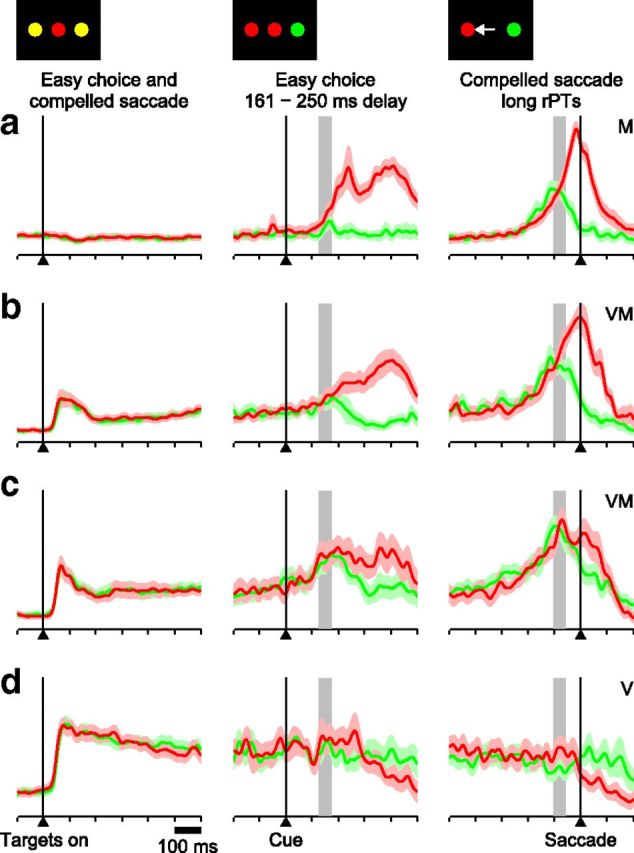
Impact of perceptual modulation depends on neuronal type. a, Normalized firing rate for 19 M neurons that differentiated significantly between inward (red traces) and outward saccades (green traces) in the CS task (left and right) and were also tested in the easy-choice task (left and middle). Easy-choice trials include those with longest delays (161–180 ms) only, and are aligned on Cue onset. CS-task trials include those with long rPTs (> 200 ms) only, and are aligned on saccade onset. Gray bars indicate the expected time of perceptual discrimination, taken as 150 ± 25 ms after Cue onset. b, As in a, but for 15 VM neurons that differentiated significantly in the CS task. c, As in a, but for 17 VM neurons that did not differentiate significantly in the CS task. d, As in a, but for 12 V neurons. Overall, the neurons with the strongest perceptual modulation are those with the weakest visual responses.
As pointed out earlier, target-related activity for long delays on the easy-choice task shows an early peak linked to Cue onset and a later peak around the times of saccade onset (Fig. 6d, left). It is important to emphasize that this early activation is not a sensory signal per se, which would have a much shorter latency, but a perceptual, decision-based modulation of ongoing activity. This Cue-linked modulation/differentiation is largest for purely motor cells (Fig. 8a, middle), neurons that had no stimulus-driven activation on single-target delay trials (Fig. 2a), nor transient responses to the presentation of the two potential (yellow) targets in either the easy-choice or CS tasks (Fig. 8a, left). Both the magnitude of the peak and the degree to which activity differentiates target from distracter decline with diminishing motor dominance (Fig. 8b–d), with purely visual cells (Fig. 8d) modulated extremely weakly or not at all. In short, the more dominant the visually related response of a neuron, the weaker its perceptual modulation. This counterintuitive result is analyzed in quantitative terms in the sections that follow.
Temporal correlate of perceptual modulation as a function of cell type
A fundamental assumption of our race-to-threshold model is that perceptual information accelerates the correct (target) motor plan and decelerates the incorrect (distracter) plan. Crucially, the total time during which accelerations and decelerations are applied is directly proportional to the rPT, and therefore their impact on the ongoing neural activity should vary in close temporal correspondence to the tachometric curve. This impact can be quantified by the convexity of the firing rate trajectories leading to the saccade, because convexity is closely related to mean acceleration/deceleration (Stanford et al., 2010) (see Materials and Methods).
According to the model (Fig. 9a), in the CS task, convexity should become increasingly positive for the target (red) motor plan and increasingly negative for the distracter (green) plan as a function of rPT. These model predictions matched the actual estimates of mean convexity to varying degrees, depending on the cell type. Although somewhat noisy, for M neurons (Fig. 9b), the predicted relationship is quite evident in both the target- (red) and distracter-related (green) activities; their respective positive and negative trends were both highly significant (Fig. 9, caption). For VM neurons (the spatially selective group, Fig. 9c), the match is clear and significant for the distracter-related activity (green) only. And for V neurons (Fig. 9d), evidence that convexity varies with rPT is quite weak; there is a marginally significant trend in the target-related activity, but it is decreasing, indicating that, if anything, V responses turn downward slightly more sharply in long-rPT than in short-rPT trials. Other analyses confirmed that the activity of V neurons is highly insensitive to rPT (see below).
Activity bias as a neural correlate of uninformed choices
At short rPTs, choices are uninformed saccadic plans that develop fully before the arrival of sensory information. They are based solely on a motor planning bias arbitrarily favoring one of the alternatives. Such a bias might develop even before the Go signal, upon presentation of the potential targets. Indeed, qualitatively, this is precisely what Figure 4f suggests: the baseline firing rate preceding correct guesses toward the target location (red traces) is elevated relative to that for the distracter location (green traces), and the difference develops long in advance of saccade onset. A similar, early difference in baseline is also visible when comparing correct versus incorrect trials into the RF (Fig. 5f). So, when the perceptual information was absent and the early activity of M and VM neurons was higher than average, the subject was more likely to make a choice into those neurons' RFs (Shadlen and Newsome, 2001; Williams et al., 2003; de Lange et al., 2013).
Notably, the tachometric curve implies that any such imbalance should decline systematically as a function of rPT, as the proportion of uninformed to informed choices changes to favor the latter. Thus, there are two important questions about this apparent choice bias: does it depend on rPT, as expected, and, what are the relative contributions of different cell types to it? To investigate this, the normalized response during a pre-Go signal epoch was calculated as a function of rPT (Fig. 10, caption) for each of the three response-type categories, with trials leading to movements into (red) or away from (green) the RF analyzed separately. The declining bias trend is evident and significant for both the M (Fig. 10a) and VM (the spatially selective subset, Fig. 10b) populations, whereas for the V group there is no significant trend (Fig. 10c). In contrast to M and VM neurons, V neurons do not seem to contribute to the arbitrary, internal imbalance that must determine rapid uninformed choices.
Expected differentiation in V neurons
The accelerated race-to-threshold model predicts in quantitative detail the motor-related responses that should be observed during performance of the CS task (Figs. 4b–d, 5b,c, 9a), but it makes no prediction for the visually driven activity. However, based on numerous previous results (Thompson et al., 1997, 2005; Murthy et al., 2001, 2009; Sato et al., 2001; Sato and Schall, 2003; Lee and Keller, 2008; Monosov et al., 2008, 2010; Monosov and Thompson, 2009; Zhou and Desimone, 2011), the expectation is to observe a differential response signaling target versus distracter in the RF and lasting until saccade onset, at least when the Cue information is available early enough. To determine quantitatively what the activity of differentiating V neurons should look like in the context of the CS task, we did the following (see Materials and Methods for details).
First, based on earlier reports, we generated an ideal V-neuron response (Fig. 11a) and assumed that, in the CS task, the time course of its differentiation would always be the same relative to Cue onset. Then, for each of the 18 neurons that were classified as purely visual, the ideal V firing rate was scaled according to the mean rate measured before Cue presentation, and spike trains were generated with the same RT and rPT values that were actually measured. This resulted in 18 sets of simulated spike trains that closely matched the statistics of the collected experimental data. Finally, the simulated responses were analyzed exactly as if they had been recorded (Fig. 11b–d).
The results show unambiguously that if purely visual neurons discriminate target from distracter, then they should differentiate before the saccade in long-rPT trials (Fig. 11c) but not in short-rPT trials (Fig. 11b). In the former there is sufficient time between the Cue and the saccade for the separation to occur, whereas in the latter there is not. Notably, the firing rate levels attained at saccade onset in short and long conditions (Fig. 11b,c, arrows) are a direct reflection of the pre-Cue and post-Cue firing rates assumed for the ideal V traces (Fig. 11a, arrows). As a consequence, the mean firing rate measured before the saccade varies systematically as a function of rPT and in proportion to the strength of the cells' target/distracter differentiation (Fig. 11d). Thus, the analysis of V-neuron responses should be much simpler than that of their M and VM counterparts, because in theory, their differentiation and rPT dependence should be purely perceptually driven and not in any way convolved with a developing motor plan.
Lack of differentiation in V neurons
To compare the experimental data to the theoretical expectation just described, the responses of the 18 V neurons recorded in the CS task were aligned on the three main task events (Go, Cue, saccade onset) and averages were generated separately for correct trials with either the target or distracter in the cells' RF (Fig. 12a,b). The resulting firing rate traces show scant evidence of target/distracter selectivity during long-rPT trials (Fig. 12b); they are statistically identical in time windows for which, on average, the Cue was presented 150 ms earlier (Fig. 12b, gray and yellow shades). By that point in time, the Cue already has an impact on the subject's choices (Fig. 3c) and the motor conflict gets resolved (Fig. 6)—yet no significant V differentiation is observed.
Figure 12.
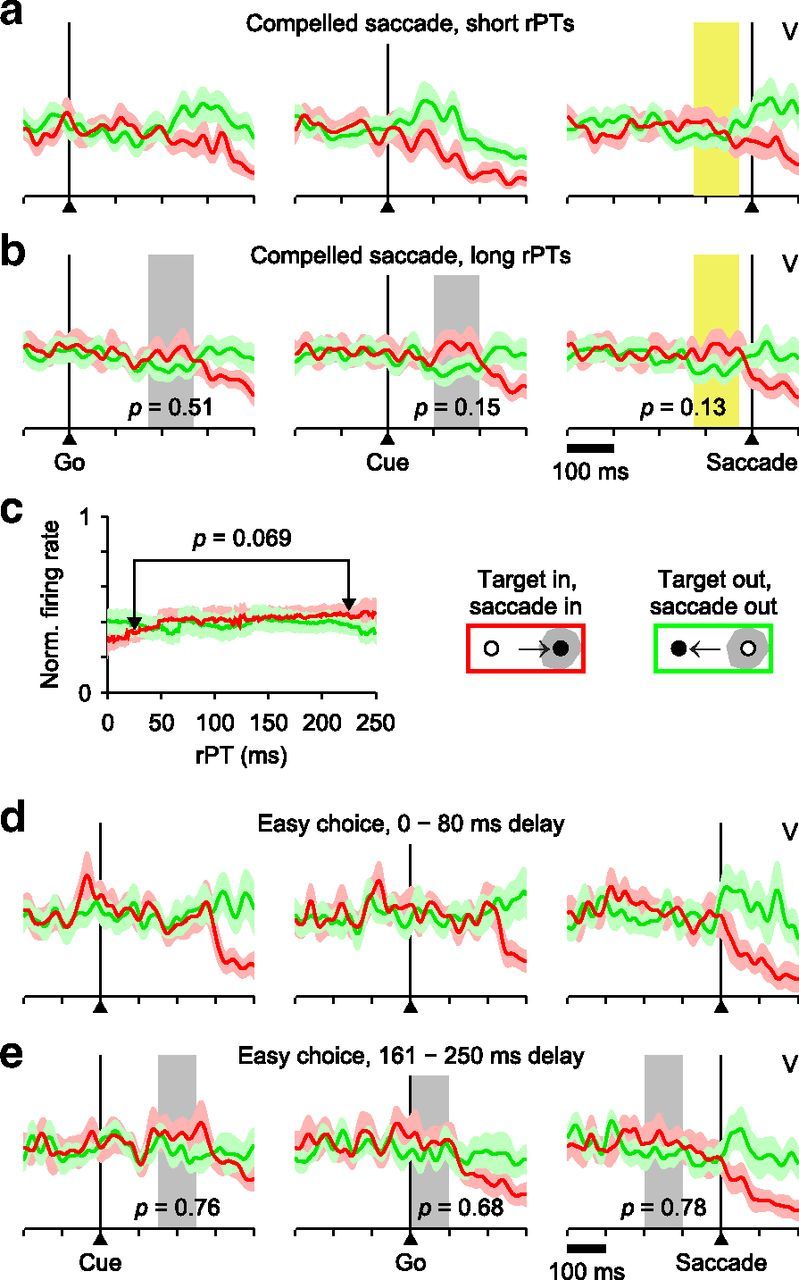
Scant evidence of perceptual modulation in V neurons. a, Activity of 18 V neurons recorded in the CS task and aligned on the Go signal (left), Cue (middle), or saccade onset (right) in short-rPT trials. Red and green traces are for target and distracter in the RF, respectively. b, As in a, but for long-rPT trials. Short-rPT and long-rPT ranges are as in Figure 4e. Differences between target- and distracter-related responses within chosen time windows (gray and yellow shades) were evaluated through permutation tests (p values shown). c, Mean V responses as functions of rPT. Firing rates were computed in a 100 ms time window preceding saccade onset (yellow shades in a and b) for all trials within each rPT bin (bin width = 80 ms). The window was centered on the mean Cue onset time of the long-rPT trials used in b, plus 150 ms. The shown p value is for the target-related response compared across the two rPT bins indicated (rPT = 25 and 225 ms, permutation test). d, Responses of 12 V neurons during short-delay trials of the easy-choice task. e, As in d, but for long-delay trials. Gray shades indicate time windows for which target- and distracter-related responses were compared (p values shown; permutation test).
Additionally, the firing rate of V neurons before the saccade also varies minimally as a function of rPT (Fig. 12c); there is a positive trend for trials with the target in the RF (Fig. 12c, red trace), which is consistent with the expected effect, but it is extremely slight and not significant. For the V neurons, the only salient differences that correlate with rPT (e.g., Fig. 12a, middle column, 100 after Cue onset) are due simply to postsaccadic activity, and reflect a steep, characteristic decrease in the target-related response (red trace) and a small increase in the distracter-related response (green trace) that occur after the eye movement (see data after saccade onset on Fig. 12a,b,d,e, right column).
The V neurons also fail to differentiate between target and distracter in the easy-choice task (Fig. 12d,e; see also Fig. 8d). This is quite surprising, particularly for long delays, because the interval of time between Cue and saccade onset would seem to provide ample opportunity for a differential signal to develop. However, even here the separation is extremely weak or absent (Fig. 12e), suggesting that the lack of target/distracter differentiation in these particular two-alternative choice tasks is not simply a matter of Cue timing (see Discussion).
Presaccadic differentiation across neuron types
The above analyses yield an interesting contrast between movement-related and visually driven responses in FEF. As mentioned in the Introduction, the selective firing of M and V neurons before a saccade has different interpretations, the former signaling whether the impending eye movement is into or away from the cells' RF, and the latter, in most previous studies, signaling whether a target or a distracter is in the RF. In the CS task, however, the crucial quantity is processing time, and each neuron type presents a distinctive dependence. For M neurons, the accelerated race-to-threshold model predicts that the difference between inward and outward responses should decrease slightly as a function of rPT, because long-rPT trials are associated with stronger conflict between motor plans (Fig. 4f–h, right column). In contrast, for an ideal V neuron the difference should grow monotonically with rPT (Fig. 11d).
In the previous section we described how, in fact, V neurons show little, if any, significant differentiation, regardless of rPT (Fig. 12). Potentially, however, such result could be partially explained as an artifact of our classification scheme: some of the neurons that were labeled as VM could conceivably be purely visual neurons that did differentiate strongly before a saccade and thus might have been misclassified. This is unlikely for three reasons, though. First, the motor-related activation of each neuron was established independently of its degree of differentiation; it was based on the level of presaccadic activity relative to that in a preplanning window (see Materials and Methods). Second, after grouping the neurons as M, VM, or V, their responses in the delayed-saccade task (Fig. 2) displayed all the features expected of those cell types (Bruce and Goldberg, 1985). Third, the classification was also consistent with the average magnitude of the stimulus-evoked transient in the CS and easy-choice tasks (Fig. 8, left column).
Nevertheless, to verify that the lack of V differentiation was not an artifact of our classification criteria, we further scrutinized the strengths of the visual and presaccadic modulations of all the recorded neurons (Fig. 13). First we considered, for each neuron, its presaccadic differential activity and its visual response (Fig. 13a, caption), and found that in the resulting plot the neuronal categories are clustered just as expected from the results presented earlier: M neurons differentiate to various degrees but have no significant visual activity (Fig. 13a, blue circles), V neurons do have visual activity but do not differentiate (Fig. 13a, red circles), and VM neurons are typically intermediate; most of them differentiate (Fig. 13a, white circles), although some do not (Fig. 13a, white triangles).
Figure 13.

Strength of presaccadic differentiation across cell types. a, Presaccadic differential activity versus visually evoked activity for all (n = 119) recorded neurons. Abscissas indicate the mean firing rate in a time window following the display of the two yellow targets (50–250 ms with zero at stimulus onset), rVis, minus the baseline firing rate, rBase, calculated in a prestimulus window (−300 to 0 ms with zero at stimulus onset). The ordinate is the difference between correct responses into the RF, rIN (target in RF), and correct responses away from the RF, rOUT (distracter in RF), in a time window just before the saccade (−100 to 0 ms with zero at saccade onset). All processing times are included. Symbols correspond to neurons classified as M, VM, or V, as marked; small dots indicate other neurons. White circles and triangles are for VM neurons with and without significant differential activity, respectively. b, Differential presaccadic activity in long-rPT versus short-rPT trials for each recorded neuron. Short and long groups were defined as in Figure 4a. c, Differential activity in short-rPT and long-rPT trials averaged across neurons of the same type. The VM category includes both differential and nondifferential cells. The differentiation of M neurons was weaker in long-rPT compared with short-rPT trials (*p = 0.008, permutation test). All responses are in spikes/s.
Next, we compared the differential response of each neuron in guesses versus fully informed choices (Fig. 13b,c) using the same rPT intervals defined earlier (Fig. 4a). Here, M neurons differentiated slightly but significantly less in long-rPT than in short-rPT trials (Fig. 13c), as predicted by the model. In contrast, for V neurons the mean presaccadic selectivity was close to zero in both conditions (Fig. 13c); only one cell was clearly more selective in long-rPT trials (Fig. 13b, red circle with ordinate >60 spikes/s), and that unit had relatively few trials (8 and 9 in the short and long conditions, respectively). More importantly, on average the VM neurons were equally selective during guesses and informed choices (Fig. 13c), and none of them stood out as a potentially misclassified, differentiating V neuron.
Discussion
We investigated the relationship between FEF activity, perceptual processing, and motor choice, and report two contrasting findings. First, the activity of M neurons in FEF correlated with the subject's choices and was highly sensitive to the evolving perceptual judgment: it was spatially selective, it seemed related to a putative internal biasing mechanism needed to generate random, uninformed choices, and depended strongly on the arrival time of perceptual information (rPT). Furthermore, these effects were explained in quantitative detail by a heuristic phenomenological model based on a simple premise, that rapid choices are instantiated in neuronal activity as a competition between ongoing saccadic plans. This description was valid when motor planning started ahead of perceptual processing (short rPTs/guesses in CS task), when they overlapped (long rPTs/informed choices in CS task), and when perceptual processing led motor planning (easy-choice task).
At the other extreme, the activity of V neurons was almost completely independent of the perceptual judgment: its selectivity (i.e., target/distracter differentiation) was minimal, it seemed unrelated to the putative biasing mechanism associated with random, uninformed choices, and it showed an extremely weak dependence on the arrival time of perceptual information (rPT). In addition, the responses of VM neurons suggested a continuum between these extremes; the more motor-related the neuron—i.e., the less sensory-driven—the more it is influenced by perceptual information.
Contrast with previous studies
In the context of prior work in visual selection and visuospatial attention, the relative disengagement of the visual responses from the choice process is striking, because in a vast number of studies a robust target/distracter differentiation in V and VM neurons occurs before a motor plan is launched (Thompson et al., 1996, 1997, 2005; Murthy et al., 2001, 2009; Sato et al., 2001; Sato and Schall, 2003; Lee and Keller, 2008; Monosov et al., 2008, 2010; Monosov and Thompson, 2009; Zhou and Desimone, 2011; Steinmetz and Moore, 2012). The functional interpretation of those findings is that visually responsive neurons first select objects from among competing alternatives and then inform neurons with motor-related activity so that an appropriate saccade vector may be planned (Schall, 2001; Thompson et al., 2005; Schall et al., 2011; Purcell et al., 2012). However, two design features of our tasks may explain the apparent contradiction.
First, in the CS and easy-choice tasks, spatial attention and saccade planning need not be spatially congruent because, given just two alternatives, the two stimuli are equally informative; i.e., determining the color of either is sufficient to infer the target location. Attentional demands are likely to be very different in other search tasks: when the discrimination is easy but there are multiple distracters, as in oddball or “pop-out” variants, the target itself draws attention rapidly via exogenous or stimulus-driven mechanisms, and when the discrimination is more difficult it requires endogenous spatial attention to be deployed (Treisman and Gelade, 1980; Horowitz et al., 2004; Busse et al., 2008). Consistent with this, the timing with which V neurons differentiate target from distracter and the intensity of their responses depend on the type of search task and on the number of distracters present (Thompson et al., 1996; Bichot and Schall, 1999; Sato et al., 2001; Lee and Keller, 2008; Cohen et al., 2009).
Second, the CS task places a very strong temporal constraint on the deployment of spatial attention. Consider a trial in which the focus of attention must shift from the distracter to the target. Experimental evidence indicates that such an endogenous, or cognitively driven shift requires 200–300 ms (Horowitz et al., 2004; Busse et al., 2008; Herrington and Assad, 2010; Carrasco, 2011). Thus, if attentional shifts are the antecedents of perceptual-based modulations of motor activity, they would need to be executed very rapidly to account for our finding that perceptual information impacts the motor plan within 150 ms of Cue presentation.
Visual search tasks, even those designed to transiently disrupt alignment between perceptual and motor processes (Murthy et al., 2001, 2009; Sato and Schall, 2003), promote serial order and eventual spatial alignment between attention and saccade planning. Assuming that the activity of FEF V neurons is a correlate of spatial attention, both conditions would favor strong selection-related responses. In contrast, in the CS task serial order is severely disrupted and spatial alignment is unnecessary, and in the easy-choice task neither seriality nor alignment are necessary or particularly advantageous. Thus, in these tasks, target selection could be strongly attenuated because, unlike the motor signals that must ultimately be congruent with the motor choice, attention could be (1) randomly assigned to equally informative target and distracter locations, or (2) simultaneously split across the two locations. If randomly assigned, an ideal, differential V response (Fig. 11a) fully linked to the locus of attention would not distinguish target from distracter when averaged over trials. Random assignment, however, would be expected to increase the variance of the firing response, because it would mix trials with attention directed to diametrically opposed locations. Notably though, no significant change in the variance of the recorded V neurons was found across time during a trial, nor between informed and uninformed choices, as would have been expected in this case. Alternatively, the possibility that spatial attention simultaneously enhances processing at multiple sites (Carrasco, 2011), although still a matter of some debate (Cave et al., 2010; Jans et al., 2010), is strongly supported by recent findings in area MT (Niebergall et al., 2011) and is generally consistent with other studies showing that V responses decrease systematically with the number of potential targets displayed (Lee and Keller, 2008; Cohen et al., 2009). In either case, our data reveal that conflict between opposing motor plans appears to be resolved independently of visual-related activity that would normally select the target of the impending saccade.
Motor planning as an ongoing process
Correct performance of the CS task requires ongoing motor plans to be modified on the fly based on incoming perceptual information. This situation is not as exceptional as the concept of goal-directed action might imply. Such ability is essential to the rapid decisions that are the hallmark of athletic performance; e.g., returning a tennis serve, hitting a curveball, or stopping a penalty. Furthermore, the stability of fixation times and intersaccadic intervals across a variety of visual scanning conditions (Berg et al., 2009; Castelhano et al., 2009) suggests that, normally, eye movements are programmed continuously, without waiting for perceptual events to reach a conclusion (McPeek et al., 2000).
Our findings reveal some of the neural mechanisms that allow the oculomotor system to operate in this mode, and notably, there are strong parallels between our results and those obtained by Cisek and colleagues, who propose that resolving conflict among multiple actions planned simultaneously is a fundamental characteristic of decision-making processes (Cisek and Kalaska, 2010). In their studies based on manual choice tasks (Cisek and Kalaska, 2005; Cisek, 2006; Cisek et al., 2009; Pastor-Bernier and Cisek, 2011), they find that perceptual information and other task contingencies, such as reward value or motivation, bias a motor selection process that is activated whenever multiple actions are possible. Consistent with our view, there is no intrinsic serial arrangement in their framework; motor preparation does not wait for cognitive or perceptual events to unfold, but instead is an ongoing process that is informed by those events whenever they occur. When available, such cognitive information partially determines the outcome, but the internal conflict gets resolved with (informed choices) or without it (guesses). A similar conclusion was reached by Klaes et al. (2011) as well.
Modeling results further support a unifying framework in which motor activity is modulated on the fly by perceptual decisions. Cisek (2006) developed a model that replicated reach-related activity in two tasks that differed in the order in which the choice targets and the sensory Cue were presented, just like our CS and easy-choice tasks. Although its implementation is very different from that of our accelerated race to threshold—Cisek's model is a recurrent network with multiple layers—that model also produces random and informed choices, and resolves the competition between possible actions at different times depending on when the relevant Cue information becomes available. The similarities across datasets are remarkable, given that motor plans in the reaching tasks develop over several seconds whereas in our oculomotor tasks they do so in <500 ms.
A flexible link between perception and motor planning
A major implication of our findings for understanding the role of FEF neural activity is that the link between target selection or spatial attention and motor planning must be highly flexible. As such, the responses of V neurons, which presumably determine the locus of spatial attention, will not always differentiate between targets and distracters before perceptually informed choices. The differentiation may be manifest just in the ongoing activity of the M neurons as a modulation that is congruent with the perceptual decision and depends strongly on processing time. In such cases, for neurons with mixed properties (i.e., VM), the undifferentiated visual signal can only degrade the processing time-dependent modulation of the motor plan, thus explaining why the least visual neurons display the most robust modulations.
Footnotes
Research was supported by the National Institutes of Health–National Eye Institute Grants R01EY12389, R01EY12389-S1, and F31EY020107, by the National Institutes of Health–National Institute of Drug Abuse GrantR01DA030750 as part of the National Science Foundation–National Institutes of Health Collaborative Research in Computational Neuroscience Program, and by the National Institutes of Health–National Institute of Neurological Disorders and Stroke Training Grant T32NS073553-01.
References
- Armstrong KM, Fitzgerald JK, Moore T. Changes in visual receptive fields with microstimulation of frontal cortex. Neuron. 2006;50:791–798. doi: 10.1016/j.neuron.2006.05.010. [DOI] [PubMed] [Google Scholar]
- Awh E, Armstrong KM, Moore T. Visual and oculomotor selection: links, causes and implications for spatial attention. Trends Cogn Sci. 2006;10:124–130. doi: 10.1016/j.tics.2006.01.001. [DOI] [PubMed] [Google Scholar]
- Berg DJ, Boehnke SE, Marino RA, Munoz DP, Itti L. Free viewing of dynamic stimuli by humans and monkeys. J Vis. 2009;9(5):19.1–15. doi: 10.1167/9.5.19. [DOI] [PubMed] [Google Scholar]
- Bichot NP, Schall JD. Effects of similarity and history on neural mechanisms of visual selection. Nat Neurosci. 1999;2:549–554. doi: 10.1038/9205. [DOI] [PubMed] [Google Scholar]
- Bruce CJ, Goldberg ME. Primate frontal eye fields. I. Single neurons discharging before saccades. J Neurophysiol. 1985;53:603–635. doi: 10.1152/jn.1985.53.3.603. [DOI] [PubMed] [Google Scholar]
- Bruce CJ, Goldberg ME, Bushnell MC, Stanton GB. Primate frontal eye fields. II. Physiological and anatomical correlates of electrically evoked eye movements. J Neurophysiol. 1985;54:714–734. doi: 10.1152/jn.1985.54.3.714. [DOI] [PubMed] [Google Scholar]
- Busse L, Katzner S, Treue S. Temporal dynamics of neuronal modulation during exogenous and endogenous shifts of visual attention in macaque area MT. Proc Natl Acad Sci U S A. 2008;105:16380–16385. doi: 10.1073/pnas.0707369105. [DOI] [PMC free article] [PubMed] [Google Scholar]
- Carrasco M. Visual attention: the past 25 years. Vision Res. 2011;51:1484–1525. doi: 10.1016/j.visres.2011.04.012. [DOI] [PMC free article] [PubMed] [Google Scholar]
- Castelhano MS, Mack ML, Henderson JM. Viewing task influences eye movement control during active scene perception. J Vis. 2009;9(3):6.1–15. doi: 10.1167/9.3.6. [DOI] [PubMed] [Google Scholar]
- Cave KR, Bush WS, Taylor TG. Split attention as part of a flexible attentional system for complex scenes: comment on Jans, Peters, and De Weerd (2010) Psychol Rev. 2010;117:685–696. doi: 10.1037/a0019083. [DOI] [PubMed] [Google Scholar]
- Cisek P. Integrated neural processes for defining potential actions and deciding between them: a computational model. J Neurosci. 2006;26:9761–9770. doi: 10.1523/JNEUROSCI.5605-05.2006. [DOI] [PMC free article] [PubMed] [Google Scholar]
- Cisek P, Kalaska JF. Neural correlates of reaching decisions in dorsal premotor cortex: specification of multiple direction choices and final selection of action. Neuron. 2005;45:801–814. doi: 10.1016/j.neuron.2005.01.027. [DOI] [PubMed] [Google Scholar]
- Cisek P, Kalaska JF. Neural mechanisms for interacting with a world full of action choices. Annu Rev Neurosci. 2010;33:269–298. doi: 10.1146/annurev.neuro.051508.135409. [DOI] [PubMed] [Google Scholar]
- Cisek P, Puskas GA, El-Murr S. Decisions in changing conditions: the urgency-gating model. J Neurosci. 2009;29:11560–11571. doi: 10.1523/JNEUROSCI.1844-09.2009. [DOI] [PMC free article] [PubMed] [Google Scholar]
- Cohen JY, Heitz RP, Woodman GF, Schall JD. Neural basis of the set-size effect in frontal eye field: timing of attention during visual search. J Neurophysiol. 2009;101:1699–1704. doi: 10.1152/jn.00035.2009. [DOI] [PMC free article] [PubMed] [Google Scholar]
- Davison AC, Hinkley D. Bootstrap methods and their applications. Cambridge, UK: Cambridge UP; 2006. [Google Scholar]
- de Lange FP, Rahnev DA, Donner TH, Lau H. Prestimulus oscillatory activity over motor cortex reflects perceptual expectations. J Neurosci. 2013;33:1400–1410. doi: 10.1523/JNEUROSCI.1094-12.2013. [DOI] [PMC free article] [PubMed] [Google Scholar]
- DiCarlo JJ, Maunsell JH. Using neuronal latency to determine sensory-motor processing pathways in reaction time tasks. J Neurophysiol. 2005;93:2974–2986. doi: 10.1152/jn.00508.2004. [DOI] [PubMed] [Google Scholar]
- Efron B. The jacknife, the bootstrap and other resampling plans. Philadelphia: Society for Industrial and Applied Mathematics; 1982. [Google Scholar]
- Gold JI, Shadlen MN. Representation of a perceptual decision in developing oculomotor commands. Nature. 2000;404:390–394. doi: 10.1038/35006062. [DOI] [PubMed] [Google Scholar]
- Gregoriou GG, Gotts SJ, Desimone R. Cell-type-specific synchronization of neural activity in FEF with V4 during attention. Neuron. 2012;73:581–594. doi: 10.1016/j.neuron.2011.12.019. [DOI] [PMC free article] [PubMed] [Google Scholar]
- Hanes DP, Schall JD. Neural control of voluntary movement initiation. Science. 1996;274:427–430. doi: 10.1126/science.274.5286.427. [DOI] [PubMed] [Google Scholar]
- Heitz RP, Schall JD. Neural mechanisms of speed-accuracy tradeoff. Neuron. 2012;76:616–628. doi: 10.1016/j.neuron.2012.08.030. [DOI] [PMC free article] [PubMed] [Google Scholar]
- Herrington TM, Assad JA. Temporal sequence of attentional modulation in the lateral intraparietal area and middle temporal area during rapid covert shifts of attention. J Neurosci. 2010;30:3287–3296. doi: 10.1523/JNEUROSCI.6025-09.2010. [DOI] [PMC free article] [PubMed] [Google Scholar]
- Horowitz TS, Holcombe AO, Wolfe JM, Arsenio HC, DiMase JS. Attentional pursuit is faster than attentional saccade. J Vis. 2004;4(7):585–603. doi: 10.1167/4.8.585. [DOI] [PubMed] [Google Scholar]
- Jans B, Peters JC, De Weerd P. Visual spatial attention to multiple locations at once: the jury is still out. Psychol Rev. 2010;117:637–684. doi: 10.1037/a0019082. [DOI] [PubMed] [Google Scholar]
- Juan CH, Shorter-Jacobi SM, Schall JD. Dissociation of spatial attention and saccade preparation. Proc Natl Acad Sci U S A. 2004;101:15541–15544. doi: 10.1073/pnas.0403507101. [DOI] [PMC free article] [PubMed] [Google Scholar]
- Klaes C, Westendorff S, Chakrabarti S, Gail A. Choosing goals, not rules: deciding among rule-based action plans. Neuron. 2011;70:536–548. doi: 10.1016/j.neuron.2011.02.053. [DOI] [PubMed] [Google Scholar]
- Lee KM, Keller EL. Neural activity in the frontal eye fields modulated by the number of alternatives in target choice. J Neurosci. 2008;28:2242–2251. doi: 10.1523/JNEUROSCI.3596-07.2008. [DOI] [PMC free article] [PubMed] [Google Scholar]
- McPeek RM, Skavenski AA, Nakayama K. Concurrent processing of saccades in visual search. Vision Res. 2000;40:2499–2516. doi: 10.1016/S0042-6989(00)00102-4. [DOI] [PubMed] [Google Scholar]
- Monosov IE, Thompson KG. Frontal eye field activity enhances object identification during covert visual search. J Neurophysiol. 2009;102:3656–3672. doi: 10.1152/jn.00750.2009. [DOI] [PMC free article] [PubMed] [Google Scholar]
- Monosov IE, Trageser JC, Thompson KG. Measurements of simultaneously recorded spiking activity and local field potentials suggest that spatial selection emerges in the frontal eye field. Neuron. 2008;57:614–625. doi: 10.1016/j.neuron.2007.12.030. [DOI] [PMC free article] [PubMed] [Google Scholar]
- Monosov IE, Sheinberg DL, Thompson KG. Paired neuron recordings in the prefrontal and inferotemporal cortices reveal that spatial selection precedes object identification during visual search. Proc Natl Acad Sci U S A. 2010;107:13105–13110. doi: 10.1073/pnas.1002870107. [DOI] [PMC free article] [PubMed] [Google Scholar]
- Moore T, Fallah M. Control of eye movements and spatial attention. Proc Natl Acad Sci U S A. 2001;98:1273–1276. doi: 10.1073/pnas.98.3.1273. [DOI] [PMC free article] [PubMed] [Google Scholar]
- Müller JR, Philiastides MG, Newsome WT. Microstimulation of the superior colliculus focuses attention without moving the eyes. Proc Natl Acad Sci U S A. 2005;102:524–529. doi: 10.1073/pnas.0408311101. [DOI] [PMC free article] [PubMed] [Google Scholar]
- Murthy A, Thompson KG, Schall JD. Dynamic dissociation of visual selection from saccade programming in frontal eye field. J Neurophysiol. 2001;86:2634–2637. doi: 10.1152/jn.2001.86.5.2634. [DOI] [PubMed] [Google Scholar]
- Murthy A, Ray S, Shorter SM, Schall JD, Thompson KG. Neural control of visual search by frontal eye field: effects of unexpected target displacement on visual selection and saccade preparation. J Neurophysiol. 2009;101:2485–2506. doi: 10.1152/jn.90824.2008. [DOI] [PMC free article] [PubMed] [Google Scholar]
- Niebergall R, Khayat PS, Treue S, Martinez-Trujillo JC. Multifocal attention filters targets from distracters within and beyond primate MT neurons' receptive field boundaries. Neuron. 2011;72:1067–1079. doi: 10.1016/j.neuron.2011.10.013. [DOI] [PubMed] [Google Scholar]
- Pastor-Bernier A, Cisek P. Neural correlates of biased competition in premotor cortex. J Neurosci. 2011;31:7083–7708. doi: 10.1523/JNEUROSCI.5681-10.2011. [DOI] [PMC free article] [PubMed] [Google Scholar]
- Purcell BA, Schall JD, Logan GD, Palmeri TJ. From salience to saccades: multiple-alternative gated stochastic accumulator model of visual search. J Neurosci. 2012;32:3433–3446. doi: 10.1523/JNEUROSCI.4622-11.2012. [DOI] [PMC free article] [PubMed] [Google Scholar]
- Ratcliff R, Hasegawa YT, Hasegawa RP, Smith PL, Segraves MA. Dual diffusion model for single-cell recording data from the superior colliculus in a brightness-discrimination task. J Neurophysiol. 2007;97:1756–1774. doi: 10.1152/jn.00393.2006. [DOI] [PMC free article] [PubMed] [Google Scholar]
- Rizzolatti G, Riggio L, Dascola I, Umiltá C. Reorienting attention across the horizontal and vertical meridians: evidence in favor of a premotor theory of attention. Neuropsychologia. 1987;25:31–40. doi: 10.1016/0028-3932(87)90041-8. [DOI] [PubMed] [Google Scholar]
- Salinas E, Shankar S, Costello MG, Zhu D, Stanford TR. Waiting is the hardest part: comparison of two computational strategies for performing a compelled-response task. Front Comput Neurosci. 2010;4:153. doi: 10.3389/fncom.2010.00153. [DOI] [PMC free article] [PubMed] [Google Scholar]
- Sato TR, Schall JD. Effects of stimulus-response compatibility on neural selection in frontal eye field. Neuron. 2003;38:637–648. doi: 10.1016/S0896-6273(03)00237-X. [DOI] [PubMed] [Google Scholar]
- Sato T, Murthy A, Thompson KG, Schall JD. Search efficiency but not response interference affects visual selection in frontal eye field. Neuron. 2001;30:583–591. doi: 10.1016/S0896-6273(01)00304-X. [DOI] [PubMed] [Google Scholar]
- Schafer RJ, Moore T. Attention governs action in the primate frontal eye field. Neuron. 2007;56:541–551. doi: 10.1016/j.neuron.2007.09.029. [DOI] [PMC free article] [PubMed] [Google Scholar]
- Schafer RJ, Moore T. Selective attention from voluntary control of neurons in prefrontal cortex. Science. 2011;332:1568–1571. doi: 10.1126/science.1199892. [DOI] [PMC free article] [PubMed] [Google Scholar]
- Schall JD. Neural basis of deciding, choosing and acting. Nat Rev Neurosci. 2001;2:33–42. doi: 10.1038/35049054. [DOI] [PubMed] [Google Scholar]
- Schall JD. The neural selection and control of saccades by the frontal eye field. Philos Trans R Soc Lond B Biol Sci. 2002;357:1073–1082. doi: 10.1098/rstb.2002.1098. [DOI] [PMC free article] [PubMed] [Google Scholar]
- Schall JD, Purcell BA, Heitz RP, Logan GD, Palmeri TJ. Neural mechanisms of saccade target selection: gated accumulator model of the visual-motor cascade. Eur J Neurosci. 2011;33:1991–2002. doi: 10.1111/j.1460-9568.2011.07715.x. [DOI] [PMC free article] [PubMed] [Google Scholar]
- Shadlen MN, Newsome WT. Neural basis of a perceptual decision in the parietal cortex (area LIP) of the rhesus monkey. J Neurophysiol. 2001;86:1916–1936. doi: 10.1152/jn.2001.86.4.1916. [DOI] [PubMed] [Google Scholar]
- Shankar S, Massoglia DP, Zhu D, Costello MG, Stanford TR, Salinas E. Tracking the temporal evolution of a perceptual judgment using a compelled-response task. J Neurosci. 2011;31:8406–8421. doi: 10.1523/JNEUROSCI.1419-11.2011. [DOI] [PMC free article] [PubMed] [Google Scholar]
- Siegel S, Castellan NJ. Nonparametric statistics for the behavioral sciences. Boston: McGraw-Hill; 1988. [Google Scholar]
- Stanford TR, Shankar S, Massoglia DP, Costello MG, Salinas E. Perceptual decision making in less than 30 milliseconds. Nat Neurosci. 2010;13:379–385. doi: 10.1038/nn.2485. [DOI] [PMC free article] [PubMed] [Google Scholar]
- Steinmetz NA, Moore T. Lumping and splitting the neural circuitry of visual attention. Neuron. 2012;73:410–412. doi: 10.1016/j.neuron.2012.01.011. [DOI] [PubMed] [Google Scholar]
- Thompson KG, Hanes DP, Bichot NP, Schall JD. Perceptual and motor processing stages identified in the activity of macaque frontal eye field neurons during visual search. J Neurophysiol. 1996;76:4040–4055. doi: 10.1152/jn.1996.76.6.4040. [DOI] [PubMed] [Google Scholar]
- Thompson KG, Bichot NP, Schall JD. Dissociation of visual discrimination from saccade programming in macaque frontal eye field. J Neurophysiol. 1997;77:1046–1050. doi: 10.1152/jn.1997.77.2.1046. [DOI] [PubMed] [Google Scholar]
- Thompson KG, Biscoe KL, Sato TR. Neuronal basis of covert spatial attention in the frontal eye field. J Neurosci. 2005;25:9479–9487. doi: 10.1523/JNEUROSCI.0741-05.2005. [DOI] [PMC free article] [PubMed] [Google Scholar]
- Treisman AM, Gelade G. A feature-integration theory of attention. Cogn Psychol. 1980;12:97–136. doi: 10.1016/0010-0285(80)90005-5. [DOI] [PubMed] [Google Scholar]
- Williams ZM, Elfar JC, Eskandar EN, Toth LJ, Assad JA. Parietal activity and the perceived direction of ambiguous apparent motion. Nat Neurosci. 2003;6:616–623. doi: 10.1038/nn1055. [DOI] [PubMed] [Google Scholar]
- Wyder MT, Massoglia DP, Stanford TR. Contextual modulation of central thalamic delay-period activity: representation of visual and saccadic goals. J Neurophysiol. 2004;91:2628–2648. doi: 10.1152/jn.01221.2003. [DOI] [PubMed] [Google Scholar]
- Zhou H, Desimone R. Feature-based attention in the frontal eye field and area V4 during visual search. Neuron. 2011;70:1205–1217. doi: 10.1016/j.neuron.2011.04.032. [DOI] [PMC free article] [PubMed] [Google Scholar]
- Zhou HH, Thompson KG. Cognitively directed spatial selection in the frontal eye field in anticipation of visual stimuli to be discriminated. Vision Res. 2009;49:1205–1215. doi: 10.1016/j.visres.2008.03.024. [DOI] [PMC free article] [PubMed] [Google Scholar]