Abstract
Acoustic radiation force impulse imaging (ARFI) with Virtual Touch™ tissue quantification (VTTQ) enables the determination of shear wave velocity (SWV) in meters per second (m/s). The aim of our study was to describe the mean SWV in normal breast tissue and various breast masses. We performed measurements of SWV with ARFI VTTQ in 145 breast masses (57 malignant, 88 benign) and in the adjacent breast parenchyma and adipose tissue. The mean SWV as well as the rate of successful measurements were analyzed. The difference between adipose tissue and parenchyma was statistically significant (3.05 versus 3.65 m/s) (P < 0.001). Focusing on breast masses, numerous measurements exceeded the upper limit of possible measurement (≥9.10 m/s, indicated as “X.XX m/s”). Nevertheless, the difference between the malignant and benign masses was statistically significant (8.38 ± 1.99 m/s versus 5.39 ± 2.95 m/s) (P < 0.001). The best diagnostic accuracy (75.9%) was achieved when the cutoff point for malignancy was set to 9.10 m/s in ARFI VTTQ. This implies that the SWV was regarded as suspicious when the upper limit of possible measurement was exceeded and the machine returned the value X.XX m/s. In conclusion, ARFI VTTQ is a feasible method for measurement of SWV in a region of interest. Furthermore, we propose the event of a highly elevated SWV as a significant criterion for malignancy. However, the method is technically not yet fully developed, and the problem of unsuccessful measurements must still be solved.
Keywords: ARFI VTTQ, elastography, ultrasound, breast imaging
Introduction
Sonoelastography is a new technique for the evaluation of breast masses, and its performance has been thoroughly investigated in the recent literature.1–5 As a consequence of the development and growth of a malignancy, alterations may occur in breast tissue, resulting in modification of the tissue’s physical properties, including its elasticity. Elasticity is the tendency of a tissue to resume the original size and shape; while strain is the level of change in size or shape in response to external compression.3 Hard tissue, such as malignancy, is associated with decreased strain.6,7
The basic principle of sonoelastography is that the tissue is subjected to excitation by direct mechanical compression (in the case of strain-based sonoelastography) or by acoustic radiation force (as in acoustic radiation force impulse imaging [ARFI]). The resulting change in the physical properties of the tissue (ie, elasticity and strain) is evaluated quantitatively or qualitatively using the sonoelastogram.8 In shear wave elastography, a vertically directed acoustic push pulse is used to induce a horizontally directed elastic shear wave that propagates through the tissue. The velocity of the shear wave is measured by detection pulses, expressed in meters per second (m/s), and correlates with tissue elasticity.9–11
Generally, sonoelastography is added to conventional B-mode ultrasound in breast imaging, with the aim of improving the diagnostic accuracy. A recent meta-analysis has demonstrated that strain-based sonoelastography improves the specificity of conventional B-mode ultrasound.4 Today, nearly all ultrasound manufacturers have integrated elasticity imaging into their ultrasound systems. However, the performance of various elastography modules may be different.
Recently, the European Federation of Societies for Ultrasound in Medicine and Biology published a detailed overview of the technical background of sonoelastography, the various commercially available systems, and recommendations on the clinical use of ultrasound elastography.12,13
One of the latest technical developments in shear wave elastography is ARFI with Virtual Touch™ tissue imaging and Virtual Touch tissue quantification (VTTQ) (Siemens Medical Solutions, Inc., Mountain View, CA, USA). The primary aim of our study was to evaluate performance of ARFI VTTQ by assessing the SWV in the characterization and differentiation of breast masses. We hypothesized that in ARFI VTTQ, malignant breast lesions would exhibit a significantly different SWV from that exhibited by benign breast lesions. Our secondary study objective was to define a cutoff value that would allow a better differentiation between malignant and benign breast masses.
Materials and methods
Study design and population
Our study was carried out at the Breast Cancer Center of Franziskus Hospital in Bielefeld, Germany, between May 2011 and December 2011. For the purpose of our study cohort, participants were recruited from among women who attended the outpatient service of our breast cancer center for specific diagnostic queries, such as palpable breast lesions, breast pain, suspicious mammograms, or intensified screening in high-risk populations. Women with a breast mass of at least 5 mm in the longest diameter identified on ultrasound, who required further diagnostic tests for confirmation, were eligible for our study. B-mode ultrasound, doppler ultrasound, strain-based elastography, and shear wave elastography are all part of our diagnostic routine, and all data were obtained using a standard of care clinical protocol and approved equipment. Therefore, the responsible ethics committee did not demand additional approval for this noninterventional case study (Hannover Medical School Ethics Committee; Study-ID 1812–2013).
In eligible patients, we performed ARFI VTTQ of the breast mass, the adjacent adipose tissue, and the adjacent normal parenchyma of the breast, resulting in three SWV measurements (Figures 1–3).
Figure 1.
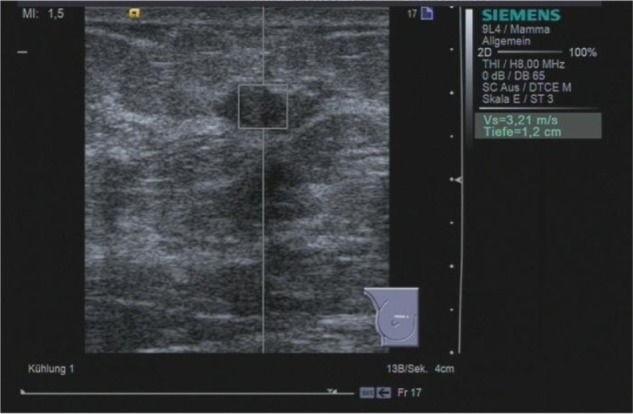
ARFI VTTQ of a benign breast lesion (fibrosis). The region of interest is set to the center of the lesion. Upon activation, a push pulse is generated, and detection pulses determine the velocity of the shear wave. Within milliseconds, the value (3.21 m/s) is returned.
Abbreviations: ARFI, acoustic radiation force impulse imaging; VTTQ, Virtual Touch™ tissue quantification.
Figure 3.
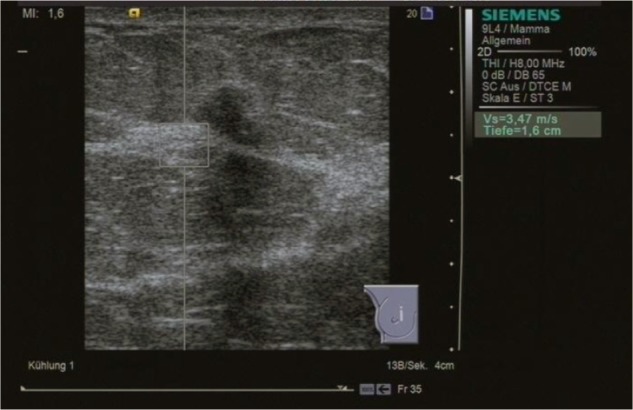
ARFI VTTQ of the adjacent breast parenchyma. The shear wave velocity is 3.47 m/s.
Abbreviations: ARFI, acoustic radiation force impulse imaging; VTTQ, Virtual Touch™ tissue quantification.
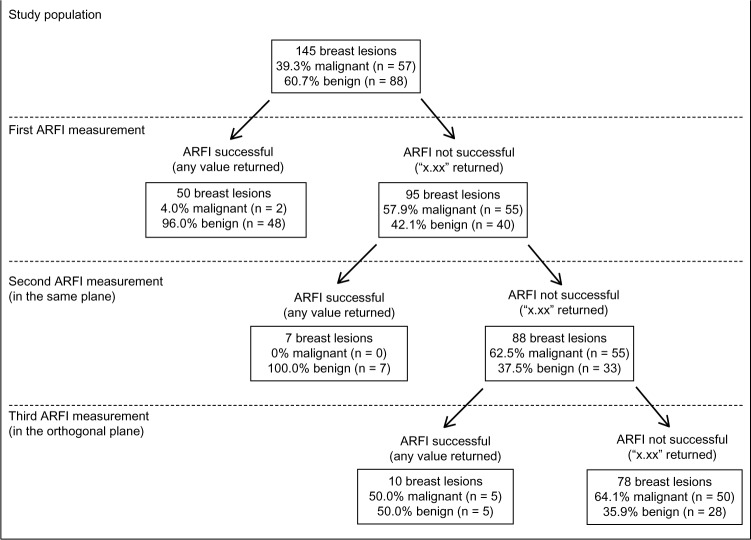
The measurement of SWV for the mass or adjacent adipose and parenchymal tissue was repeated when the initial attempt was not successful. For unsuccessful measurements of a breast mass SWV, the second attempt was performed in the same plane as in the initial measurement and the third attempt was done in the orthogonal plane, resulting in a maximum of two additional measurements (Figures 4–6). For breast masses, the region of interest for the ARFI VTTQ measurement was set to the center of the lesion.
Figure 4.
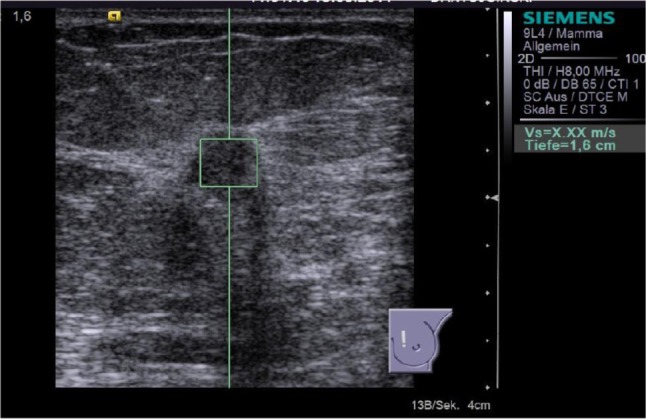
ARFI VTTQ of a malignant breast lesion (invasive ductal breast cancer). This measurement was unsuccessful (displayed as “X.XX m/s”) and had to be repeated, according to the study protocol.
Abbreviations: ARFI, acoustic radiation force impulse imaging; VTTQ, Virtual Touch™ tissue quantification.
Figure 6.
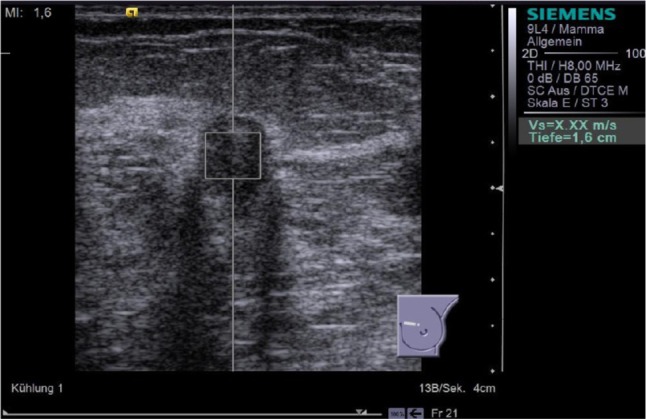
Result of the third attempt to perform ARFI VTTQ of the breast lesion from Figure 4. The orthogonal plane was used, but the measurement was still unsuccessful. This indicated that the SWV exceeded the upper limit of possible measurement (9.10 m/s).
Abbreviations: ARFI, acoustic radiation force impulse imaging; VTTQ, Virtual Touch™ tissue quantification.
The reference standards were the histological examination following core needle biopsy (in suspected solid masses), cytological examination following fine-needle aspiration (in suspected cystic masses), imaging follow up (after 3 months and after another 6 months), or comparison with previous imaging tests.
Imaging tests
For the sonographic examination, we used a Siemens Acuson S2000™ ultrasound system (Siemens Medical Solutions, Inc.), equipped with an 18 L6 HD linear transducer (5.5–18 MHz, 5.6 cm) for standard sonography and a 9 L4 linear transducer (4–9 MHz, 4.0 cm) for ARFI VTTQ.
SW, a senior consultant in gynecology with 7 years of experience in breast ultrasound and a level II qualification (certified by the German Society for Ultrasound in Medicine), performed the routine breast ultrasound and the ARFI VTTQ.14
ARFI VTTQ is a noninvasive technology that enables the examiner to investigate the elastic properties of tissues based on SWV. The VTTQ module provides absolute measurements of SWV expressed in m/s. For this purpose, the examiner determines a region of interest measuring 6 × 6 mm within the B-mode image. On activation, the probe generates an acoustic push pulse to induce an elastic shear wave, which propagates horizontally through the tissue. Detection pulses measure the propagation velocity of the shear wave. The entire process is performed within milliseconds. Whenever the measurement of the SWV is unsuccessful, the machine returns the result “X.XX m/s.” There are several different explanations for this effect. The result X.XX m/s may occur when the signal to noise ratio is poor, usually due to factors such as high shear wave attenuation or shear waves not being generated, due to attenuation of the push pulse. The shear wave may also become imperceptible if there is acoustic shadowing in the region of interest as the shear wave motion is extracted from the ultrasound signal. In these cases of technical failure, repeated measurements will eventually return a value. Therefore, we performed up to two additional measurements when we experienced an unsuccessful attempt. The result X.XX m/s may also indicate that the SWV is too fast and exceeds the upper limit of the possible measurement (9.10 m/s). Therefore, if X.XX m/s occurred in three consecutive measurements, we replaced X.XX m/s by a value of 9.10 m/s, as previously described by Bai et al.15
Statistical analysis
Microsoft® Office Excel® 2007 (Version 12.0.6425.1000, Microsoft Corporation, Redmond, WA, USA) was used for data collection.
The authors SW and KB performed the statistical analysis with MedCalc® 11.6 statistical software (MedCalc Software bvba, Ostend, Belgium). The results were presented as the mean ± standard deviation for numerical variables, and frequency and/or percentages for categorical variables. We used the Student’s t-test for comparison of the mean SWV in normal breast tissue and breast lesions. Fisher’s exact test was used to compare the failure rates of ARFI VTTQ measurements. Statistical significance was assumed as P < 0.05 for all tests. The sensitivity, specificity, and positive and negative predictive values were all calculated including the Newcombe 95% confidence interval.
Results
Demographics
Between May 2011 and December 2011, about 500 patients were seen in the outpatient service of our breast cancer center. Of these, 129 women were eligible and consented to enter our study, allowing the evaluation of 145 masses. None of the patients dropped out, and all cases were available for analysis. The patients had a mean age of 55.9 ± 16.0 years (range 17 to 92). A total of 92 masses (63.5%) were histologically confirmed by core needle biopsy or fine-needle aspiration; a further 16 lesions (11.0%) were followed up after 6 and 12 months, and in 37 lesions (25.5%), previous or additional diagnostic results were available that allowed a clear definition of the malignant or benign character of the mass. Finally, we analyzed 57 malignant and 88 benign lesions in our study.
ARFI VTTQ in normal breast tissue
We performed 290 measurements of SWV in the breast parenchyma as well as the adipose tissue adjacent to the 145 breast masses. A total of 93.2% of these measurements (n = 271) were successful and returned a numerical value for the SWV. In 19 instances, the measurement was invalid, and the system returned the result of X.XX m/s. These measurements were repeated, and all returned a value at the second attempt. The mean value for breast parenchyma was 3.65 ± 1.41 m/s. The mean value for breast adipose tissue was 3.05 ± 1.26 m/s. The difference in SWV between these two tissue types was statistically significant (P < 0.001) (Table 1).
Table 1.
Mean shear wave propagation velocity in normal breast tissues and the rate of successful measurements
| Number of measurements n | Shear wave velocity, m/s Mean ± SD (range) | P | Successful measurements at first attempt n (%) | |
|---|---|---|---|---|
| Breast parenchyma | 145 | 3.65 ± 1.41 (0.86–7.71) | <0.001 | 271 (93.2%) |
| Breast adipose tissue | 145 | 3.05 ± 1.26 (0.74–8.36) |
Abbreviation: SD, standard deviation.
ARFI VTTQ in breast masses
When measuring the SWV in the 145 breast masses, 34.5% of the measurements were successful at the first attempt, whereas 95 measurements returned the result X.XX m/s at first attempt (Table 2). Therefore, the failure rate in breast lesions was significantly higher than the failure rate in normal breast tissue (P < 0.001). Unsuccessful measurements were repeated two more times. In 17 of the 95 cases of invalid result, repeated measurements yielded successful values for SWV; however, we could not assess the SWV at all in 78 breast masses, and 50 of the 78 cases were malignant. In these cases, the result X.XX m/s was replaced by a value of 9.10 m/s (Figure 7).
Table 2.
Mean shear wave propagation velocity in various benign and malignant breast masses and the rate of successful measurements
| Number of masses n (%) | Successful measurements at first attempt n (%) | Successful measurement in any of 3 attempts n (%) | Shear wave velocity, m/s Mean ± SD (range) | |
|---|---|---|---|---|
| Malignant breast lesions | 57 (39.3%) | 2 (3.5%) | 7 (8.8%) | 8.38 ± 1.99 (1.74–9.10) |
| 73.7% invasive ductal | ||||
| 15.8% invasive lobular | ||||
| 5.3% other invasive | ||||
| 5.3% DCIS | ||||
| Fibroadenoma | 21 (14.5%) | 17 (81.0%) | 18 (85.6%) | 4.31 ± 2.45 (2.01–9.10) |
| Cyst | 23 (15.9%) | 8 (34.8%) | 13 (56.5%) | 5.73 ± 3.39 (0.54–9.10) |
| Scar | 10 (6.9%) | 4 (40.0%) | 5 (50.0%) | 6.70 ± 3.04 (2.31–9.10) |
| Fibrosis | 17 (11.7%) | 8 (47.1%) | 14 (82.4%) | 5.00 ± 2.47 (2.76–9.10) |
| Intramammary lymph node | 1 (0.7%) | 1 (100%) | 1 (100%) | 2.87 |
| Hematoma | 2 (1.4%) | 2 (100%) | 2 (100%) | 2.79 ± 1.53 (1.71–3.87) |
| Benign phyllodes tumor | 1 (0.7%) | 0 (0%) | 0 (0%) | >9.10a |
| Papilloma | 6 (4.1%) | 4 (66.7%) | 4 (66.7%) | 5.84 ± 2.78 (2.87–9.10) |
| Other benign lesions | 7 (4.8%) | 3 (42.9%) | 3 (42.9%) | 6.82 ± 3.33 (1.62–9.10) |
| Total benign breast lesions | 88 (60.7%) | 48 (54.6%) | 60 (68.2%) | 5.39 ± 2.95 (0.54–9.10) |
| Total lesions | 145 (100%) | 50 (34.5%) | 67 (46.2%) | 6.56 ± 2.99 (0.54–9.10) |
Notes:
As the phyllodes tumor displayed X.XX in repeated measurements, we presumed that the SWV was above the upper limit of possible measurement.
Abbreviations: DCIS, ductal carcinoma in situ; SD, standard deviation; SWV, shear wave velocity.
Figure 7.
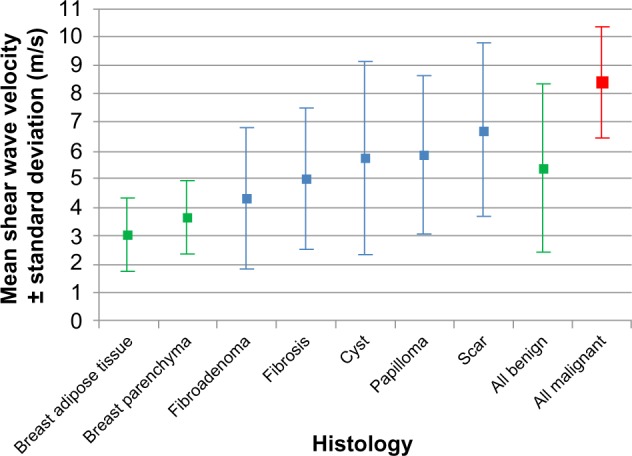
The mean shear wave velocity in breast cancer and various benign breast lesions.
Abbreviations: ARFI, acoustic radiation force impulse imaging; VTTQ, Virtual Touch™ tissue quantification.
The mean SWV in the malignant breast masses was 8.38 ± 1.99 m/s, while the mean SWV for the benign masses was 5.39 ± 2.95 m/s (P < 0.001). The best diagnostic accuracy (75.9%) was achieved when the cutoff point for malignancy was set to ≥9.10 m/s. This implies that the SWV was regarded as suspicious when the upper limit of possible measurement was exceeded and the machine returned the value of X.XX m/s. This cutoff point yielded a sensitivity of 87.7% and a specificity of 68.2%.
In fibroadenoma, breast fibrosis, and scar tissues, the mean SWVs were 4.31, 5.00, and 6.70 m/s, respectively, which was significantly faster compared with the SWVs measured in breast adipose tissue (P < 0.001). The mean SWV in breast fibrosis and scar tissue was also significantly faster compared with that of breast parenchyma (P < 0.001), but there was only a trend concerning the difference between fibroadenoma and breast parenchyma (P = 0.074).
In cystic lesions, 56.5% of measurements were successful, and the mean SWV was 5.73 m/s. In breast papilloma, four of six measurements were successful, and the mean SWV was 5.84 m/s.
Other histologic types of benign masses (intramammary lymph nodes, hematoma, and others) only represented a small number of cases in our collective. The results are shown in Table 2 and Figure 8.
Figure 8.
Algorithmic approach to interpreting ARFI VTTQ. With successful measurements of shear wave velocity, the probability of malignancy decreases, while unsuccessful measurements that exceed the upper limit of possible measurement increase the risk of malignancy.
Abbreviations: ARFI, acoustic radiation force impulse imaging; VTTQ, Virtual Touch™ tissue quantification.
Discussion
ARFI VTTQ in normal breast tissues and breast masses
The results of the current study on 129 patients with 145 breast masses demonstrated that the mean SWVs for breast parenchyma and adipose tissue were 3.65 ± 1.41 m/s and 3.05 ± 1.26 m/s, respectively, which were significantly different (P < 0.001). However, when using ARFI VTTQ for the characterization of breast masses, our study showed that only 3.5% of the malignant masses and 54.5% of the benign masses revealed successful measurement of SWV at the first attempt, and even repeated measurement usually returned the value X.XX m/s.
Bai et al reported the SWV of 102 benign lesions and 41 carcinomas.15 They found a failure rate of 63.4% for malignant lesions. Bai et al postulated that a result of X.XX m/s indicates that the SWV is too fast and exceeds the upper limit of the possible measurement (9.10 m/s). Therefore, the authors replaced X.XX m/s by a value of 9.10 m/s, and in this way, the SWVs of the malignant masses were represented by a range of values from 1.17 to 9.10 m/s (mean = 5.96 ± 2.96 m/s), which was significantly higher than the SWV in the benign masses (mean = 2.25 ± 0.59 m/s) (P < 0.001).
We support the idea that X.XX m/s indicates that SWV is above the upper limit of possible measurement (≥9.10 m/s). The probability of a technical failure in ARFI VTTQ measurement seems to be low, as in normal breast tissue, the success rate was higher than 93% and a repeated measurement always returned a valid result. Therefore, we estimate that the rate of technical failure in acquiring the SWV with ARFI VTTQ is less than 7%. Consequently, only a small part of the X.XX m/s measurements in breast masses can be considered to be due to technical failure, and the most reasonable explanation for the result X.XX m/s actually is an increased SWV above 9.10 m/s, in most of the cases.
Applying this approach, we found a mean SWV for the malignant and benign masses of 8.38 ± 1.99 m/s and 5.39 ± 2.95 m/s, respectively (P < 0.001).
The difference between breast adipose tissue (3.05 m/s) and breast parenchyma (3.65 m/s) was congruent with that found in previous studies performed by the authors16 (which showed an SWV of 2.90 m/s in adipose tissue and 3.33 m/s in parenchyma, respectively) as well as by Tozaki et al17 (where the SWV was 2.66 m/s in adipose tissue and 3.03 m/s in parenchyma, respectively). This finding demonstrates that ARFI VTTQ is a reliable and accurate method to explore normal breast tissue. Normal breast tissue may serve as a reference standard when exploring breast lesions, as previously described for strain-based elastography.18 We would advocate future research focusing on the effect of age-dependent or menstrual-cycle dependent changes on the SWV of breast parenchyma.19
Other authors have previously described SWVs of various breast masses. In 2008, Tanter et al published initial clinical results using shear wave imaging. They exemplarily calculated SWV based on single measurements in breast fatty tissue (1.7 m/s), breast parenchyma (3.1 m/s and 3.2 m/s), and invasive ductal carcinoma (6.6 m/s), which resembles our results (Figure 8).20
Tozaki et al investigated 30 mass lesions of the breast (13 benign and 17 malignant).17 They noticed that the mean SWV of the malignant lesions was significantly higher than that of benign lesions (4.49 versus 2.68 m/s) (P < 0.01), which is partly congruent with our results. However, we found higher SWVs, which can be explained, as we obviously used a different approach to perform the measurements. Tozaki et al performed two measurements in each lesion: the “internal” value assessed SWV in the center of the lesion, and the “marginal” value assessed the SWV at the margin of the lesion. When measuring the internal value, Tozaki et al experienced a failure (indicated as X.XX m/s) rate of 82.4%, which matches our results. Furthermore, the failure rate for the measurement of the marginal value was 25.5%. The significant differences between the benign and malignant lesions in their study were based on the marginal values. In our study, we determined the internal value and experienced a higher failure rate, indicating an elevated SWV. However, we did not collect data concerning the external values, mainly, because we consider definition and localization of the center of the lesion to be more feasible than the exact localization of the margin of the lesion.
Jin et al reported the SWV of 56 malignant and 66 benign breast masses categorized as Breast Imaging Reporting and Data System® (BI-RADS) category 4 in B-mode ultrasound.21 The authors calculated the SWV ratio of the mass and the surrounding parenchyma and concluded that the mean SWV ratio of benign lesions (2.44 ± 1.27) was lower than that of malignant lesions (5.74 ± 1.68) (P < 0.001). Jin et al further reported an overall failure rate of 16.4% in benign and malignant masses, calculated as the rate of obtaining X.XX m/s on repeated attempts.
The event of an unsuccessful measurement does not only occur in breast lesions. Park et al published data about the use of ARFI VTTQ in 62 focal liver masses.22 The authors experienced ARFI VTTQ measurement failure in seven cases and excluded these cases from their analysis.
Considering our data and the reports in the literature, the most reasonable explanation for X.XX m/s may actually be the incidence of an elevated SWV above 9.10 m/s. Further technical developments of ARFI VTTQ that include a greater range of possible measurements would be favorable to explore this behavior of breast lesions further.
Recently, the investigators of the Breast Elastography 1 (BE1) study reported that in their collective, 142 of 289 (49.1%) malignancies had a maximum SWV of at least 7.7 m/s (180 kPa).23 Focusing on BI-RADS-ultrasound (US) category 3 lesions, they proposed a cutoff value of 7.3 m/s (160 kPa) to upgrade a lesion to biopsy. In our current study, the best cutoff point for malignancy was 9.10 m/s, as most of the malignant tumors exhibited extremely elevated SWVs (with sensitivity 87.7%, specificity 68.2%, and accuracy 75.9%). However, if we would apply a cutoff value of 7.3 m/s to our collective, we would achieve only slightly inferior results (sensitivity 87.7%, specificity 64.8%, and accuracy 73.8%).
ARFI VTTQ in cystic lesions
Pure liquid cysts cannot be assessed with ARFI VTTQ due to physical reasons, as fluids generally do not support shear stresses. However, we noted a relevant rate of cysts with a valid determination of SWV. This might be explained by the fact that the content of some cysts is not entirely liquid but may contain protein, blood, detritus, leucocytes, and other solid particles. This affects the physical properties of the cyst, and the push pulse may thus induce a shear wave that can then propagate through this type of cyst. This idea is supported by the observation that the two hematomas in our collective were measurable with ARFI VTTQ. Nevertheless, in a pure liquid environment, ARFI VTTQ is not applicable. This behavior may be helpful in the differential diagnosis.
Interpretation of “X.XX m/s” in ARFI VTTQ and prediction of malignancy
We assume that ARFI VTTQ regularly encounters limitations in tumor tissue. SWV is primarily influenced by the elasticity of the tissue, but resorption, reflection, and dispersion also play major roles when measuring the peaks of the wave. The pathologic features that accompany malignant growths (eg, neoplastic material, neoangiogenesis, necrosis, and inflammatory reactions) can be considered as the reason for this effect. Consequently, in deteriorated tumor tissue, the generation, propagation, and/or detection of the shear wave may be hindered to a major degree so that the machine indicates an unsuccessful measurement. However, if the measurement is infinitely repeated, a value will eventually be returned. Nevertheless, if elasticity is too high and the SWV exceeds the upper limit of possible measurement, the result X.XX m/s will persist.
According to our results, malignant breast tumors are characterized by continually showing the result of X.XX m/s in ARFI VTTQ (Figure 7).
Limitations of the method and limitations of the study
The main limitation of our study is that ARFI VTTQ is a relatively new technology. Therefore, limited data is available about the impact of the tumor size, the optimal measurement point within the lesion, the influence of the density of the surrounding tissue or the distance from the skin on the measurement, and the variance of SWV when repeatedly measuring the same region. Furthermore, precompression seems to have a significant effect on the measurements, and a major bias may result if different degrees of precompression are applied to the tissue.16,24
However, in our study, the same sonographer conducted all the measurements, using nearly the same degrees of pre-compression, although this variable was not standardized. Moreover, our study is limited by the fact that the sample size was relatively small. Larger studies including multiple observers would be favorable.
Finally, the authors would like to emphasize that the method of ARFI VTTQ is technically not fully developed, as measurements above 9.10 m/s cannot be performed. As shown by our results, SWV frequently exceeds this limit, especially in malignant masses. Therefore, our results concerning mean SWV are impaired by this limitation, and replacing X.XX m/s with 9.10 m/s gives only a rough approximation of the actual SWV, although this approach has been reported before.15 Further technical advances may overcome this limitation in the future.
Summary
Sonoelastography, as it is performed today, is to a certain degree, observer dependent, as it is based on image interpretation. The technique of ARFI VTTQ may have the potential to overcome this limitation, as it provides independent measurements of physical tissue properties. ARFI VTTQ is a feasible method that indicates malignant tissue with an elevated SWV or even, a SWV that exceeds the upper limit of possible measurement. In summary, our study demonstrated that ARFI VTTQ is able to differentiate between adipose tissue and breast parenchyma as well as between benign and malignant masses, by obtaining a SWV. Malignant breast tumors demonstrate a significantly higher rate of measurements that return a result of X.XX m/s, indicating a SWV above 9.10 m/s, compared with benign tumors. This cutoff value yields a sensitivity of 87.7% and a specificity of 68.2%. However, the performance is not superior to B-mode ultrasound (with sensitivity of 96% and specificity of 70%) as reported in the literature.4 Therefore, ARFI VTTQ should not be used as a single test but may be helpful as an adjunct to conventional B-mode ultrasound. For this purpose, we propose the event of a highly elevated SWV as a significant criterion for malignancy.
Figure 2.
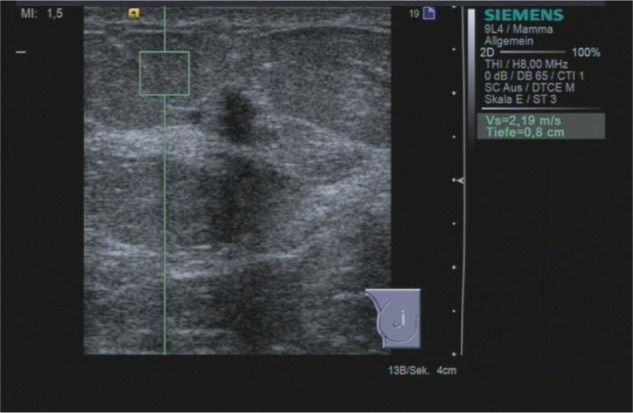
ARFI VTTQ of the adjacent adipose tissue. The shear wave velocity is 2.19 m/s.
Abbreviations: ARFI, acoustic radiation force impulse imaging; VTTQ, Virtual Touch™ tissue quantification.
Figure 5.
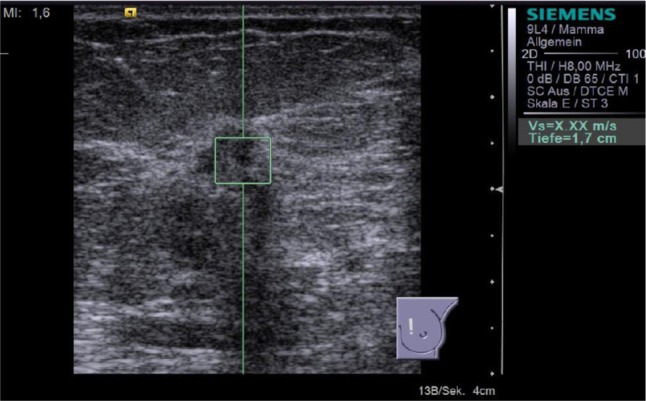
Result of the second attempt to perform ARFI VTTQ of the breast lesion from Figure 4. The measurement remained unsuccessful, and the system returned the result “X.XX m/s.”
Abbreviations: ARFI, acoustic radiation force impulse imaging; VTTQ, Virtual Touch™ tissue quantification.
Acknowledgments
Licenses for use of the Virtual Touch tissue imaging and Virtual Touch tissue quantification applications for the duration of the research study were received within the Virtual Touch Luminary Pioneer Program (Siemens Healthcare Sector).
Footnotes
Disclosure
The authors report no conflicts of interest in this work.
References
- 1.Wojcinski S, Farrokh A, Weber S, et al. Multicenter study of ultrasound real-time tissue elastography in 779 cases for the assessment of breast lesions: improved diagnostic performance by combining the BI-RADS®-US classification system with sonoelastography. Ultraschall Med. 2010;31(5):484–491. doi: 10.1055/s-0029-1245282. [DOI] [PubMed] [Google Scholar]
- 2.Thomas A, Degenhardt F, Farrokh A, Wojcinski S, Slowinski T, Fischer T. Significant differentiation of focal breast lesions: calculation of strain ratio in breast sonoelastography. Acad Radiol. 2010;17(5):558–563. doi: 10.1016/j.acra.2009.12.006. [DOI] [PubMed] [Google Scholar]
- 3.Sadigh G, Carlos RC, Neal CH, Dwamena BA. Accuracy of quantitative ultrasound elastography for differentiation of malignant and benign breast abnormalities: a meta-analysis. Breast Cancer Res Treat. 2012;134(3):923–931. doi: 10.1007/s10549-012-2020-x. [DOI] [PubMed] [Google Scholar]
- 4.Sadigh G, Carlos RC, Neal CH, Dwamena BA. Ultrasonographic differentiation of malignant from benign breast lesions: a meta-analytic comparison of elasticity and BIRADS scoring. Breast Cancer Res Treat. 2012;133(1):23–35. doi: 10.1007/s10549-011-1857-8. [DOI] [PubMed] [Google Scholar]
- 5.Sadigh G, Carlos RC, Neal CH, Wojcinski S, Dwamena BA. Impact of breast mass size on accuracy of ultrasound elastography vs conventional B-mode ultrasound: a meta-analysis of individual participants. Eur Radiol. 2013;23(4):1006–1014. doi: 10.1007/s00330-012-2682-0. [DOI] [PubMed] [Google Scholar]
- 6.Itoh A, Ueno E, Tohno E, et al. Breast disease: clinical application of US elastography for diagnosis. Radiology. 2006;239(2):341–350. doi: 10.1148/radiol.2391041676. [DOI] [PubMed] [Google Scholar]
- 7.Ueno E, Tohno E, Soeda S, et al. Dynamic tests in real-time breast echography. Ultrasound Med Biol. 1988;14(Suppl 1):S53–S57. doi: 10.1016/0301-5629(88)90047-6. [DOI] [PubMed] [Google Scholar]
- 8.Wells PN, Liang HD. Medical ultrasound: imaging of soft tissue strain and elasticity. J R Soc Interface. 2011;8(64):1521–1549. doi: 10.1098/rsif.2011.0054. [DOI] [PMC free article] [PubMed] [Google Scholar]
- 9.Sarvazyan AP, Rudenko OV, Swanson SD, Fowlkes JB, Emelianov SY. Shear wave elasticity imaging: a new ultrasonic technology of medical diagnostics. Ultrasound Med Biol. 1998;24(9):1419–1435. doi: 10.1016/s0301-5629(98)00110-0. [DOI] [PubMed] [Google Scholar]
- 10.Fierbinteanu-Braticevici C, Andronescu D, Usvat R, Cretoiu D, Baicus C, Marinoschi G. Acoustic radiation force imaging sonoelastography for noninvasive staging of liver fibrosis. World J Gastroenterol. 2009;15(44):5525–5532. doi: 10.3748/wjg.15.5525. [DOI] [PMC free article] [PubMed] [Google Scholar]
- 11.Friedrich-Rust M, Nierhoff J, Lupsor M, et al. Performance of Acoustic Radiation Force Impulse imaging for the staging of liver fibrosis: a pooled meta-analysis. J Viral Hepat. 2012;19(2):e212–e219. doi: 10.1111/j.1365-2893.2011.01537.x. [DOI] [PubMed] [Google Scholar]
- 12.Bamber J, Cosgrove D, Dietrich CF, et al. EFSUMB guidelines and recommendations on the clinical use of ultrasound elastography. Part 1: Basic principles and technology. Ultraschall Med. 2013;34(2):169–184. doi: 10.1055/s-0033-1335205. [DOI] [PubMed] [Google Scholar]
- 13.Cosgrove D, Piscaglia F, Bamber J, et al. EFSUMB guidelines and recommendations on the clinical use of ultrasound elastography. Part 2: Clinical applications. Ultraschall Med. 2013;34(3):238–253. doi: 10.1055/s-0033-1335375. [DOI] [PubMed] [Google Scholar]
- 14.degum.de [homepage on the Internet] Mehrstufenkonzept mammasonographie. [Requirements for certification in breast ultrasound] Deutsche Gesellschaft für Ultraschall in der Medizin; 2013[updated August 5, 2013; cited May 22, 2013]. Available from: http://www.degum.de/Mehrstufenkonzept_Mammasonogra.634.0.htmlAccessed August 5, 2013German [Google Scholar]
- 15.Bai M, Du L, Gu J, Li F, Jia X. Virtual touch tissue quantification using acoustic radiation force impulse technology: initial clinical experience with solid breast masses. J Ultrasound Med. 2012;31(2):289–294. doi: 10.7863/jum.2012.31.2.289. [DOI] [PubMed] [Google Scholar]
- 16.Wojcinski S, Brandhorst K, Sadigh G, Hillemanns P, Degenhardt F. Acoustic radiation force impulse imaging with virtual touch tissue quantification: measurements of normal breast tissue and dependence on the degree of pre-compression. Ultrasound Med Biol. :2013. doi: 10.1016/j.ultrasmedbio.2013.06.014. [DOI] [PubMed] [Google Scholar]
- 17.Tozaki M, Isobe S, Fukuma E. Preliminary study of ultrasonographic tissue quantification of the breast using the acoustic radiation force impulse (ARFI) technology. Eur J Radiol. 2011;80(2):e182–e187. doi: 10.1016/j.ejrad.2011.05.020. [DOI] [PubMed] [Google Scholar]
- 18.Farrokh A, Wojcinski S, Degenhardt F. Diagnostic value of strain ratio measurement in the differentiation of malignant and benign breast lesions. Ultraschall Med. 2011;32(4):400–405. doi: 10.1055/s-0029-1245335. German. [DOI] [PubMed] [Google Scholar]
- 19.Wojcinski S, Cassel M, Farrokh A, et al. Variations in the Elasticity of Breast Tissue During the Menstrual Cycle Determined by Real-time Sonoelastography. J Ultrasound Med. 2012;31(1):63–72. doi: 10.7863/jum.2012.31.1.63. [DOI] [PubMed] [Google Scholar]
- 20.Tanter M, Bercoff J, Athanasiou A, et al. Quantitative assessment of breast lesion viscoelasticity: initial clinical results using supersonic shear imaging. Ultrasound Med Biol. 2008;34(9):1373–1386. doi: 10.1016/j.ultrasmedbio.2008.02.002. [DOI] [PubMed] [Google Scholar]
- 21.Jin ZQ, Li XR, Zhou HL, et al. Acoustic radiation force impulse elastography of breast imaging reporting and data system category 4 breast lesions. Clin Breast Cancer. 2012;12(6):420–427. doi: 10.1016/j.clbc.2012.07.007. [DOI] [PubMed] [Google Scholar]
- 22.Park H, Park JY, Kim do Y, et al. Characterization of focal liver masses using acoustic radiation force impulse elastography. World J Gastroenterol. 2013;19(2):219–226. doi: 10.3748/wjg.v19.i2.219. [DOI] [PMC free article] [PubMed] [Google Scholar]
- 23.Berg WA, Cosgrove DO, Doré CJ, et al. BE1 Investigators Shear-wave elastography improves the specificity of breast US: the BE1 multinational study of 939 masses. Radiology. 2012;262(2):435–449. doi: 10.1148/radiol.11110640. [DOI] [PubMed] [Google Scholar]
- 24.Barr RG, Zhang Z. Effects of precompression on elasticity imaging of the breast: development of a clinically useful semiquantitative method of precompression assessment. J Ultrasound Med. 2012;31(6):895–902. doi: 10.7863/jum.2012.31.6.895. [DOI] [PubMed] [Google Scholar]


