Abstract
The power of nuclear magnetic resonance spectroscopy derives from its site-specific access to chemical, structural and dynamic information. However, the corresponding multiplicity of interactions can be difficult to tease apart. Complimentary approaches involve spectral editing on the one hand and selective isotope substitution on the other. Here we present a new “redox” approach to the latter: acetate is chosen as the sole carbon source for the extreme oxidation numbers of its two carbons. Consistent with conventional anabolic pathways for the amino acids, [1-13C] acetate does not label α carbons, labels other aliphatic carbons and the aromatic carbons very selectively, and labels the carboxyl carbons heavily. The benefits of this labeling scheme are exemplified by magic angle spinning spectra of microcrystalline immunoglobulin binding protein G (GB1): the elimination of most J-couplings and one- and two-bond dipolar couplings provides narrow signals and long-range, intra- and inter-residue, recoupling essential for distance constraints. Inverse redox labeling, from [2-13C] acetate, is also expected to be useful: although it retains one-bond couplings in the sidechains, the removal of CA-CO coupling in the backbone should improve the resolution of NCACX spectra.
Keywords: isotope substitution, sparse labeling, MAS NMR structure determination, dipolar truncation, isotope labeled peptone, 13C-acetate
Introduction
The interactions between nuclear spins are important sources of information in nuclear magnetic resonance (NMR) spectroscopy. However, dense networks of nuclear spins can obscure that information via line broadening, spectral overlap, and truncation of polarization transfers between weakly coupled spins, especially in solid state NMR. These countervailing considerations have motivated and informed different isotope substitution schemes. In magic angle spinning (MAS) NMR, uniform 13C and 15N labeling has been widely used for resonance assignments and structure determination. At the same time, non-uniform labeling has shown great potential to extend these experiments to larger systems. Approaches have included the use of reverse (12C) labeling of specific amino acids (Shi et al. 2009; Etzkorn et al. 2007), specific (or ‘forward’) labeling of selected amino acids (Hiller et al. 2008), labeling from [2-13C] or [1,3-13C] glycerol (Hong 1999; LeMaster and Kushlan 1996; Sperling et al. 2010; Bayro et al. 2010; Higman et al. 2009), and labeling from [1-13C] or [2-13C] glucose (Lundstrom et al. 2007; Loquet et al. 2011). Glycerol labeling has proved useful in determining the structures of monomeric proteins (Nieuwkoop et al. 2009; Castellani et al. 2003; Castellani et al. 2002), while the determination of multimeric protein structures has been facilitated by heterogeneous labeling via glycerol (Nieuwkoop and Rienstra 2010; Bayro et al. 2011; Debelouchina et al. 2010) or glucose (Loquet et al. 2010; Lv et al. 2012; Loquet et al. 2012).
While current non-uniform labeling schemes have been useful for removing one-bond scalar and dipolar couplings, two-bond couplings remain and interfere with quantitative measurements of long-range (4–5 Å or greater) homonuclear 13C distances via dipolar truncation (Bayro et al. 2009; Costa 1996), in which more strongly coupled spins significantly attenuate polarization transfer among weakly coupled sites for most zero quantum (ZQ) and double quantum (DQ) recoupling methods. Thus, more dilute labeling, to further attenuate dipolar truncation, is required to improve recoupling transfer efficiencies and allow quantitative measurement of longer homonuclear distances. A previous study by McDermott and coworkers (Goldbourt et al. 2007) showed that [1-13C] glucose in Pseudomonas aeruginosa K could selectively label carbonyl sites via the Entner-Doudoroff pathway However, almost no sidechain sites were labeled in this scheme, limiting the application of broadband recoupling techniques to measure structurally important distance constraints.
Here we present a new non-uniform labeling scheme that uses acetate as the carbon source. With two carbons in highly divergent oxidation states, acetate entering the tricarboxylic acid cycle eventually deposits its carboxyl carbon in the carboxyl group of almost all amino acids and at single sidechain sites for a majority of amino acids. As a result of this pattern, which we call “redox labeling”, many of the remaining homonuclear dipolar couplings, including backbone-to-sidechain and sidechain-to-sidechain couplings, are of similar magnitude. This significantly reduces dipolar truncation compared to other non-uniform labeling schemes and permits long range contacts to be measured simultaneously in a broadband recoupling experiment.
Since few organisms can survive on acetate as the sole carbon source, our labeling protocol involves preparing a labeled peptone (i.e., whole cell hydrolysate) from an organism that can, and feeding that peptone to cells expressing the protein of interest. To prepare the peptone from acetate, we have tried both Escherichia coli NCM 533 and Pseudomonas mendocina Palleroni. Since the distribution of acetate label is more sharply defined in the Pseudomonas derived peptone, we present only that procedure. To illustrate the benefits of the labeling scheme in MAS NMR of proteins, we present spectra of the beta 1 domain from immunoglobulin binding protein G (GB1) expressed in E. coli BL21(DE3) cells grown on the Pseudomonas derived peptone.
Materials & Methods
Preparation of Redox-Labeled Peptone
Lyophilized Pseudomonas mendocina Palleroni (ATCC 25411) bacteria were revived in nutrient broth (Difco), and grown on “standard media” (Stanier et al. 1966) with sodium acetate as the sole carbon source (natural abundance control) or with acetate replaced by [1-13C] acetate (Cambridge Isotope Labs, Andover MA). The bacteria were collected and lyophilized for weighing. For hydrolysis, the cells were resuspended in 6 M HCl, deaerated by bubbling with nitrogen or argon, and incubated at 70°C for three days. Excess HCl was subsequently removed by repeated vacuum distillation.
Preparation of Redox-Labeled Amino Acids for Analysis of Isotope Incorporation
Collected P. mendocina were resuspended in pH 7.4, 20mM Tris, 100mM NaCl buffer and lysed by sonication. The lysate was centrifuged at 9000 g to separate cytosolic protein from other cell components. The cytosolic protein was precipitated from the supernatant by adding (slowly on ice) saturated ammonium sulfate up to 75% (Jakoby 1971). The precipitated protein was collected by centrifugation at 9000 g for 15 minutes and dialyzed against pH 7.4 buffer, using SpectaPor7 membrane (MWCO 3500). The protein concentration was determined colorimetrically (Quick Start Bradford protein assay, BioRad). The suspension was mixed with an equal volume of 12 M HCl, deaerated by replacing air with argon in several freeze-thaw degassing cycles, and hydrolyzed overnight at 110°C. After most of the HCl was removed by repeated lyophilization and resuspension in H2O (or D2O), the pH was adjusted to neutral with NaOH (or NaOD).
MS/MS Analysis of Redox-Labeled Amino Acids
Arrays of LC-ESI-MS/MS spectra were run for both the labeled and control peptones, using a Finigan LCQ ion trap and Agilent HPLC. Reverse phase HPLC of the amino acids was conducted with the volatile ion paring agent, perfluoroheptanoic acid (PFHA) added to the mobile phase to improve the separation (Petritis et al. 2000; Qu et al. 2002a; Qu et al. 2002b). Chromatography was carried out over 35 minutes, at 40°C, on a Luna C18 (Phenominex) 4.6 mm × 150 mm column, with particle size 3 μm, with an injection volume of 100 μl and a flow rate of 1 ml/min. The mobile phase solvents were 0.8mM PFHA and 0.005% TFA in water (solvent A), and acetonitrile (solvent B). The proportion of solvent A was maintained at 100% for the first 6 minutes, reduced to 76% over the following 8 minutes, maintained at 76% for the next 7 minutes, decreased to 40% over the following 6 minutes, and maintained at 40% to the end of the run. The LC effluent was split 10:1 before the interface. The collision energy was maintained at 30 ev. All spectra were taken in positive ion mode.
NMR Analysis of Redox-Labeled Amino Acids
One-dimensional 13C NMR spectra in D2O were taken on a Varian Inova 400 MHz spectrometer.
Two-dimensional spectra were acquired at 600 MHz 1H Larmor frequency on a custom-built spectrometer (D. J. Ruben). Double quantum filtered COSY spectra were acquired with 8 kHz spectral width in each dimension, using 2048 and 4096 data points in the F1 and F2 dimensions, respectively. HSQC spectra were acquired with 12 kHz and 6 kHz spectral widths in the F1 and F2 dimensions, respectively, using 1024 data points in each dimension. The spectra were inspected using Sparky (T. D. Goddard and D. G. Kneller and University of California), and 1H chemical shifts were compared with 13C chemical shifts from HSQC, leading to assignment of amino acid type. Intensities of cross peaks and their satellites were obtained by line fitting, and estimates of the degree of 13C labeling were calculated as the fraction between the sum of the satellites and the cross peak intensity for the 1H bound to the site of 13C labeling. COSY cross peaks with intense satellites were in general correlated with very intense HSQC signals.
Preparation of GB1 Samples
The T2Q construct of the beta 1 domain from immunoglobulin binding protein G (GB1) was transformed into E. coli BL21(DE3) competent cells (Invitrogen Corp.). These cells were grow in M9 media with 1 g 15N ammonium chloride (Cambridge Isotope Labs) per liter as the sole nitrogen source, and either redox-labeled peptone prepared from 4 g of dried Pseudomonas or 3 g of [U-13C] glucose (Cambridge Isotope Labs) per liter as the sole carbon source, to obtain [redox-13C,U-15N] GB1 or [U-13C,15N] GB1, respectively. The doubling times in the media containing peptone were very similar to doubling times in Luria broth, as expected for complex media.
Microcrystalline samples of GB1 were prepared according to previously published protocols (Franks et al. 2005; Schmidt et al. 2007). The soluble fraction released from cells by sonication was heated at 80°C for 5 minutes, cooled on ice for 15 minutes, and then separated on a size exclusion column. Fractions containing GB1 were pooled and extensively dialyzed against 50 mM sodium phosphate, pH 5.5, prior to forming microcrystals. To reduce intermolecular contacts, redox-labeled GB1 was diluted with natural abundance GB1 at a molar ratio of 1:3 and spectra were obtained from ~40 mg GB1, containing 10 mg of redox-labeled GB1. In the case of [U-13C,15N] GB1, spectra were obtained from a ~25 mg sample.
MAS NMR Studies of GB1
All MAS NMR data were acquired on a Bruker 800 MHz Avance III spectrometer running Topspin 3.1. Each sample was centrifuged into a separate Bruker 3.2 mm rotor, and the drive tips were sealed with epoxy to ensure the samples remained hydrated.
2D 13C-13C RFDR (Bennett et al. 1998) correlation experiments were acquired at 18.0 kHz MAS frequency. RFDR transfers employed 83 kHz 13C π-pulses and 105 kHz 1H CW decoupling with the 13C RF carrier set to 100 ppm. RFDR transfers were optimized in 1D experiments by varying the decoupling field strength from 90 to 110 kHz in order to minimize interference with the 1H decoupling (Bayro et al. 2008). 83 kHz TPPM (Bennett et al. 1995) 1H decoupling was employed during the evolution and acquisition periods, with a 5.8 s pulse length and relative phases of 0° and 20°. 2048 points were acquired in t2 and 512 × 18 μs (total evolution time 20 ms) were acquired in t1 with 8 scans per point and a recycle delay of 2 seconds for a total acquisition time of approximately 10 hours per 2D experiment.
2D 15N-13C ZF-TEDOR (Jaroniec et al. 2002; Hing et al. 1992) experiments were acquired at 18.0 kHz MAS frequency. During the TEDOR recoupling period 45 kHz 15N π-pulses were employed with 83 kHz CW 1H decoupling. 83 kHz TPPM 1H decoupling was also employed during the evolution and acquisition periods with 5.8 s pulse length and relative phases of 0° and 20°.
nmrPipe (Delaglio et al. 1995) and Sparky (T. D. Goddard and D. G. Kneller and University of California) were used to process data and generate figures, respectively. The same processing and display parameters were used for comparing spectra between redox and uniformly labeled GB1. Processing details are given in each figure caption.
Results
Peptone Analysis
Figure 1 shows the pattern of sidechain labeling from [1-13C] acetate that is expected from established anabolic pathways. In addition, the backbone carbonyl is expected to be labeled in all the amino acids except histidine. Contiguous labeling is expected only in the aromatics that incorporate erythrose and ribose, as these sugars are serially labeled in the pentose phosphate pathway (from glyceraldehyde 3-phosphate and fructose 6-phosphate labeled in gluconeogenesis).
Figure 1.
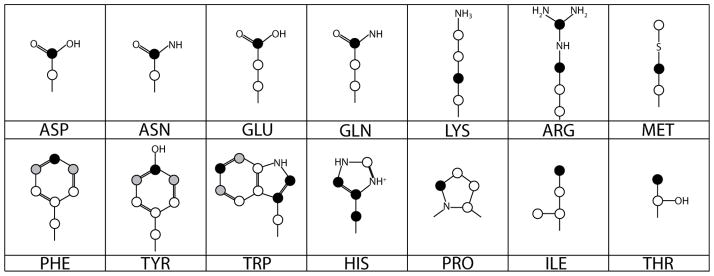
Diagram of the expected side chain distribution of 13C from [1-13C] acetate. Black circles identify heavily labeled sites and gray circles identify sites that are labeled more lightly because symmetric carbons of 3-dehydroquinate can arise equally from labeled and unlabeled carbons of erythrose 4-phosphate in the shikimate pathway.
Comparison of the 1D 13C NMR spectrum of redox-labeled amino acids with that of the natural abundance control showed the expected labeling pattern: the α carbons (42 ppm for glycine and 51–61 ppm otherwise) are not labeled, the other aliphatic carbons (12 – 41 ppm) and the aromatic carbons (108 – 156 ppm) are selectively labeled, and the carboxyl carbons (shifted to 166–178 ppm due to the low pH of the solution) are heavily labeled.
As shown in Table 1, the MS and MS/MS data report the number of carbon atoms labeled in individual amino acids, and for some amino acids the exact location of the label. We were able to separate and analyze most amino acids. Analysis of glycine was not possible due to very high solvent background in the vicinity of 80 m/z. This problem was also reported by Petritis et al. (Petritis et al. 2000). We were also unable to obtain MS/MS data for cysteine, tryptophan and histidine due to small MS peaks. Tryptophan is partially destroyed during acid hydrolysis.
Table 1.
Analysis of [redox-13C] labeled peptone. LC-ESI-MS/MS results (left) are compared with NMR results (right) and the labeling pattern expected from typical anabolic pathways. “++” indicates the most intense peak in the MS/MS spectra. Lower case letters in the atom labels indicate expectation of lighter labeling because symmetric carbons of 3-dehydroquinate can arise equally from labeled and unlabeled carbons of erythrose 4-phosphate in the shikimate pathway.
| Amino acid (MS)/fragment (MS2) | Control M/Z | Labeled Mass Increment
|
Labels expected | COSY result | ||||
|---|---|---|---|---|---|---|---|---|
| +0 | +1 | +2 | +3 | +4 | ||||
|
| ||||||||
| Ala | 90 | + | ++ | C | ||||
| – HCOOH | 44 | ++ | ||||||
|
| ||||||||
| Arg | 175 | + | ++ | + | C, CD, CZ | |||
| – NH3 | 158 | + | ++ | + | C,CD,CZ | |||
| – COOH | 130 | − | ++ | + | CD,CZ | |||
| – (NH)C(NH2)2 | 116 | − | + | ++ | C,CD | |||
| – HCOOH, (NH)C(NH2)2 | 70 | ++ | CD | 80% | ||||
| C(NH2)3 | 60 | + | + | CZ | ||||
|
| ||||||||
| Asp | 134 | ++ | + | C,CG | ||||
| – H2O | 116 | − | ++ | + | C,CG | |||
| – HCOOH | 88 | + | ++ | CG | ||||
|
| ||||||||
| Cys | C | |||||||
|
| ||||||||
| Gly | C | |||||||
|
| ||||||||
| Glu | 148 | + | ++ | C,CD | ||||
| – H2O | 130 | + | ++ | C,CD | ||||
| – HCOOH | 102 | − | ++ | CD | ||||
| – HCOOH, H2O | 84 | ++ | CD | |||||
|
| ||||||||
| His | 156 | + | ++ | + | CB,CG,CD2 | |||
|
| ||||||||
| Ile | 132 | − | ++ | + | C,CD | |||
| – HCOOH | 86 | + | ++ | CD | 62% | |||
|
| ||||||||
| Leu | 132 | ++ | − | C | ||||
| – HCOOH | 86 | ++ | − | --- | ||||
|
| ||||||||
| Lys | 147 | + | ++ | + | C,CG | |||
| – NH3 | 130 | + | ++ | + | C,CG | |||
| – NH3, HCOOH | 84 | + | ++ | CG | ~60% | |||
|
| ||||||||
| Met | 150 | − | ++ | + | C,CG | |||
| – NH3 | 133 | − | ++ | + | C,CG | |||
| – HCOOH | 104 | + | + | CG | 63% | |||
|
| ||||||||
| Phe | 166 | + | + | ++ | + | C,CZ,Ce1,Ce2 | ||
| – HCOOH | 120 | + | ++ | + | CZ,Ce1,Ce2 | |||
|
| ||||||||
| Pro | 116 | + | ++ | C,CD | ||||
| – HCOOH | 70 | − | ++ | − | CD | ~99% | ||
|
| ||||||||
| Ser | 106 | + | ++ | C | ||||
| – H2O | 88 | + | ++ | C | ||||
| – HCOOH | 60 | ++ | --- | |||||
|
| ||||||||
| Thr | 120 | − | ++ | + | C,CG | |||
| – H2O | 102 | − | ++ | + | C,CG | |||
| – H2O, H2O | 84 | − | ++ | + | C,CG | |||
| – HCOOH | 74 | + | ++ | CG | 67% | |||
| – HCOOH, H2O | 56 | ++ | CG | 67% | ||||
|
| ||||||||
| Trp | 205 | + | + | + | ++ | + | C,CG,CD1,CH2, Cz2,Cz3 | |
|
| ||||||||
| Tyr | 182 | + | + | ++ | + | C,CZ,Ce1,Ce2 | ||
| – NH3 | 165 | + | + | ++ | + | C,CZ,Ce1,Ce2 | ||
| – H2O, H2O | 146 | − | − | ++ | + | − | C,CZ,Ce1,Ce2 | |
| – HCOOH | 136 | + | ++ | + | CZ,Ce1,Ce2 | |||
|
| ||||||||
| Val | 118 | + | ++ | C | ||||
| – HCOOH | 72 | ++ | --- | |||||
For most of the amino acids, the most common product of collisionally activated dissociation was (M + H − 46)+, which corresponds to the neutral loss of a formic acid by a rearrangement (Qu et al. 2002b). In each case, the data in Table 1 show that the remaining (–HCOOH) fragment has a lower distribution of masses than the intact amino acid. This indicates that the carboxyl group is labeled in most of the amino acids.
For some amino acids, only one site is labeled (mass increment = +1) and that is the carboxyl group. For example, the MS spectrum of valine (Figure 2) shows peaks at m/z 118.0 and 119.0 (vs. 118 alone in the control). The relative intensities suggest that a little more than half of the valines are singly labeled, and the rest are unlabeled. Since the mass of the –HCOOH fragment in the MS/MS spectrum is the same for the labeled valine and the control (m/z=72), only the cleaved carboxyl group was labeled. Similarly, alanine, leucine and serine are labeled only in the carboxyl group. Whereas the labeling of the carboxyl is nearly complete in leucine, the comparative peak intensities for alanine (m/z=91, m/z=90) indicate that the labeling there is about two thirds.
Figure 2.
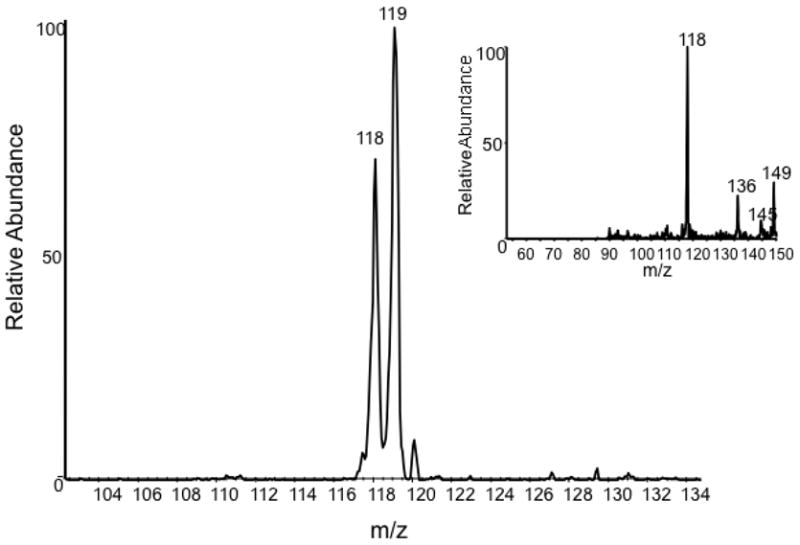
The MS spectrum of valine obtained by [redox-13C] labeling compared, in the inset, to the natural abundance result.
Other amino acids are more extensively labeled. Aspartic acid is labeled in up to two sites (although mostly singly labeled) and MS/MS shows that one or two carboxyl groups are labeled. Glutamic acid labeling is very similar to aspartic acid, except that most of the residues are doubly labeled. Isoleucine, lysine, methionine, proline and threonine are also labeled in up two sites (including the carboxyl). For the protonated carbons, analysis of COSY intensities (also shown in Table 1) indicates 62% labeling of CD1 in isoleucine, 60% labeling of CG in lysine, 63% labeling of CG in methionine, ~99% labeling of CD in proline, and 67% labeling of CG in threonine.
Arginine, phenylalanine and tyrosine are labeled at up to three sites, including the carboxyl. In arginine, the fragment masses show that the guanido group (CZ) is labeled and COSY shows that CD is 80% labeled. In phenylalanine, the MS3 fragment resulting from removal of the carboxyl group and the benzyl group (m/z=44, not shown in the table) has no label, indicating that the ring has up to two labeled carbons. In histidine and tryptophan, the number of sites labeled was up to two and four, respectively. These are the only residues for which the observed extent of labeling is less than expected.
Magic Angle Spinning NMR of Microcrystalline GB1
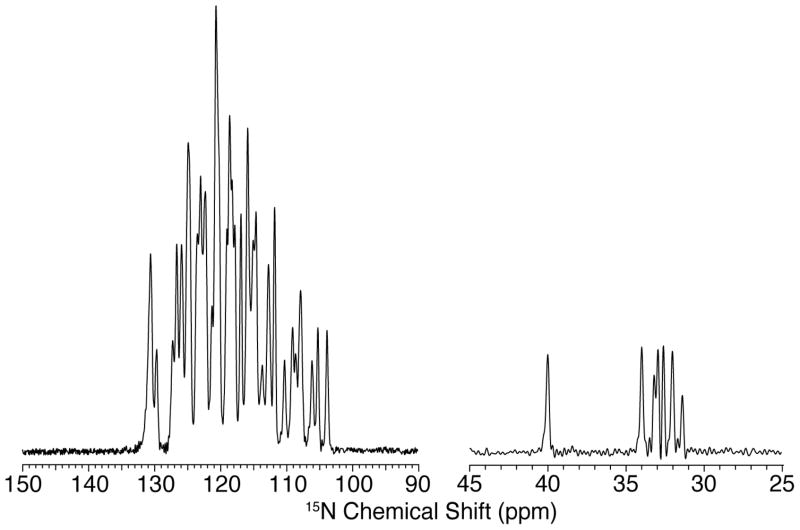
The 15N spectrum of redox-labeled GB1 is shown in Figure 3. The high resolution and the agreement of chemical shifts with previously published data, show that the redox-labeling protocol produced a homogenous sample consistent with previous studies (Franks et al. 2005).
Figure 3.
15N CP MAS spectrum of [U-15N, redox-13C] labeled microcrystalline GB1. The spectrum was obtained at 800 MHz 1H Larmor frequency with 18.0 kHz MAS and 81 kHz TPPM 1H decoupling; 1024 points were acquired with a 50 us dwell time for a total acquisition time of ~51 ms.
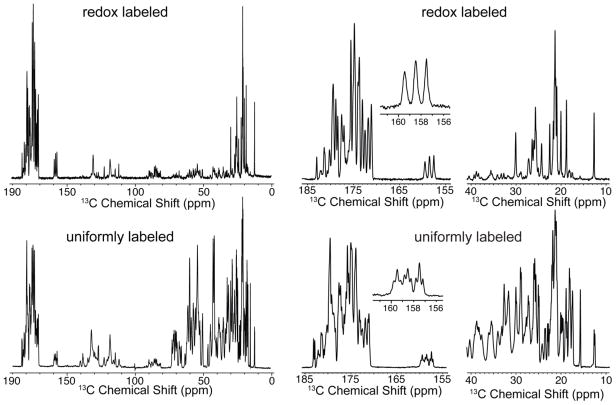
The 1D 13C CP spectrum of redox-labeled microcrystalline GB1 is compared in Figure 4 with the 1D 13C CP spectrum of uniformly labeled GB1. We see that the observed peaks are generally consistent with extensive carbonyl labeling and the sidechain labeling pattern shown in Figure 1. In the carbonyl region, removal of the one-bond CA-CO scalar couplings has clearly improved the resolution such that over 20 distinct peaks are present. Also resolved to the baseline are the CZ signals of the three tyrosines from the primary sequence (between 156 and 160 ppm), although they are somewhat broadened at the base by light labeling at the neighboring Ce positions. At 12.7 ppm, the CD signal of Ile 6, which shows a splitting from one-bond scalar coupling in the uniformly labeled sample, is collapsed to a single, narrow peak in the redox-labeled sample. With the exception of several threonine CG contributions, almost all the aliphatic signals can be resolved in 1D. Since GB1 has no Pro, His, or Arg residues, we do not observe signals from those sidechains.
Figure 4.
1D 13C CPMAS spectra of redox-labeled (top) compared with uniformly labeled (bottom) GB1. Full spectra are shown on the left, expansions of the carbonyl and aliphatic regions are shown on the right, and the tyrosine C peaks are shown in insets. All three Tyr CZ sites are resolved for redox-labeled GB1. Both spectra were acquired at 800 MHz 1H, 18 kHz MAS, with 83 kHz TPPM 1H decoupling and 128 scans with a 2.5 second recycle delay. Signals in the region 80–90 ppm are spinning sidebands. For the redox-labeled GB1, the small CA signals (30–70 ppm) are due to a combination of natural abundance background and low level scrambling.
The one surprise was in the distribution of label in the tryptophan sidechain. CG and CD1, originating in ribose, were labeled as expected. However, the benzene ring, originating from chorismate, was more heavily labeled at CE2 than at CH2. In contrast, the pathways from chorismate to phenylalanine and tyrosine deposit aromatic labels in the pattern that is expected, indicating that there is nothing anomalous about the labeling of chorismate. Looking downstream from chorismate, it is as though more of the tryptophan derived from the p-aminobenzoate (PABA) product of chorismate than from the o-aminobenzoate (anthranilate) product of chorismate. However, we know of no precedent for such an alternative pathway and wonder whether it may be unique to Pseudomonas mendocina Palleroni.
To further characterize the new labeling scheme we carried out a 2D 15N-13C ZF-TEDOR experiment with a mixing time optimized for maximum one-bond transfers (~1.2 ms TEDOR mixing). The ZF-TEDOR spectrum of redox-labeled GB1 shown in Figure 5. This spectrum shows that the carbonyl sites are all represented in redox-labeled GB1 and that removing the one-bond CA-CO scalar coupling reduces the CO linewidths by a factor of two or better. All peaks were assigned and consistent within 0.2–0.1 ppm of previously published shifts (Franks et al. 2005).
Figure 5.
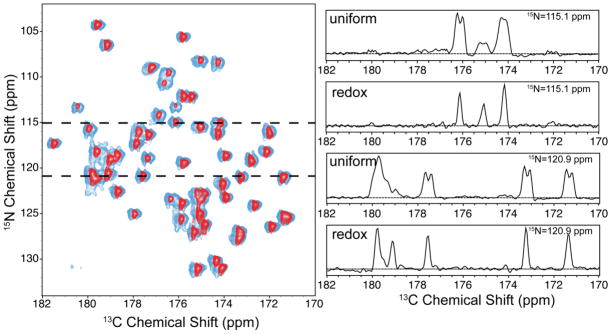
Comparison of 2D 15N-13C ZF-TEDOR spectra of uniformly labeled and redox-labeled GB1. Left: spectrum for the redox-labeled sample (dark shade) superimposed on the spectrum for the uniformly labeled sample (light shade). Right: selected slices at 15N frequencies of 115.1 ppm (top two slices) and 120.9 ppm (bottom two slices). Spectra were recorded at 18.0 kHz MAS, 800 MHz 1H Larmor frequency. The full spectra are shown in Figure S3.
Figure 5 also shows the ZF-TEDOR spectrum of uniformly labeled GB1, acquired and processed with the same parameters. The comparison illustrates the reduction in linewidths and improvement in sensitivity obtained by redox-labeling. Although about half as much redox-labeled material was present as uniformly-labeled material, the removal of all scalar couplings resulted in similar sensitivity.
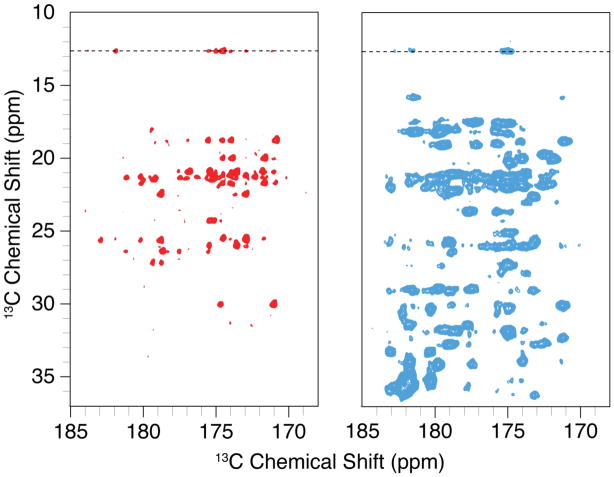
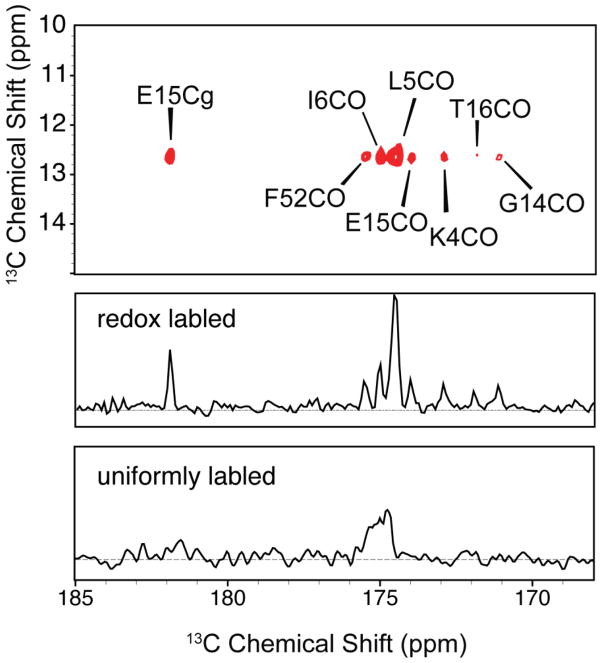
To see if the redox labeling attenuated dipolar truncation, we acquired 2D 13C-13C RFDR correlation experiments on redox-labeled and uniformly labeled GB1 samples. The experiment employed 12.44 ms RFDR mixing, which is sufficient to generate long-range (5 Å or greater) transfers, at 18 kHz MAS and 800 MHz 1H Larmor frequency. Figure 6 shows an expansion of the CO-aliphatic region of the spectrum, where we would expect to find intra- and inter-residue backbone CO to sidechain contacts with this amount of RFDR mixing. For uniformly labeled GB1, we see very few long range contacts; most contacts present are one and two-bond contacts with a few three bond or longer contacts. This is consistent with the observation that dipolar truncation would severely minimize transfers among weakly coupled spins. The panel for redox-labeled GB1 shows many intra- and inter-residue backbone to sidechain contacts, including contacts that are nearly 6 Å apart (according to PDB 2GI9 (Franks et al. 2006)). Such contacts, illustrated in Figure 7 by the portion of the RFDR spectrum involving the CD signal of Ile 6, provide experimental evidence that dipolar truncation is effectively avoided by the redox-labeling scheme. Furthermore, cross peak line widths for redox-labeled GB1 are significantly narrower, by a factor of 2 or more, compared with uniformly labeled GB1, permitting long-range contacts to be identified in larger systems despite the fact that the carbonyl region typically has a relatively small dispersion.
Figure 6.
12.4 ms RFDR 13C-13C 2D spectra comparing redox-labeled GB1 (left) with uniformly labeled GB1 (right). These expansions show the CO-aliphatic region of the spectrum, which is typically very crowded for uniformly labeled samples. Each experiment was acquired at 18 kHz MAS with 8 scans per point for a total time of approximately 8 hours per experiment. Both spectra were processed with identical parameters and displayed at the same contour level. Traces along the dotted line at 12.7 ppm are shown in Figure 7. The full spectra are shown in Figures S1 and S2.
Figure 7.
Details from Figure 6 associated with the CD resonance of Ile 6 at 12.7 ppm. Top panel: expansion of the RFDR spectrum for the redox-labeled sample, showing 8 unique cross peaks, including several corresponding to long-range, through space contacts. Middle and bottom panels: 1D traces through 12.7 ppm for redox-labeled GB1 (middle panel) and uniformly labeled GB1 (bottom panel).
Discussion
In this paper we presented a new labeling scheme for isotopic labeling of E. coli recombinantly expressed proteins. The new scheme produces carbonyl labeling for all residue types except histidine and labeling of selected sidechain sites for 12 residue types. The labeled peptone can be added to M9 minimal media and acts as a rich source of nutrients, enabling high protein yields.
This approach has a number of potential benefits and applications.
Foremost, as illustrated by the 2D RFDR data for GB1, dipolar truncation is effectively avoided. This will permit ZQ and DQ recoupling experiments to detect long-range contacts, and potentially measure long-range carbon-carbon distances with very high precision via a minimal set of broadband experiments. This use of the labeling scheme is being explored and a manuscript detailing this potential benefit will be forthcoming.
Redox labeling will also be useful for assignment experiments. In particular, it is suited to both 3D NCOCX experiments and 3D NCOCO experiments, analogous to experiments done by McDermott and coworkers (Goldbourt et al. 2007) on carbonyl labeled PF1 and Ladizhansky and coworkers on uniformly labeled GB1 (Janik et al. 2010). These experiments would significantly benefit from the removal of the scalar coupling contribution to linewidths; since this is achieved biochemically there would be no need for j-decoupling, which can be a source of polarization loss when implemented with selective pulses. Removal of scalar couplings also permits application of long mixing TEDOR experiments without the need for z-filters or selective pulses.
Redox labeling would improve measurements of order parameters. Backbone carbonyls (Dayie and Wagner 1997; Mulder and Akke 2003; Huang et al. 1999; Chang and Tjandra 2005) and methyl groups (Lee et al. 1999) have been very useful for site specific measurements of protein dynamics. Backbone CO and N order parameters have been also measured by TEDOR (Helmus et al. 2010). Such experiments would benefit from the removal of one bond scalar and dipolar couplings.
Salt bridges, which may contribute significantly to the stability of globular proteins (Anderson et al. 1990) and amyloid fibrils (Petkova et al. 2002), can be challenging to identify in uniformly labeled samples. Redox labeling highlights sidechain sites from several charged residues. This would facilitate measurement of salt bridge contacts.
Inverse redox labeling can be realized by starting with [2-13C] acetate instead of [1-13C] acetate. One potential use of such a scheme would be to acquire 3D NCACX experiments for intra-residue assignments. One bond CA-CO scalar couplings would be removed, thereby reducing linewidths for the CA dimension in an NCACX spectrum. This would also improve measurements of CA order parameters.
The Pseudomonas peptone can support labeling in a variety of systems. In addition to the above described cultures of E. coli BL21(DE3) in M9 media, we have succeeded in using the peptone to grow E. coli MG1655 in modified LB media and Saccharomyces cerevisiae BY4742 in YPD media, with appropriate buffers.
[1-13C] and [2-13C] acetate also label Pseuodomonas lipids and nucleic acids in the expected patterns. Thus, redox and inverse redox labeling may be useful for studies of biomolecules other than proteins.
Supplementary Material
Acknowledgments
We thank Dr. Alexei Belenky for assistance with LC-MS, Dr. Christopher Turner for assistance with the COSY and HSQC experiments, Loren Andreas, Dr. Marcel Reese, and Dr. Yongchao Su for assistance with the set up of the 800 MHz spectrometer, and Dr. Jochem Struppe for assistance with the TEDOR pulse program. Research reported in this publication was supported by the National Institute of Biomedical Imaging and Bioengineering of the National Institutes of Health under award numbers EB001035, EB001960 and EB002026. The content is solely the responsibility of the authors and does not necessarily represent the official views of the National Institutes of Health.
References
- Anderson D, Becktel W, Dahlquist F. pH-induced denaturation of proteins: a single salt bridge contributes 3–5 kcal/mol to the free energy of folding of T4 lysozyme. Biochemistry. 1990;29 (9):2403–2408. doi: 10.1021/bi00461a025. [DOI] [PubMed] [Google Scholar]
- Bayro M, Debelouchina G, Eddy M, Birkett N, MacPhee C, Rosay M, Maas W, Dobson C, Griffin R. Intermolecular structure determination of amyloid fibrils with magic-angle spinning and dynamic nuclear polarization NMR. Journal of the American Chemical Society. 2011;133 (35):13967–13974. doi: 10.1021/ja203756x. [DOI] [PMC free article] [PubMed] [Google Scholar]
- Bayro M, Huber M, Ramachandran R, Davenport T, Meier B, Ernst M, Griffin R. Dipolar truncation in magic-angle spinning NMR recoupling experiments. Journal of Chemical Physics. 2009;130:114506. doi: 10.1063/1.3089370. [DOI] [PMC free article] [PubMed] [Google Scholar]
- Bayro MJ, Maly T, Birkett NR, Macphee CE, Dobson CM, Griffin RG. High-Resolution MAS NMR Analysis of PI3-SH3 Amyloid Fibrils: Backbone Conformation and Implications for Protofilament Assembly and Structure. Biochemistry. 2010;49 (35):7474–7484. doi: 10.1021/bi100864t. [DOI] [PMC free article] [PubMed] [Google Scholar]
- Bayro MJ, Ramachandran R, Caporini MA, Eddy MT, Griffin RG. Radio frequency-driven recoupling at high magic-angle spinning frequencies: homonuclear recoupling sans heteronuclear decoupling. J Chem Phys. 2008;128 (5):052321. doi: 10.1063/1.2834736. [DOI] [PubMed] [Google Scholar]
- Bennett A, Rienstra C, Griffiths J, Zhen W, Lansbury P, Griffin R. Homonuclear radio frequency-driven recoupling in rotating solids. J Chem Phys. 1998;108 (22):9463–9479. [Google Scholar]
- Bennett AE, Rienstra CM, Auger M, Lakshmi KV, Griffin RG. Heteronuclear decoupling in rotating solids. J Chem Phys. 1995:1–8. [Google Scholar]
- Castellani F, van Rossum B, Diehl A, Schubert M, Rehbein K, Oschkinat H. Structure of a protein determined by solid-state magic-angle-spinning NMR spectroscopy. Nature. 2002;420 (6911):98–102. doi: 10.1038/nature01070. [DOI] [PubMed] [Google Scholar]
- Castellani F, van Rossum B-J, Diehl A, Rehbein K, Oschkinat H. Determination of solid-state NMR structures of proteins by means of three-dimensional 15N-13C-13C dipolar correlation spectroscopy and chemical shift analysis. Biochemistry. 2003;42 (39):11476–11483. doi: 10.1021/bi034903r. [DOI] [PubMed] [Google Scholar]
- Chang S-L, Tjandra N. Temperature dependence of protein backbone motion from carbonyl13C and amide15N NMR relaxation. Journal Of Magnetic Resonance. 2005;174 (1):43–53. doi: 10.1016/j.jmr.2005.01.008. [DOI] [PubMed] [Google Scholar]
- Costa PR. PhD Dissertation. Massachusetts Instittute of Technology; Cambridge, Massachusetts: 1996. Spins, peptides, and Alzheimer’s disease : solid-state nuclear magnetic resonance investigations of amyloid peptide conformation. [Google Scholar]
- Dayie K, Wagner G. Carbonyl carbon probe of local mobility in 13C, 15N-enriched proteins using high-resolution nuclear magnetic resonance. Journal of the American Chemical Society. 1997;119 (33):7797–7806. [Google Scholar]
- Debelouchina G, Platt G, Bayro M, Radford S, Griffin R. Intermolecular alignment in β2-microglobulin amyloid fibrils. Journal of the American Chemical Society. 2010;132 (48):17077. doi: 10.1021/ja107987f. [DOI] [PMC free article] [PubMed] [Google Scholar]
- Delaglio F, Grzesiek S, Vuister G, Zhu G, Pfeifer J, Bax A. NMRPipe: a multidimensional spectral processing system based on UNIX pipes. Journal of Biomolecular NMR. 1995;6 (3):277–293. doi: 10.1007/BF00197809. [DOI] [PubMed] [Google Scholar]
- Etzkorn M, Martell S, Andronesi OC, Seidel K, Engelhard M, Baldus M. Secondary Structure, Dynamics, and Topology of a Seven-Helix Receptor in Native Membranes, Studied by Solid-State NMR Spectroscopy. Angew Chem Int Ed. 2007;46 (3):459–462. doi: 10.1002/anie.200602139. [DOI] [PubMed] [Google Scholar]
- Franks WT, Wylie BJ, Stellfox SA, Rienstra CM. Backbone conformational constraints in a microcrystalline U-15N-labeled protein by 3D dipolar-shift solid-state NMR spectroscopy. J Am Chem Soc. 2006;128 (10):3154–3155. doi: 10.1021/ja058292x. [DOI] [PubMed] [Google Scholar]
- Franks WT, Zhou DH, Wylie BJ, Money BG, Graesser DT, Frericks HL, Sahota G, Rienstra CM. Magic-angle spinning solid-state NMR spectroscopy of the beta1 immunoglobulin binding domain of protein G (GB1): 15N and 13C chemical shift assignments and conformational analysis. J Am Chem Soc. 2005;127 (35):12291–12305. doi: 10.1021/ja044497e. [DOI] [PubMed] [Google Scholar]
- Goldbourt A, Day LA, McDermott AE. Assignment of congested NMR spectra: carbonyl backbone enrichment via the Entner-Doudoroff pathway. J Magn Reson. 2007;189 (2):157–165. doi: 10.1016/j.jmr.2007.07.011. [DOI] [PubMed] [Google Scholar]
- Helmus JJ, Surewicz K, Surewicz WK, Jaroniec CP. Conformational flexibility of Y145Stop human prion protein amyloid fibrils probed by solid-state nuclear magnetic resonance spectroscopy. J Am Chem Soc. 2010;132 (7):2393–2403. doi: 10.1021/ja909827v. [DOI] [PMC free article] [PubMed] [Google Scholar]
- Higman VA, Flinders J, Hiller M, Jehle S, Markovic S, Fiedler S, Rossum B-J, Oschkinat H. Assigning large proteins in the solid state: a MAS NMR resonance assignment strategy using selectively and extensively 13C-labelled proteins. Journal of Biomolecular NMR. 2009;44 (4):245–260. doi: 10.1007/s10858-009-9338-7. [DOI] [PubMed] [Google Scholar]
- Hiller M, Higman VA, Jehle S, van Rossum B-J, Kühlbrandt W, Oschkinat H. [2,3-(13)C]-labeling of aromatic residues--getting a head start in the magic-angle-spinning NMR assignment of membrane proteins. J Am Chem Soc. 2008;130 (2):408–409. doi: 10.1021/ja077589n. [DOI] [PubMed] [Google Scholar]
- Hing WA, Vega S, Schaefer J. Transferred-echo double-resonance NMR. Journal of Magnetic Resonance. 1992:96. [Google Scholar]
- Hong M. Determination of Multiple Phi-Torsion Angles in Proteins by Selective and Extensive 13C Labeling and Two-Dimensional Solid-State NMR. Journal of Magnetic Resonance. 1999;139 (2):389–401. doi: 10.1006/jmre.1999.1805. [DOI] [PubMed] [Google Scholar]
- Huang K, Ghose R, Flanagan J, Prestegard J. Backbone dynamics of the N-terminal domain in E. coli DnaJ determined by 15N-and 13CO-relaxation measurements. Biochemistry. 1999;38 (32):10567–10577. doi: 10.1021/bi990263+. [DOI] [PubMed] [Google Scholar]
- Jakoby WB. Crystallization as a purification technique. Methods in enzymology. 1971;22:248–252. [Google Scholar]
- Janik R, Ritz E, Gravelle A, Shi L, Peng X, Ladizhansky V. Interresidue carbonyl–carbonyl polarization transfer experiments in uniformly 13C,15N-labeled peptides and proteins. J Magn Reson. 2010;203 (1):177–184. doi: 10.1016/j.jmr.2009.12.014. [DOI] [PubMed] [Google Scholar]
- Jaroniec CP, Filip C, Griffin RG. 3D TEDOR NMR experiments for the simultaneous measurement of multiple carbon-nitrogen distances in uniformly (13)C,(15)N-labeled solids. Journal of the American Chemical Society. 2002;124 (36):10728–10742. doi: 10.1021/ja026385y. [DOI] [PubMed] [Google Scholar]
- Lee A, Flynn P, Wand A. Comparison of 2H and 13C NMR relaxation techniques for the study of protein methyl group dynamics in solution. Journal of the American Chemical Society. 1999;121 (12):2891–2902. [Google Scholar]
- LeMaster DM, Kushlan DM. Dynamical mapping of E. coli thioredoxin via 13C NMR relaxation analysis. Journal of the American Chemical Society. 1996;118 (39):9255–9264. [Google Scholar]
- Loquet A, Giller K, Becker S, Lange A. Supramolecular Interactions Probed by 13C 13C Solid-State NMR Spectroscopy. Journal of the American Chemical Society. 2010;132 (43):15164–15166. doi: 10.1021/ja107460j. [DOI] [PubMed] [Google Scholar]
- Loquet A, Lv G, Giller K, Becker S, Lange A. 13C spin dilution for simplified and complete solid-state NMR resonance assignment of insoluble biological assemblies. Journal of the American Chemical Society. 2011;133 (13):4722–4725. doi: 10.1021/ja200066s. [DOI] [PubMed] [Google Scholar]
- Loquet A, Sgourakis N, Gupta R, Giller K, Riedel D, Goosmann C, Griesinger C, Kolbe M, Baker D, Becker S. Atomic model of the type III secretion system needle. Nature. 2012 doi: 10.1038/nature11079. [DOI] [PMC free article] [PubMed] [Google Scholar]
- Lundstrom P, Teilum K, Carstensen T, Bezsonova I, Wiesner S, Hansen DF, Religa TL, Akke M, Kay LE. Fractional 13C enrichment of isolated carbons using [1-13C]-or [2-13C]-glucose facilitates the accurate measurement of dynamics at backbone Cα and side-chain methyl positions in proteins. Journal of Biomolecular NMR. 2007;38 (3):199–212. doi: 10.1007/s10858-007-9158-6. [DOI] [PubMed] [Google Scholar]
- Lv G, Kumar A, Giller K, Orcellet ML, Riedel D, Fernández CO, Becker S, Lange A. Structural Comparison of Mouse and Human α-Synuclein Amyloid Fibrils by Solid-State NMR. Journal of Molecular Biology. 2012;420 (1–2):99–111. doi: 10.1016/j.jmb.2012.04.009. [DOI] [PubMed] [Google Scholar]
- Mulder FAA, Akke M. Carbonyl13C transverse relaxation measurements to sample protein backbone dynamics. Magn Reson Chem. 2003;41 (10):853–865. doi: 10.1002/mrc.1252. [DOI] [Google Scholar]
- Nieuwkoop A, Rienstra C. Supramolecular protein structure determination by site-specific long-range intermolecular solid state NMR spectroscopy. Journal of the American Chemical Society. 2010;132 (22):7570–7571. doi: 10.1021/ja100992y. [DOI] [PMC free article] [PubMed] [Google Scholar]
- Nieuwkoop AJ, Wylie BJ, Franks WT, Shah GJ, Rienstra CM. Atomic resolution protein structure determination by three-dimensional transferred echo double resonance solid-state nuclear magnetic resonance spectroscopy. J Chem Phys. 2009;131 (9):095101. doi: 10.1063/1.3211103. [DOI] [PMC free article] [PubMed] [Google Scholar]
- Petkova A, Ishii Y, Balbach J, Antzutkin O, Leapman R, Delaglio F, Tycko R. A structural model for Alzheimer’s β-amyloid fibrils based on experimental constraints from solid state NMR. Proceedings of the National Academy of Sciences. 2002;99 (26):16742–16747. doi: 10.1073/pnas.262663499. [DOI] [PMC free article] [PubMed] [Google Scholar]
- Petritis K, Chaimbault P, Elfakir C, Dreux M. Parameter optimization for the analysis of underivatized protein amino acids by liquid chromatography and ionspray tandem mass spectrometry. Journal of Chromatography A. 2000;896 (1):253–263. doi: 10.1016/s0021-9673(00)00582-3. [DOI] [PubMed] [Google Scholar]
- Qu J, Chen W, Luo G, Wang Y, Xiao S, Ling Z, Chen G. Rapid determination of underivatized pyroglutamic acid, glutamic acid, glutamine and other relevant amino acids in fermentation media by LC-MS-MS. Analyst. 2002a;127 (1):66–69. doi: 10.1039/b108422b. [DOI] [PubMed] [Google Scholar]
- Qu J, Wang Y, Luo G, Wu Z, Yang C. Validated quantification of underivatized amino acids in human blood samples by volatile ion-pair reversed-phase liquid chromatography coupled to isotope dilution tandem mass spectrometry. Analytical chemistry. 2002b;74 (9):2034–2040. doi: 10.1021/ac0111917. [DOI] [PubMed] [Google Scholar]
- Schmidt HLF, Sperling LJ, Gao YG, Wylie BJ, Boettcher JM, Wilson SR, Rienstra CM. Crystal polymorphism of protein GB1 examined by solid-state NMR spectroscopy and X-ray diffraction. J Phys Chem B. 2007;111 (51):14362–14369. doi: 10.1021/jp075531p. [DOI] [PMC free article] [PubMed] [Google Scholar]
- Shi L, Ahmed MAM, Zhang W, Whited G, Brown LS, Ladizhansky V. Three-dimensional solid-state NMR study of a seven-helical integral membrane proton pump--structural insights. J Mol Biol. 2009;386 (4):1078–1093. doi: 10.1016/j.jmb.2009.01.011. [DOI] [PubMed] [Google Scholar]
- Sperling LJ, Berthold DA, Sasser TL, Jeisy-Scott V, Rienstra CM. Assignment strategies for large proteins by magic-angle spinning NMR: the 21-kDa disulfide-bond-forming enzyme DsbA. Journal of Molecular Biology. 2010;399 (2):268–282. doi: 10.1016/j.jmb.2010.04.012. [DOI] [PMC free article] [PubMed] [Google Scholar]
- Stanier R, Palleroni N, Doudoroff M. The aerobic pseudomonas: a taxonomic study. Journal of General Microbiology. 1966;43 (2):159–271. doi: 10.1099/00221287-43-2-159. [DOI] [PubMed] [Google Scholar]
- Goddard TD, Kneller DGS. University of California SF. [Google Scholar]
Associated Data
This section collects any data citations, data availability statements, or supplementary materials included in this article.


