Abstract
To explore the variability in biosensor studies, 150 participants from 20 countries were given the same protein samples and asked to determine kinetic rate constants for the interaction. We chose a protein system that was amenable to analysis using different biosensor platforms as well as by users of different expertise levels. The two proteins (a 50-kDa Fab and a 60-kDa glutathione S-transferase [GST] antigen) form a relatively high-affinity complex, so participants needed to optimize several experimental parameters, including ligand immobilization and regeneration conditions as well as analyte concentrations and injection/dissociation times. Although most participants collected binding responses that could be fit to yield kinetic parameters, the quality of a few data sets could have been improved by optimizing the assay design. Once these outliers were removed, the average reported affinity across the remaining panel of participants was 620 pM with a standard deviation of 980 pM. These results demonstrate that when this biosensor assay was designed and executed appropriately, the reported rate constants were consistent, and independent of which protein was immobilized and which biosensor was used.
Keywords: Biacore, Kinetics, Optical biosensor, Surface plasmon resonance
One of the hurdles we face as biosensor technology matures is in fact educating new users. From our yearly reviews of the biosensor literature, it is clear that many users do not know how to implement the technology properly [1], [2] and [3]. Therefore, over the past 7 years, we have taken an active approach to educating users through a series of benchmark studies. Typically, these studies involve sending the same samples to different users and asking them to perform a detailed analysis of an interaction. Along with educating the participants on how to properly execute an analysis, we gain valuable information about the reliability and variability of biosensor-obtained results.
In past benchmark studies, we showed that the rate constants obtained using surface-based biosensors and solution-based methods agree well [4], [5] and [6] and that when biosensor users were provided with a detailed protocol, the variability in reported parameters was approximately 20% [6], [7], [8] and [9]. This consistency, both between surface and solution methods and between users, holds true for biological systems that range in size from antibody/antigen interactions [8] to small molecule/target interactions [4],[5], [6], [7] and [9] and that range in kinetics from those that associate relatively slowly [8] to mass transport-limited systems [4], [7] and [9].
The next step in establishing the biosensor’s reliability is to ask what the deviations in the reported rate constants are when users design their own experiments and use a variety of biosensor platforms. For this study, we provided aliquots of two binding partners (a 50-kDa Fab and a 60-kDa glutathione S-transferase [GST]1-tagged Ag) to a pool of volunteers and asked them each to determine the kinetics of the interaction. The participants were free to explore different experimental parameters, including which partner to immobilize, covalent coupling and/or capturing methods, and analyte conditions such as concentration range, injection times, and flow rate.
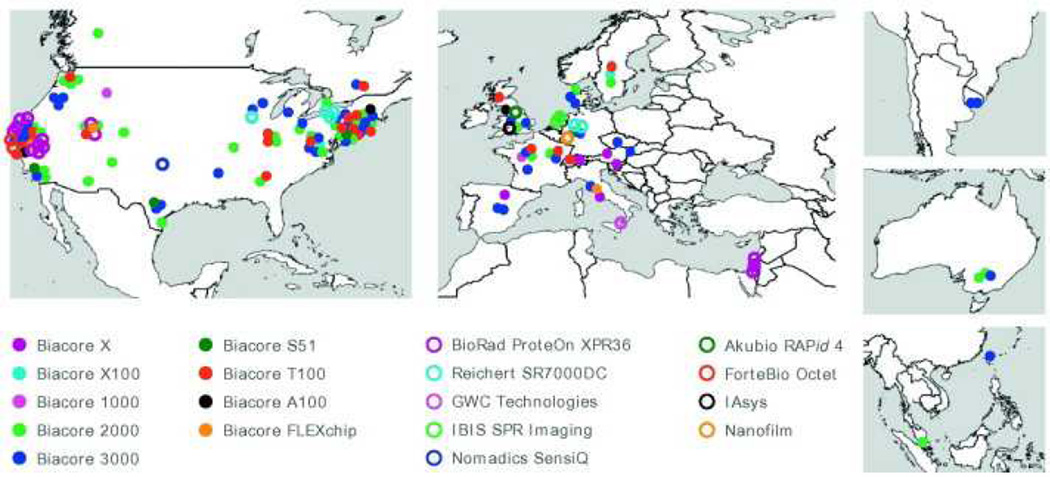
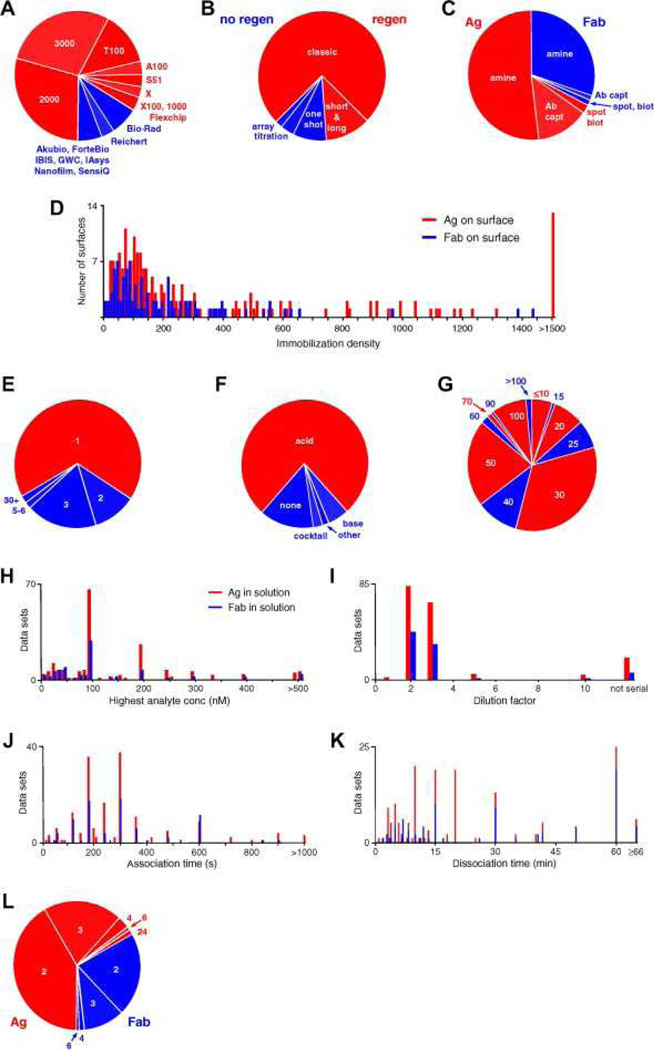
As illustrated in Fig. 1, 150 scientists from 20 countries contributed to this study. The participants, from industrial, government, and academic institutions, ranged both in biosensor expertise and in biological focus. Fig. 1 also illustrates the variety of biosensors used in this study. Although the experiment was most often performed using Biacore platforms (Fig. 2A), instruments from nine other manufacturers were involved. The instruments varied in their detection methods (from surface plasmon resonance [SPR]-based detection to alternative optical and acoustic techniques), sampling throughput (from open benchtop models to dedicated high-throughput screening platforms), flow cell design (from multiple serial independent flow cell to single large-format flow cell of array platforms), and surface chemistry (from plain gold to dextran-, alginate-, and poly(ethylene glycol)-coated surfaces).
Fig. 1.
Locations of, and instruments used by, the study participants.
Fig. 2.
Participants’ experimental parameters. (A) Instruments used, with Biacore platforms indicated in red and other manufacturers’ platforms indicated in blue. (B) Assay formats, with those requiring surface regeneration in red and other formats in blue. (C) Immobilized binding partners and tethering methods, with Ag as the ligand in red and Fab as the ligand in blue. (D) Immobilization densities for the Ag (red) and Fab (blue) from experiments performed using Biacore and Bio-Rad platforms. (The other technologies report responses in units other than resonance units [RU].) (E) Numbers of surfaces prepared. Analyses of two or more surfaces are shown in shades of blue. (F) Regeneration conditions, with nonacidic conditions shown in blue. (G) Flow rates used during analyte binding studies. (H) Highest analyte concentrations. (I) Dilution factors. (J) Lengths of analyte injection time. (For the ForteBio experiments, this corresponds to the time that the ligand-immobilized tips were immersed in analyte-containing wells.) (K) Lengths of time that the dissociation phase was monitored (dissociation was not monitored in the IAsys experiment.) In panels H–K, red bars represent parameters for Ag as the binding partner in solution and blue bars represent Fab in solution. (L) Numbers of replicates when Ag (red) and Fab (blue) were the binding partners in solution. (For interpretation of color mentioned in this figure the reader is referred to the web version of the article.)
The participants designed their own experiments, fit the responses to obtain kinetic parameters, and summarized their results. We evaluated how individuals approached the task, and we identified mistakes in experimental design and data analysis that led to inaccurate results. Overall, we were pleased to see that the quality of most of the biosensor data was very high, and we are happy that enthusiastic participation in these benchmark studies continues as the biosensor user community grows.
Materials and methods
Reagents
For the study, 50 µl of the two protein binding partners (Fab and GST–PcrV at 10 µM in HBS-P [10 mM Hepes, 150 mM NaCl, and 0.005% Tween 20 at pH 7.4], prepared as described in Ref. [10]) was distributed on dry ice to the participants. Each participant provided all other materials required for the analysis.
Experiment instructions
Participants were asked to determine interaction kinetic and affinity parameters at 25 °C in HBS-P supplemented with 0.1 mg/ml bovine serum albumin (BSA). They were told that the binding partners were well behaved and stable.
Results
As the model system for this study, we chose a protein/protein interaction that could be characterized using any of today’s commercially available affinity-based biosensors; remained active under different immobilization, analysis, and regeneration conditions; and was representative of the interactions typically studied by both novice and expert biosensor users. The participants developed their own approaches to characterize this system; a number used more than one biosensor platform and/or surface, compared various immobilization methods, and studied the interaction in both orientations.
Assay format
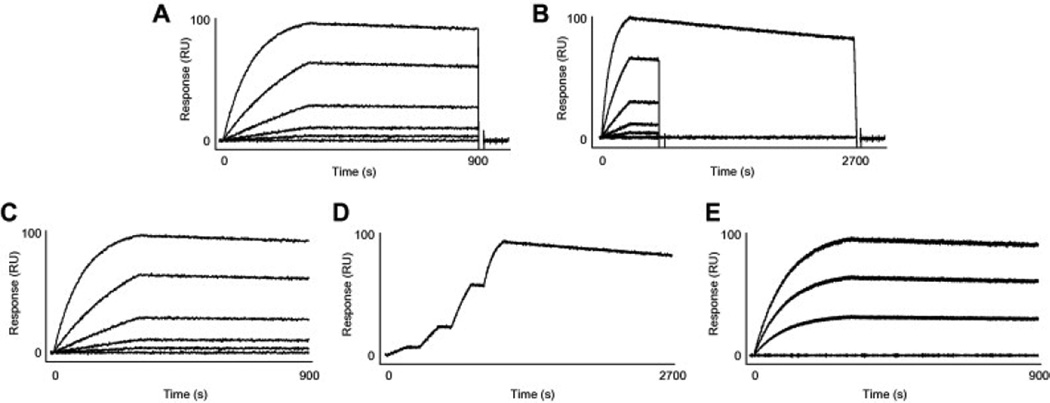
Participants used one (or more) of the five assay formats illustrated in Fig. 3. As indicated in Fig. 2B most commonly used was the classic format, where the dissociation phase is monitored for the same length of time for each analyte concentration (Fig. 3A). A more efficient approach, the combination of short and long dissociation times (or short-‘n-long [SNL] dissociation), collects more dissociation information for only one analyte concentration (usually the highest concentration [Fig. 3B]). This approach works because the decay in the signal of the highest analyte concentration provided enough information to establish the dissociation rate constant (kd). Shortening the dissociation times of the lower analyte concentrations decreases the time required for an experiment.
Fig. 3.
Types of assay format used in the study. (A) Classic: several analyte concentrations flowed serially across an immobilized ligand with a surface regeneration step between each injection. (B) SNL (short-‘n-long) dissociation: several analyte concentrations with a relatively short dissociation phase and one analyte concentration with a much longer dissociation phase flowed serially across an immobilized ligand with a regeneration step between each injection. (C) One-shot: several analyte concentrations flowed in parallel across a ligand surface without surface regeneration. (D) Kinetic titration: several analyte concentrations flowed serially over a ligand surface without surface regeneration. (E) Ligand array: a single analyte concentration flowed simultaneously across multiple immobilized ligand spots of different densities without surface regeneration. In this nine-spot array example, the ligand was spotted three times at three concentrations. RU, resonance units.
But both of the formats in Fig. 3A and B require regenerating the ligand surface after each analyte injection. Identifying suitable regeneration conditions can be challenging in some cases. The three alternative formats shown in Fig. 3C–E (one-shot kinetics, kinetic titration, and ligand array) do not require a regeneration step. For example, with Bio-Rad’s one-shot kinetics [11] or ForteBio’s dip-and-read approach [12], a user collects kinetic data for several analyte concentrations across several target protein surfaces at one time. For kinetic titration, several analyte concentrations are injected (usually in increasing order) across the ligand surface in a single binding cycle [13]. In the ligand array format, analyte at one concentration is flowed over a matrix of ligand spots within a single large flow cell [14]. These formats consume less reagent material and require minimal scouting and so can decrease the time required for the experiment.
Ligand immobilization
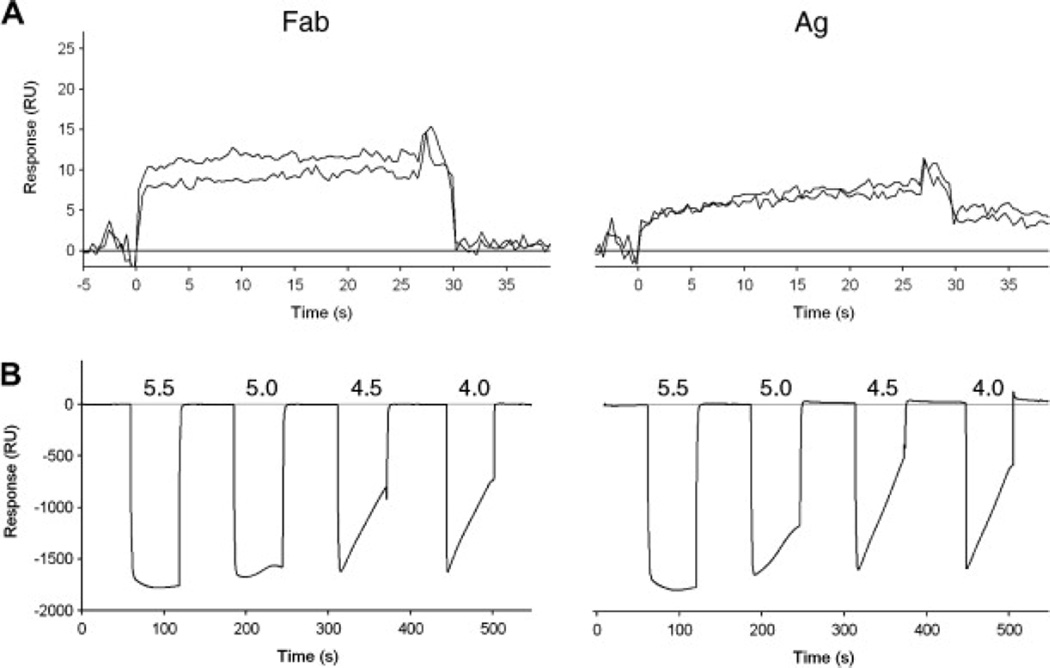
Participants decided which binding partner to tether to the surface and which immobilization chemistry to use. To choose the ligand, a number of participants performed preliminary tests, including nonspecific binding and pH scouting tests. For example, injecting the Fab and Ag across an unmodified flow cell surface revealed that neither protein bound nonspecifically to the surface (Fig. 4A). Also, injections of the Fab and Ag diluted in weak acid solutions (10 mM sodium acetate) indicated that both proteins preconcentrated well at pH 4.5 (Fig. 4B). Based on these results, either protein could be immobilized. But nearly two-thirds of the participants chose to tether the Ag to the surface (Fig. 2C), with many noting that they made this choice to minimize complications that might arise from dimerization of the GST-tagged Ag if it was used as the analyte.
Fig. 4.
Preimmobilization tests of Fab (left) and Ag (right). (A) Nonspecific binding test: the responses from injections of a buffer blank and 100 nM protein across an unmodified sensor chip are overlaid. (B) pH scouting: 100 nM protein was injected at different pH levels to identify the optimal pH for ligand preconcentration. RU, resonance units.
For both Fab and Ag immobilization, most participants used standard amine coupling (Fig. 2C). Alternatively, some participants captured the ligand on antibody surfaces (the Ag and Fab were captured by anti-GST and anti-Fab antibodies, respectively). A few participants directly adsorbed one binding partner on a gold surface or minimally biotinylated it for capture on a streptavidin surface.
Fig. 2D and E illustrate the range and number of ligand densities prepared by the participants. For the most part, the ligands were immobilized at low densities to minimize the potential effects of surface crowding, ligand aggregation, and mass transport (Fig. 2D). In addition, nearly one-fourth of the participants immobilized the ligand at more than one density to perform a more rigorous analysis (Fig. 2E).
Participants found a wide range of regeneration conditions suitable for this analysis. Although most used an acidic solution (Fig. 2F), viable alternatives included dilute base, sodium dodecyl sulfate (SDS), guanidine, and a cocktail. Of course, for those using one of the formats depicted in Fig. 3C–E, no surface regeneration was necessary.
Analyte parameters
When preparing the analyte samples, the participants needed to optimize several factors to obtain reliable binding responses. For example, they needed to choose what flow rate to use, what analyte concentrations to test, and how much association and dissociation data to collect.
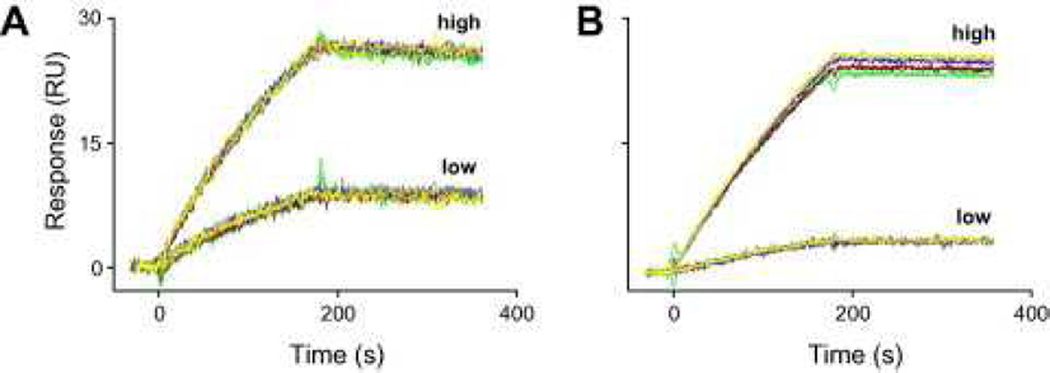
Aware that slow flow rates can contribute to mass transport effects, several participants performed a preliminary flow rate test in which the analyte (at one concentration) was injected at several flow rates across the ligand surface. Fig. 5 shows the results from flow rate tests of Ag and Fab, each immobilized at two densities. In both panels, the analyte binding responses at all flow rates overlaid, indicating that the interaction (in both orientations) under these conditions was independent of mass transport. This allowed participants to justifiably use lower flow rates (if they wished) so that they could consume less sample per analyte injection or extend the analyte injection time. The pie chart in Fig. 2G illustrates the wide range of flow rates used in this experiment for the flow-based systems. (In the ForteBio-based experiments, samples were not flowed. Instead, the ligand-coated tips were dipped in the analyte-containing wells of a shake plate[12]. In IAsys, the sample is stirred in a cuvette rather than flowed across a surface.)
Fig. 5.
Recognizing that high analyte concentrations can introduce artifacts (e.g., binding responses can become contaminated by secondary interactions), the majority of participants used 100 nM (of either Fab or Ag) as the highest concentration (Fig. 2H). Except for some array experiments, which were designed to test only one concentration (denoted as a 1-fold dilution factor), the participants most often tested a 2- or 3-fold dilution series of the analyte, although a few used up to a 10-fold dilution (Fig. 2I). A subset of participants did not use a serial dilution series (indicated by the bars at the far right in Fig. 2I). In general, a 2- or 3-fold dilution series is easy to set up, and it is much easier to visually interpret the data when they are in a consistent dilution series.
The greatest variability in experimental design arose from the participants’ choices of how long to collect association and dissociation phase data. Injection times ranged widely, from 25 s to 50 min, with 1 to 5 min being most common (Fig. 2J). Although all participants collected dissociation data for at least 1 min, a 1-h dissociation phase was not unusual and a few monitored the complex’s dissociation for up to 4 h (Fig. 2K).
Nearly two-thirds (65%) of participants tested at least one analyte concentration twice, with most testing at least one concentration in duplicate or triplicate (Fig. 2L). Analyte replicates demonstrated the reproducibility of the participants’ analyses; overlaid replicates confirmed that both ligand and analyte were stable throughout the experiment and that the regeneration condition was appropriate.
Binding responses
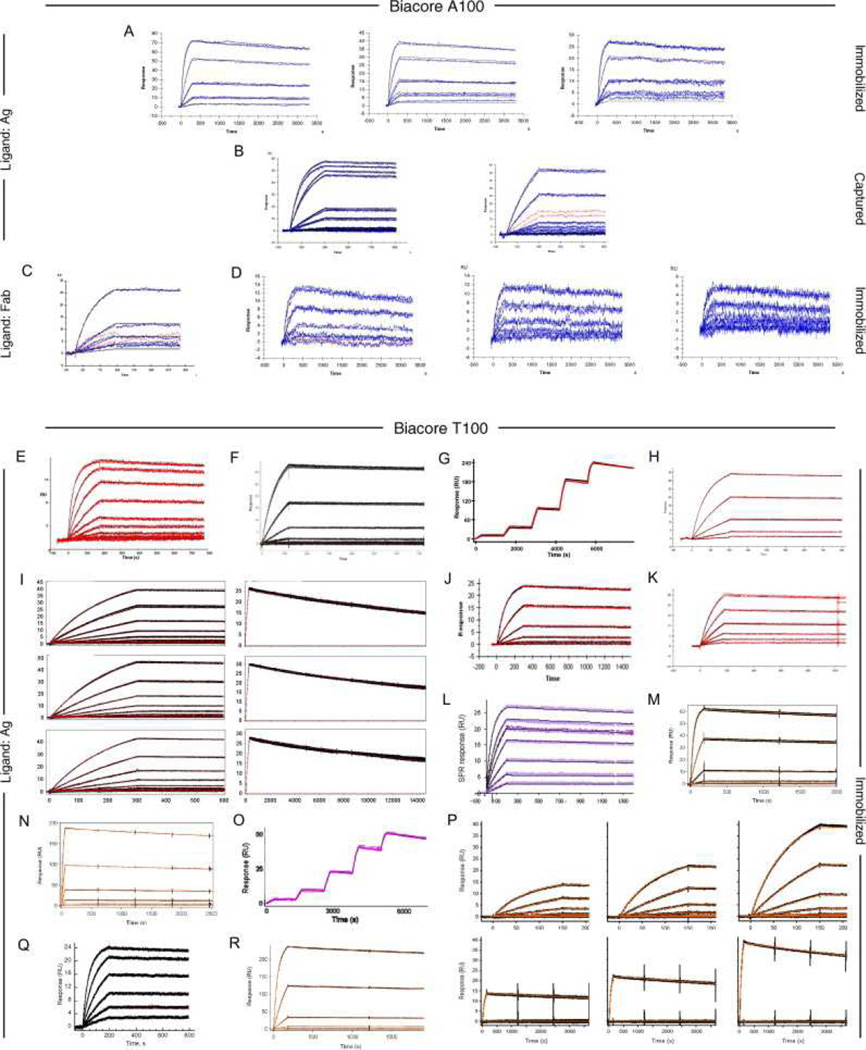
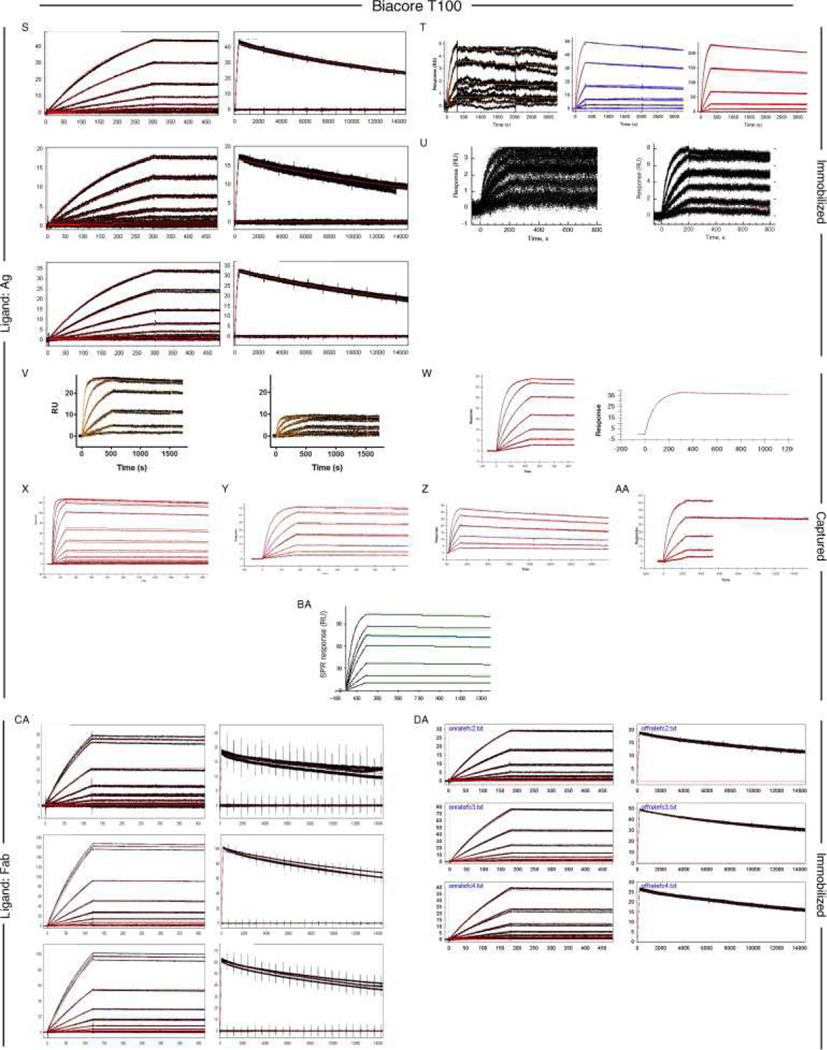
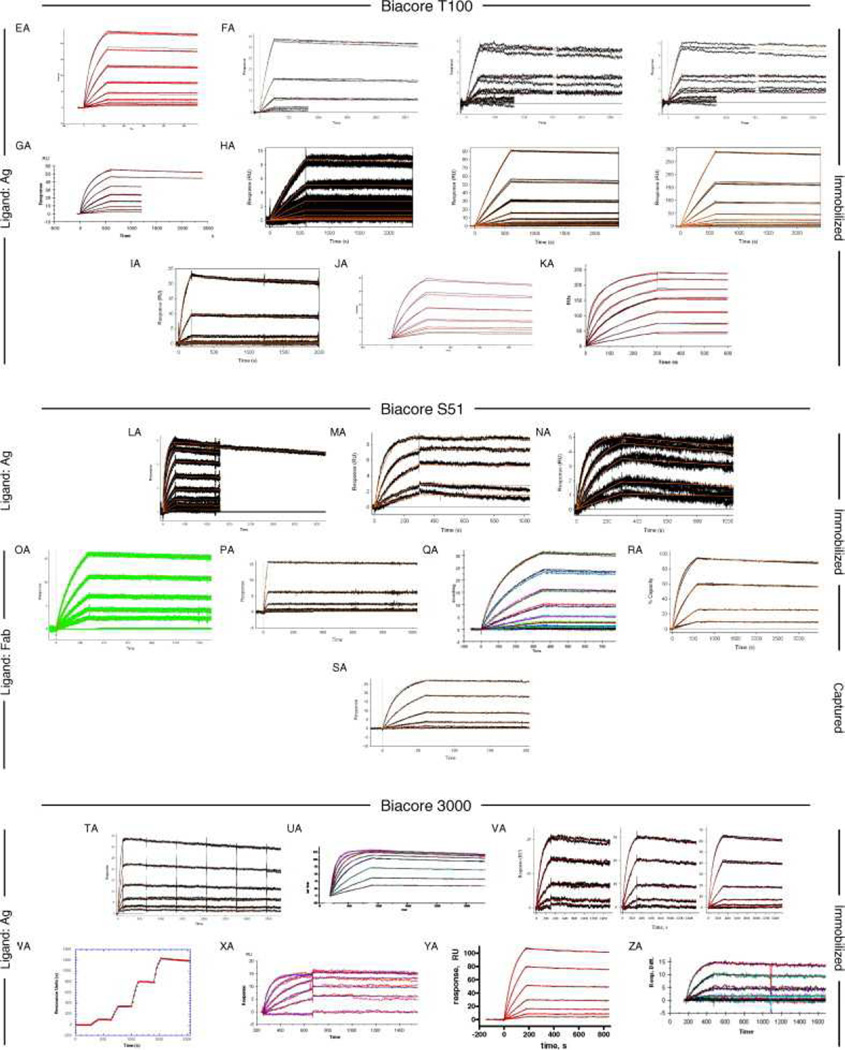
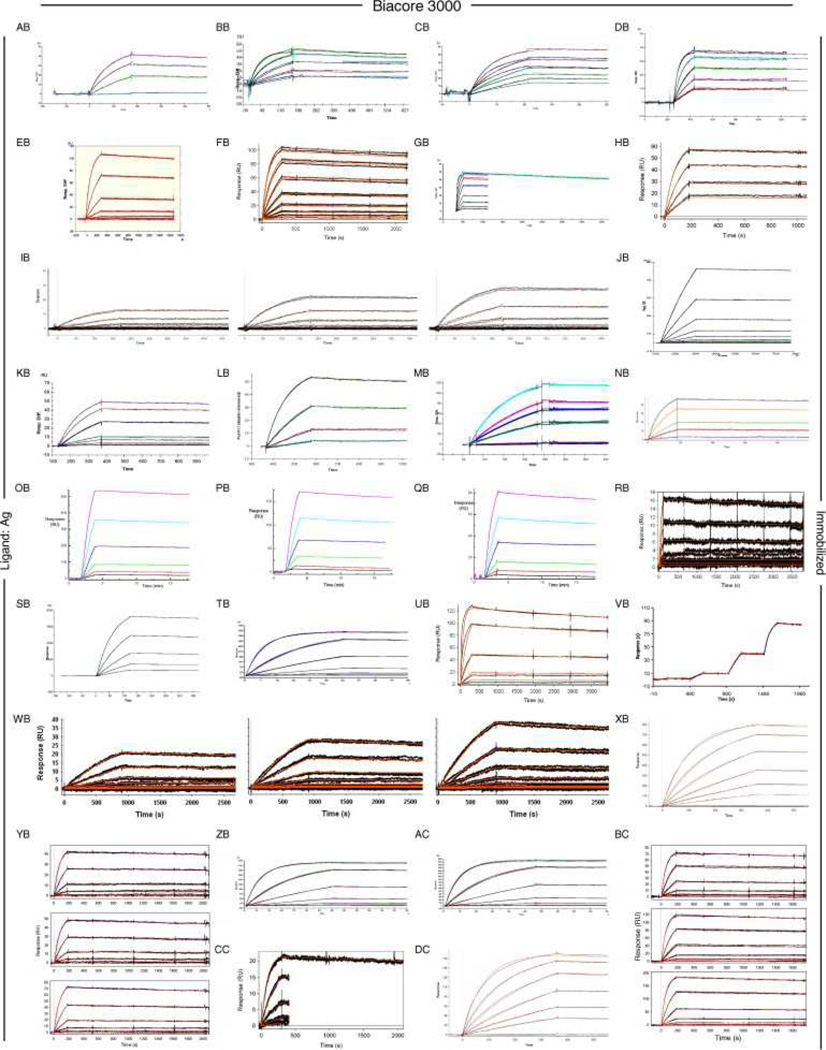
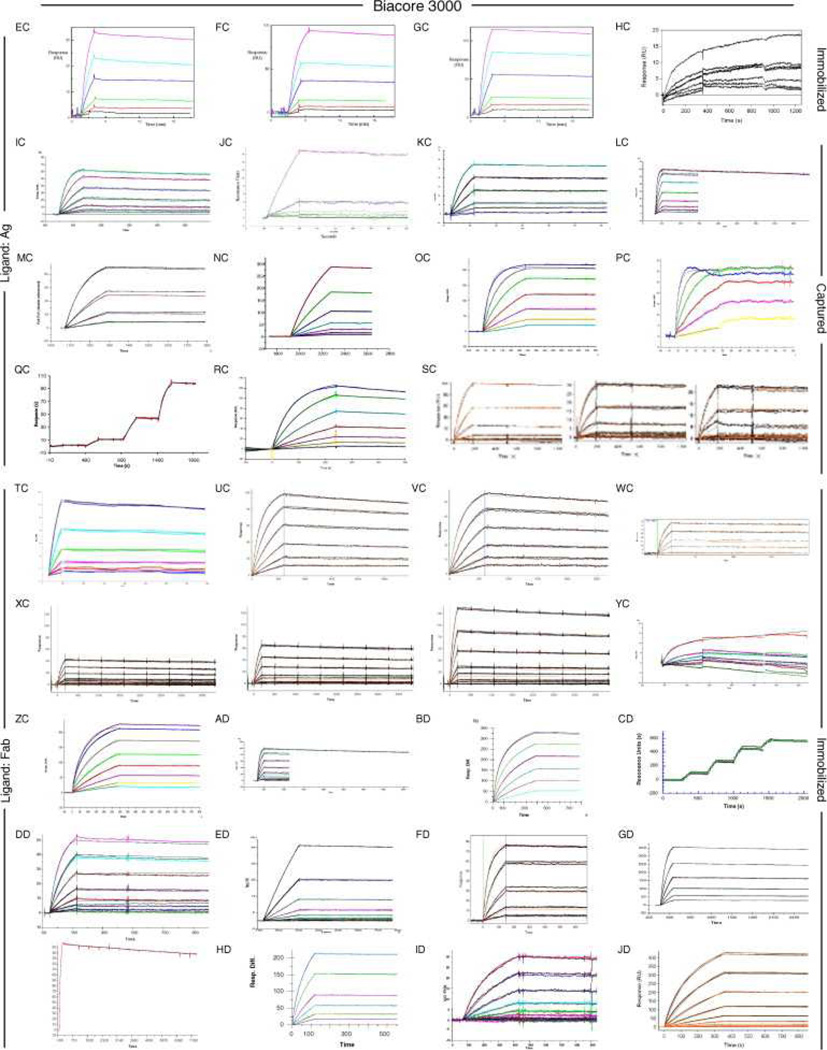
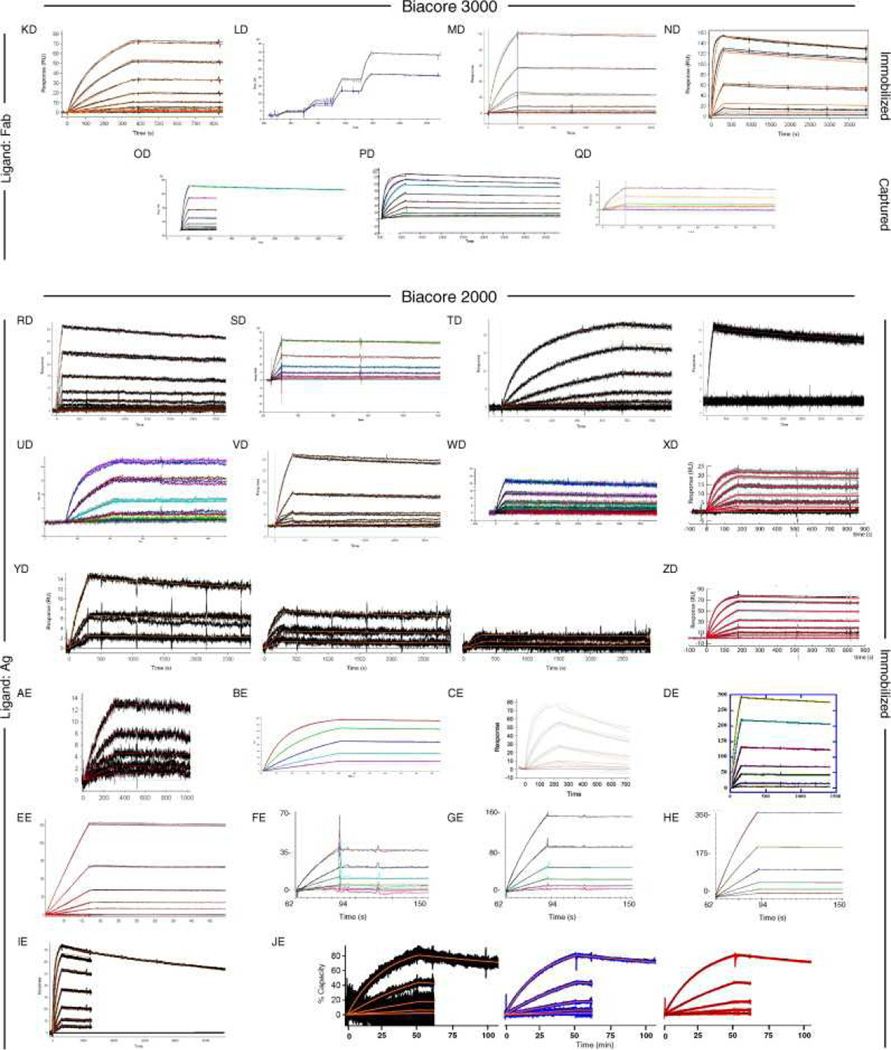
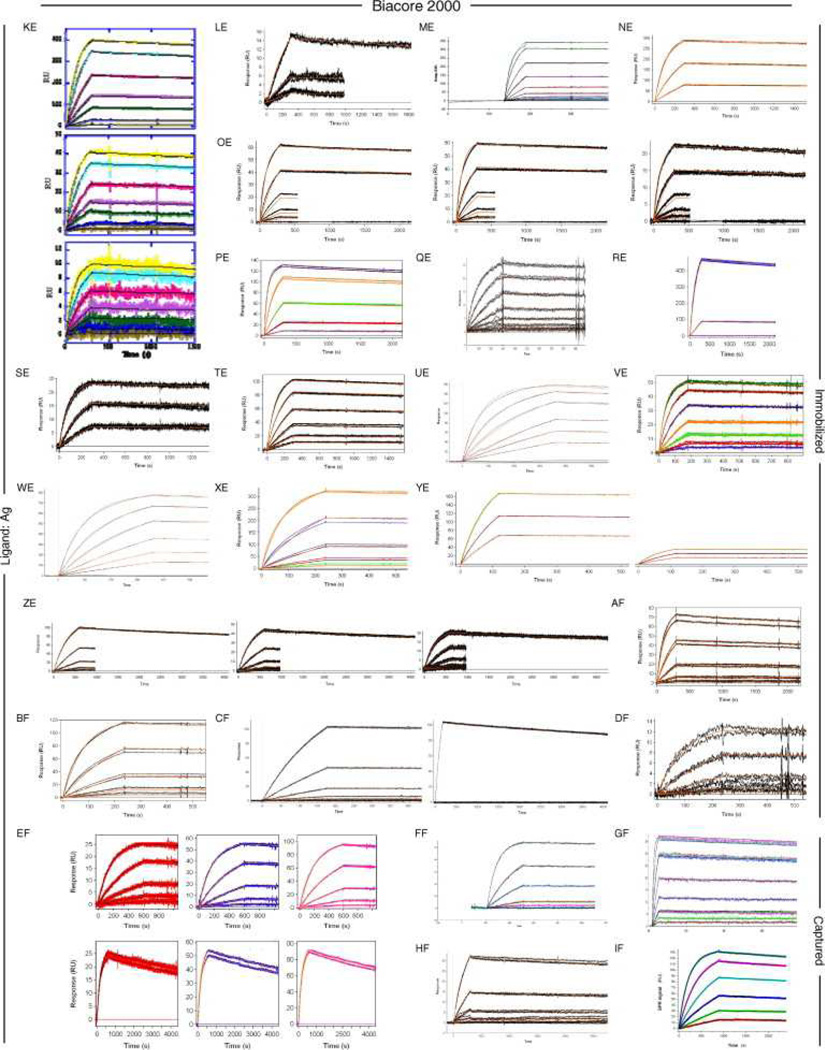
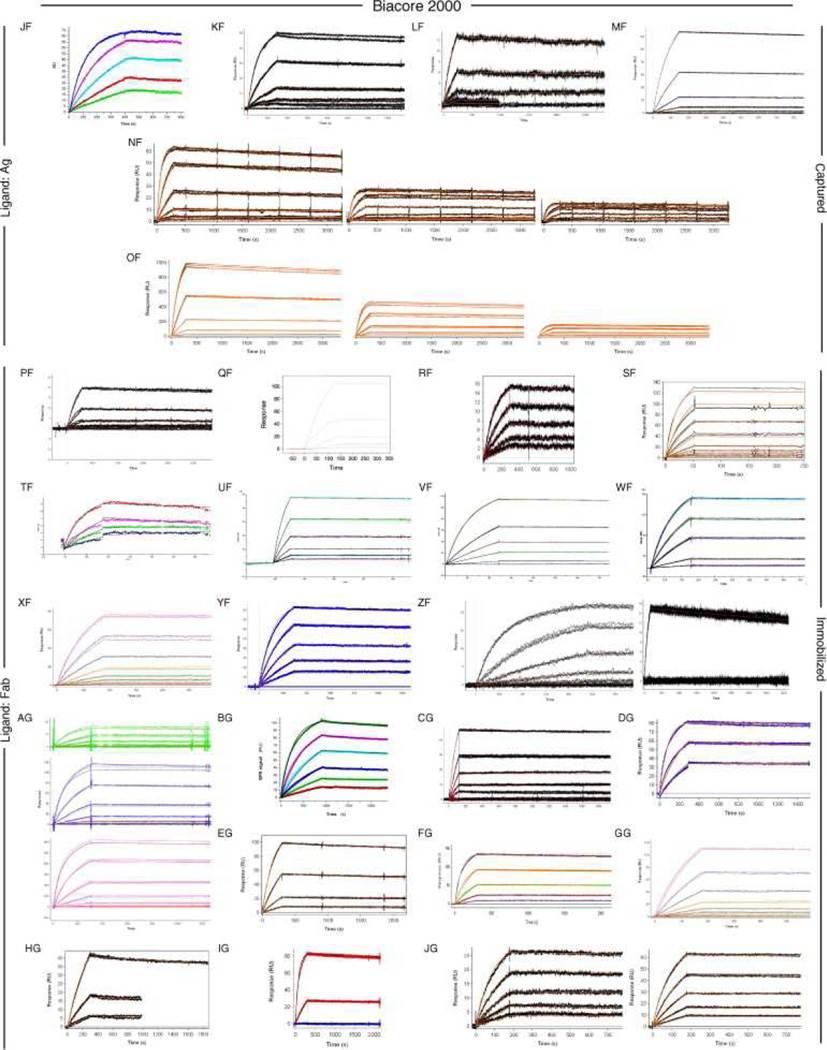
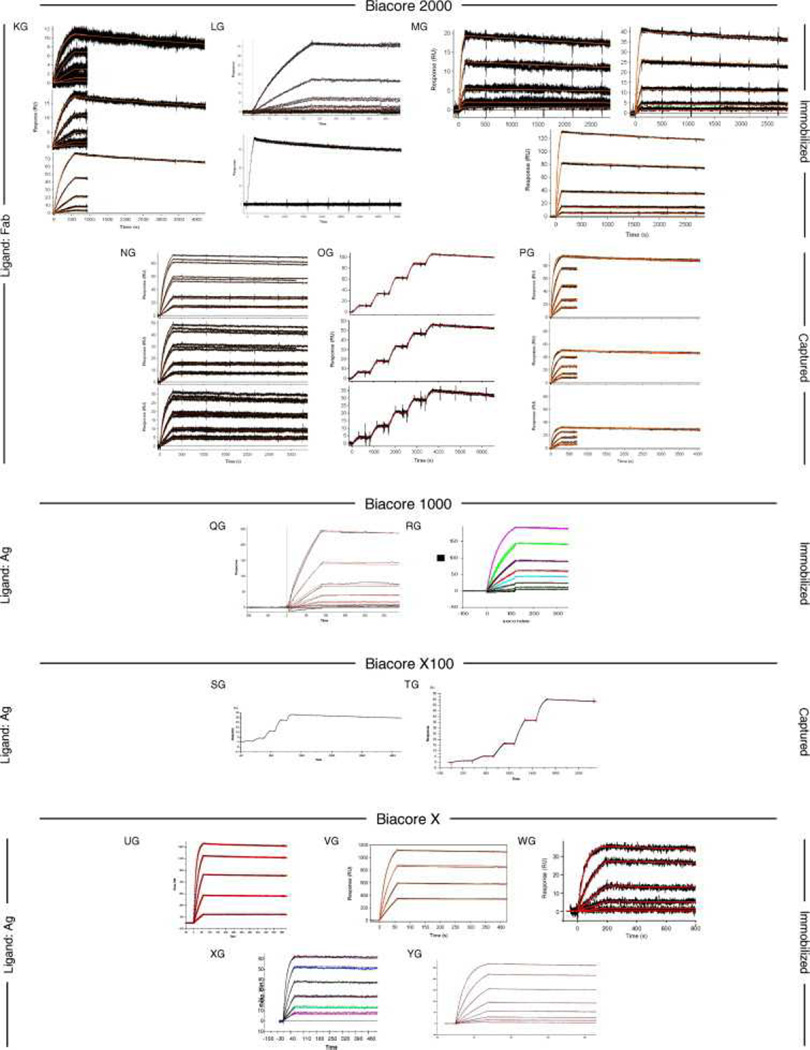
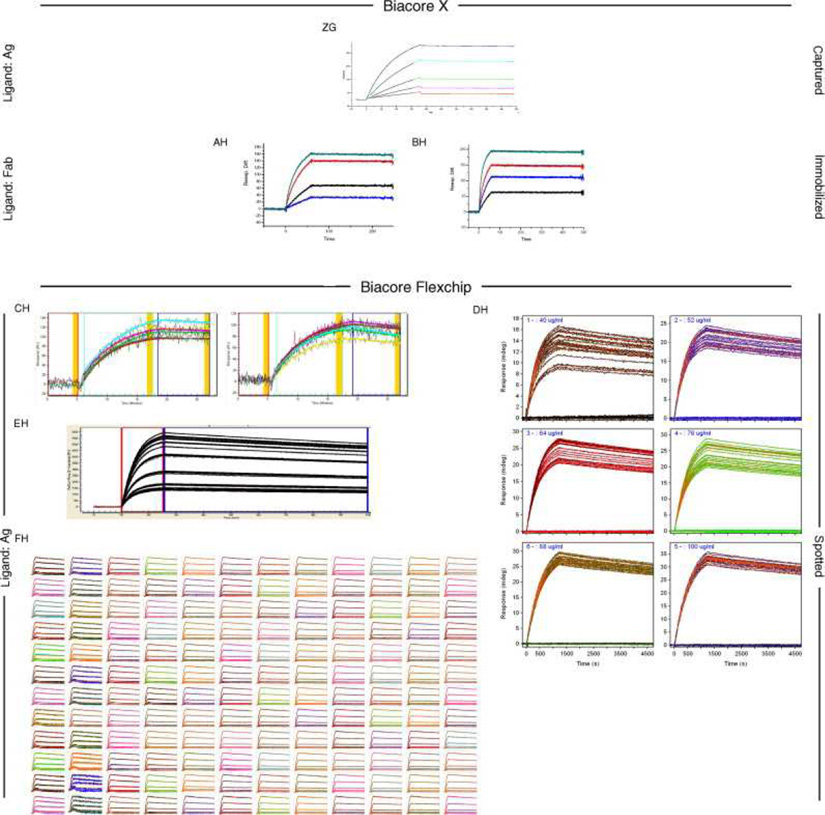
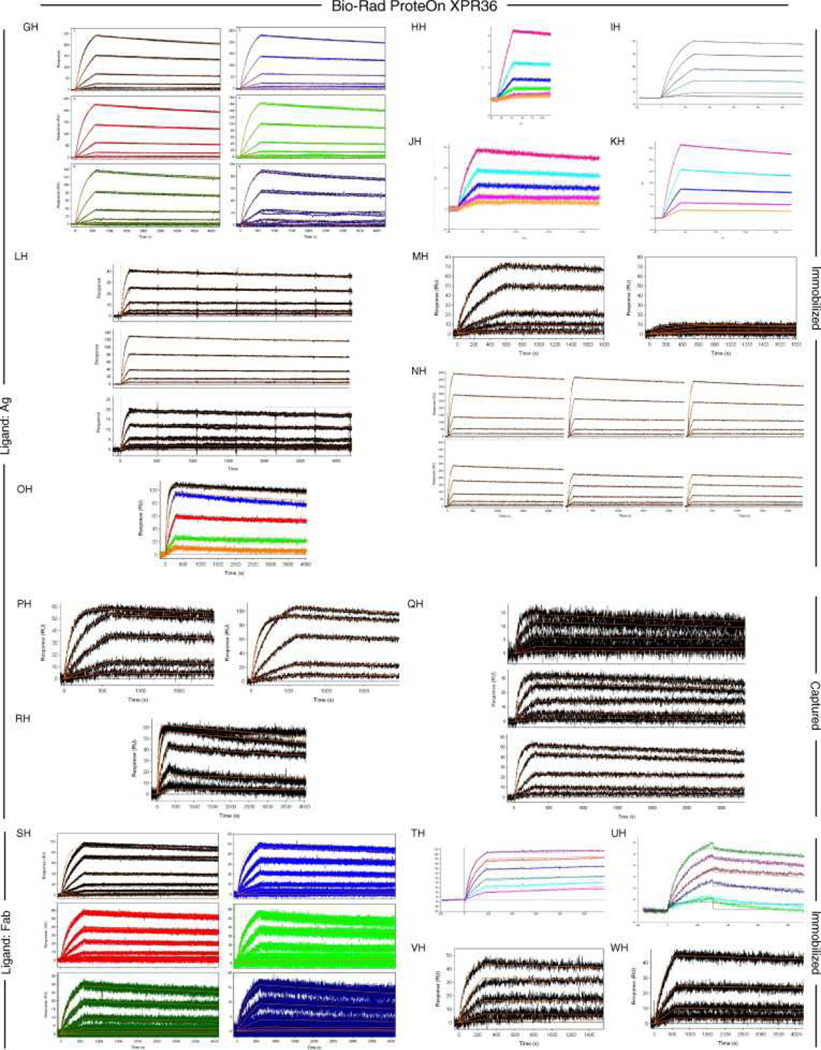
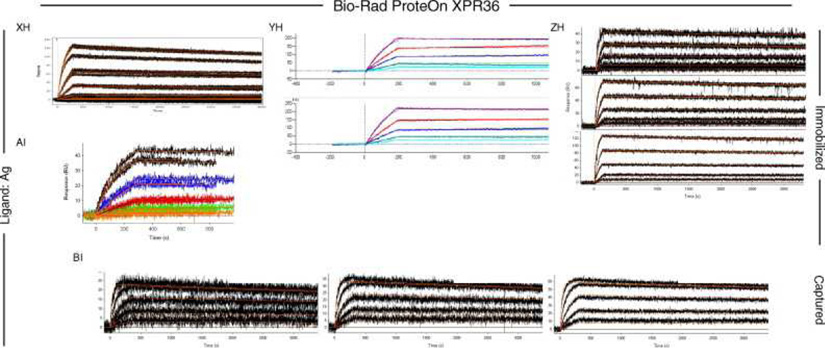
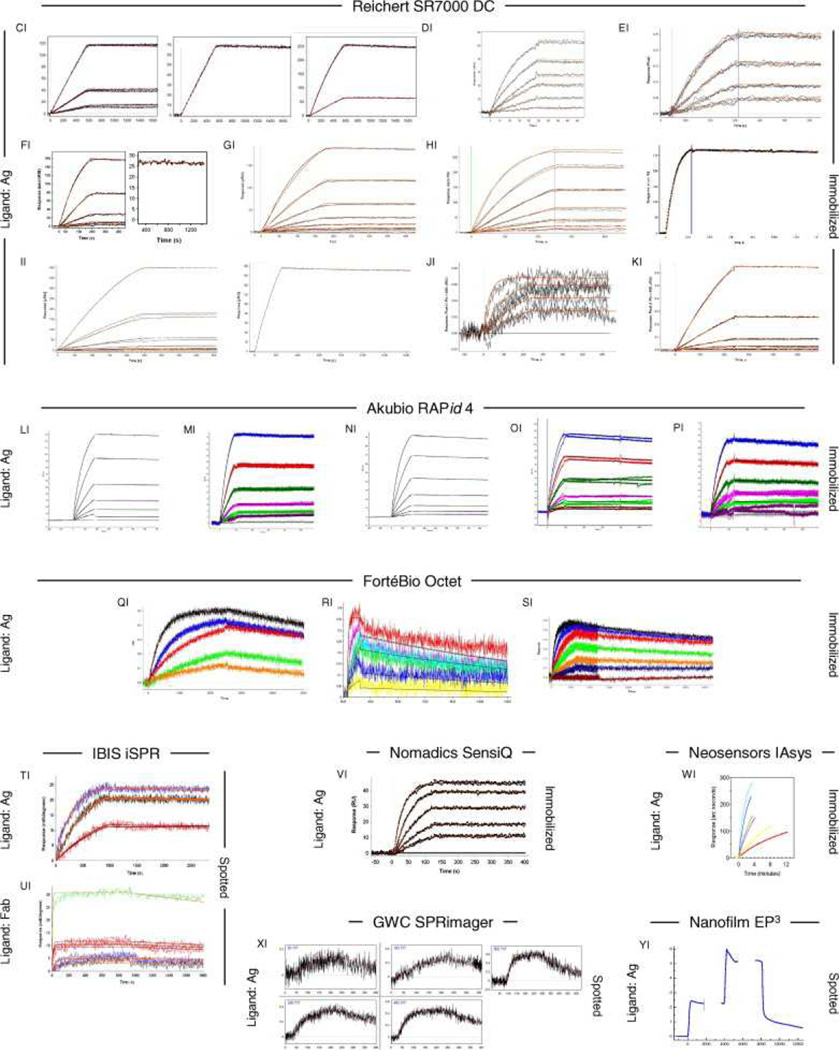
Fig. 6, Fig. 7 and Fig. 8 show all of the participants’ data sets, grouped by instrument used and subgrouped by ligand and immobilization method. (It should be noted that the lettering of the author list and the participant data sets are not related). Although most participants tested the interaction on one surface, several Biacore users collected responses from three ligand surfaces in standard Biacore platforms (e.g., Fig. 6A, P, DA, BC, and ZE) or up to 144 spots in the Flexchip analyses (Fig. 6DH and FH). Similarly, some Bio-Rad users took advantage of the ProteOn XPR36’s ability to monitor six interactions in parallel (Fig. 7GH, NH, and SH).
Fig. 6.
Data sets submitted by participants using Biacore instruments. Participants A–D used Biacore A100, participants E to KA used Biacore T100, participants LA to SA used Biacore S51, participants TA to QD used Biacore 3000, participants RD to PG used Biacore 2000, participants QG and RG used Biacore 1000, participants SG and TG used Biacore X100, participants UG to BH used Biacore X, and participants CH to FH used Biacore Flexchip. The choice of ligand immobilized (Ag or Fab) is indicated on the left. The method of tethering the ligand to the surface (immobilization, capture, or spotting) is indicated on the right. RU, resonance units.
Fig. 7.
Data sets submitted by participants using the Bio-Rad ProteOn XPR36 instrument. The choice of ligand immobilized (Ag or Fab) is indicated on the left. The method of tethering the ligand to the surface (immobilization or capture) is indicated on the right. RU, resonance units.
Fig. 8.
Data sets submitted by participants using other manufacturers’ instruments. The choice of ligand immobilized (Ag or Fab) is indicated on the left. The method of tethering the ligand to the surface (immobilization, capture, or spotting) is indicated on the right. RU, resonance units.
Even with a brief glance at these figures, we see that overall the binding profiles are very similar across the panel (regardless of which instrument was used and which binding partner was tethered to the surface). In fact, all but 1 of the 259 data sets (Fig. 6HC) contained interpretable responses. In addition, Fig. 6, Fig. 7 and Fig. 8 illustrate the range of the participants’ experimental parameters, (e.g., assay format, immobilization densities, dilution series) and, in some cases, the reproducibility of replicate analyses.
Data analysis
In the data sets returned by the participants (Fig. 6, Fig. 7 and Fig. 8), 94% included an overlay of the data with the fit of an interaction model. A visual inspection of the plots shows that most of the data sets fit well to the chosen model. The overwhelming majority of participants fit their data using either a simple or mass transport-limited 1:1 model. However, a few participants fit their data with models that were more complex than 1:1. For example, a few data sets (e.g., Fig. 6MB and YC and Fig. 7TH) were fit using a drifting baseline model. But the application of a drifting baseline model can provide misleading results; in fact, all of the affinities obtained using this model were weaker than the average (up to 30-fold). Alternatively, four participants used a heterogeneous or bivalent fitting model (e.g., Fig. 6GA and KA), most likely to account for the slight complexity, which arises from nonspecific binding, that was detected at their higher analyte concentrations.
Reported rate constants
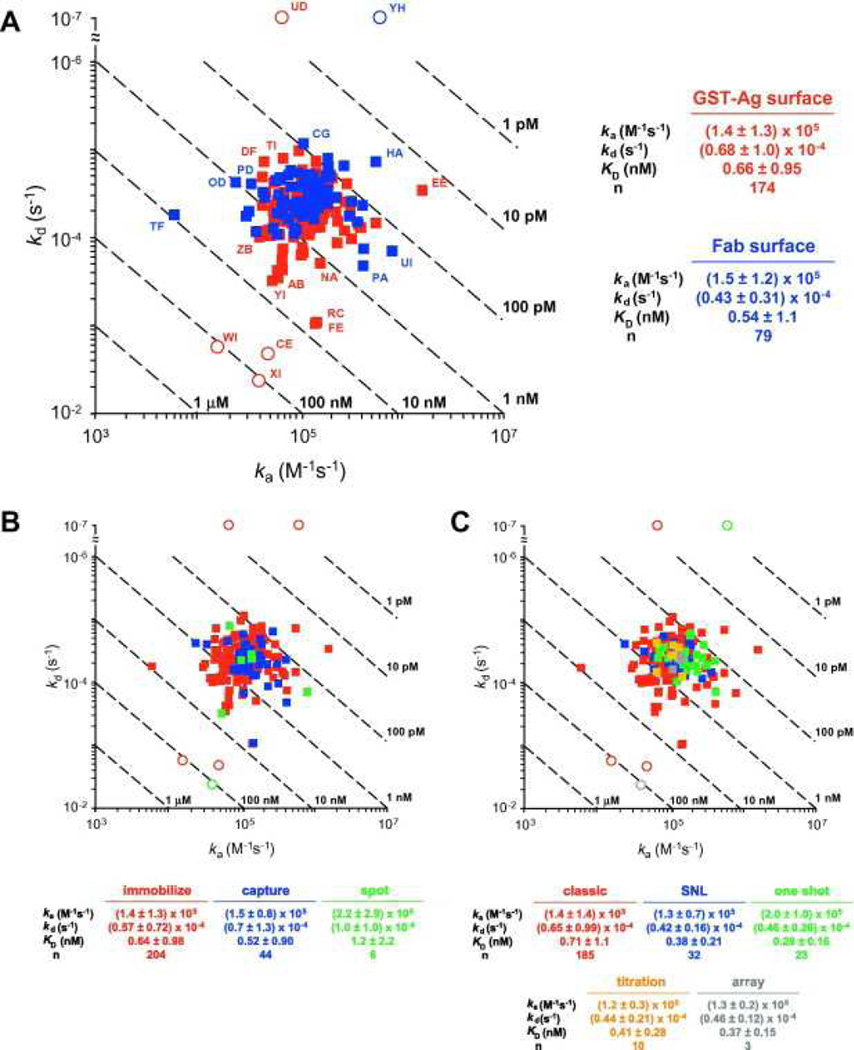
Fig. 9A provides a visual summary of the kinetics reported by the participants. In this kd versus association rate constant (ka) plot, the rate constants produce an expected Gaussian distribution. We have labeled many of the outliers on this plot so that the reader can look at the quality of data associated with these results. We highlighted five particularly egregious outliers (shown as circles in Fig. 9A) that produced off rates that differed from the average by 100-fold or more, a result of not observing decay in the dissociation phase, significant baseline drift, or both. For example, two data sets displayed unusually slow off rates (Fig. 6UD and Fig. 7YH). In modeling these data, the fitting algorithms had difficulty in defining the off rate because no decay in the dissociation phase was apparent (instead, upward drift is obvious in Fig. 7YH). Conversely, downward drift is most likely the cause of the unusually fast off rates reported for the data in Figs. 6CE and 8XI. From the data shown in Fig. 8XI, we cannot confirm that the instrument was drifting prior to the analysis, but in our experience we have found that initial drifting baselines are common in array biosensors and that these systems require significant time to establish a stable baseline. Finally, the data set in Fig. 8WI contains only association phase data. It is challenging to define the kd for a slowly dissociating system without collecting some data points in the dissociation phase.
Fig. 9.
kd versus ka plots of the kinetic parameters determined by the participants. Dashed diagonals depict isoaffinity lines. Circles indicate the five data sets omitted from the statistical analysis. (A) Analyses of Ag surfaces are shown in red, and Fab surfaces are shown in blue. Data sets peripheral to the central cluster are noted by participant assignment. (B) Analyses grouped by ligand tethering method. (C) Analyses grouped by assay design. In each panel, the average and standard deviation for each group are listed below the plot. (For interpretation of color mentioned in this figure the reader is referred to the web version of the article.)
The remaining 253 data sets were included in our statistical analyses of the reported rate constants. Therefore, the overall kinetics determined for this interaction were ka = (1.4 ± 1.3) × 105 M−1 s−1,kd = (6.1 ± 8.7) × 10−5 s−1, and equilibrium dissociation constant (KD) = 0.62 ± 0.98 nM. As illustrated by the number of data points that lie on the periphery of (or beyond) the central cluster in Fig. 9A, omitting only five data points was a conservative approach and, not surprisingly, produced large standard deviations in the overall averages. In the figure, some of the peripheral data points are labeled according to the data set assignments shown in Fig. 6. By examining the responses in these selected data sets, it is apparent that the design and/or execution of many of these experiments could be optimized (e.g., by extending the association phase and/or dissociation phase, testing lower analyte concentrations, and eliminating instrument drift).
In Fig. 9A, the reported kinetics are also grouped by which binding partner was immobilized on the surface. Overall, the parameters determined from the Ag and Fab surfaces overlay well and display a similar distribution range, thereby establishing that the kinetics were independent of which binding partner was immobilized. This system, therefore, is an example that refutes the skeptic’s argument that even for monomeric interactants the binding constants depend on which molecule is immobilized. Instead, it demonstrates the utility, flexibility, and reliability of affinity biosensors to resolve kinetic parameters when the studies are done properly.
Fig. 9B and C shows the reported kinetic parameters grouped by how the ligand was tethered to the sensor surface and assay format, respectively. These plots indicate that similar rate constants were obtained regardless of whether the ligand was amine coupled, captured (by antibody or streptavidin), or spotted (Fig. 9B). Likewise, the agreement between groups of data points in Fig. 9C demonstrates that all five assay formats illustrated in Fig. 3 produced similar results.
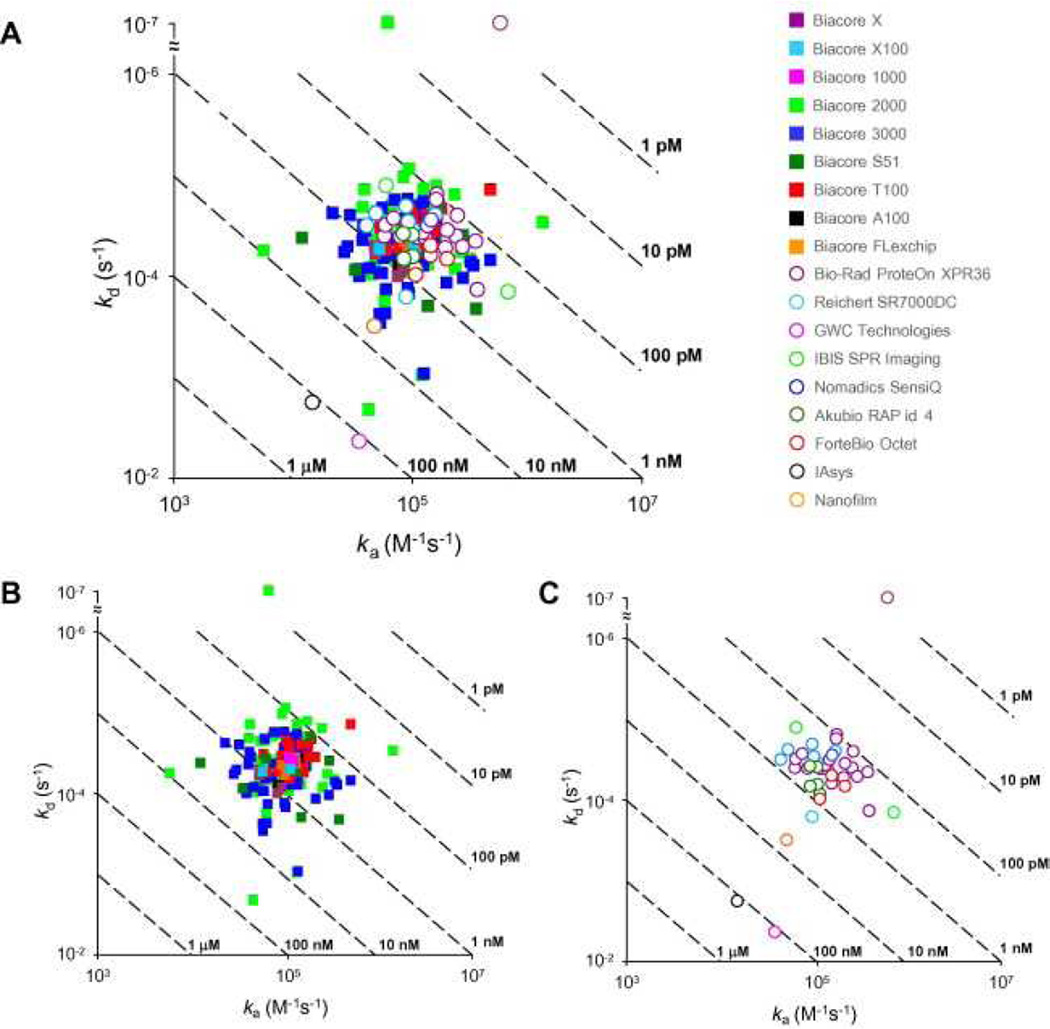
Fig. 10 shows the reported constants grouped by biosensor platform. Although we cannot evaluate the reliability of instruments from which we obtained only one data set (i.e., GWC, IAsys, Nanofilm, and Nomadics), the overlay of data sets from the other 14 platforms demonstrates that the choice of platform did not inherently influence the reported rate constants (Fig. 10A). To better identify the parameters obtained from specific platforms, Fig. 10B and C show only the data from Biacore and other manufacturers, respectively. The average rate constants obtained from each platform are listed in Table 1.
Fig. 10.
kd versus ka plots grouped by biosensor platform. (A) Kinetics obtained from all instrument types. (B) Kinetics obtained from the various Biacore platforms. (C) Kinetics obtained from instruments produced by other manufacturers. Dashed diagonals depict isoaffinity lines. The average and standard deviation for each group are listed in Table 1.
Table 1.
Kinetic constants grouped by biosensor.
| Manufacturer | Platform | n | ka (M−1 s−1) | kd (s−1) | KD (nM) |
|---|---|---|---|---|---|
| Biacore | A100 | 4 | (1.1 ± 0.3) × 105 | (0.60 ± 0.26) × 10−4 | 0.59 ± 0.35 |
| T100 | 33 | (1.4 ± 0.8) × 105 | (0.43 ± 0.14) × 10−4 | 0.36 ± 0.18 | |
| S51 | 8 | (1.7 ± 1.4) × 105 | (0.86 ± 0.75) × 10−4 | 1.1 ± 1.2 | |
| 3000 | 77 | (1.3 ± 0.9) × 105 | (0.75 ± 1.2) × 10−4 | 0.83 ± 1.1 | |
| 2000 | 76 | (1.4 ± 1.7) × 105 | (0.57 ± 1.0) × 10−4 | 0.62 ± 1.2 | |
| 1000 | 2 | (0.82 ± 0.19) × 105 | (1.3 ± 0.7) × 10−4 | 1.8 ± 1.2 | |
| X100 | 2 | (1.26 ± 0.08) × 105 | (0.38 ± 0.03) × 10−4 | 0.30 ± 0.01 | |
| X | 8 | (0.87 ± 0.29) × 105 | (0.65 ± 0.20) × 10−4 | 0.81 ± 0.28 | |
| Flexchip | 4 | (1.2 ± 0.2) × 105 | (0.46 ± 0.10) × 10−4 | 0.39 ± 0.13 | |
| Bio-Rad | ProteOn XPR36 | 21 | (2.0 ± 1.0) × 105 | (0.43 ± 0.25) × 10−4 | 0.25 ± 0.13 |
| Reichert | SR7000 DC | 9 | (1.0 ± 0.4) × 105 | (0.43 ± 0.44) × 10−4 | 0.46 ± 0.43 |
| Akubio | RAPid 4 | 5 | (1.1 ± 0.1) × 105 | (0.58 ± 0.20) × 10−4 | 0.52 ± 0.14 |
| ForteBio | Octet | 3 | (1.7 ± 0.6) × 105 | (0.70 ± 0.22) × 10−4 | 0.45 ± 0.26 |
| IBIS | iSPR | 2 | (4.4 ± 5.2) × 105 | (0.78 ± 0.93) × 10−4 | 0.18 ± 0.35 |
| GWC | SPRimager | 1 | 0.41 × 10⁵ | 42 × 10−4 | 100 |
| Neosensors | IAsys | 1 | 0.16 × 10⁵ | 17 × 10−4 | 110 |
| Nanofilm | EP3 | 1 | 0.54 × 10⁵ | 3.1 × 10⁻⁴ | 5.7 |
| Nomadics | SensiQ | 1 | 1.72 × 10⁵ | 0.27 × 10⁻⁴ | 0.16 |
| Average | 258 | (1.4 ± 1.3) × 105 | (0.61 ± 0.87) × 10−4 | 0.62 ± 0.98 |
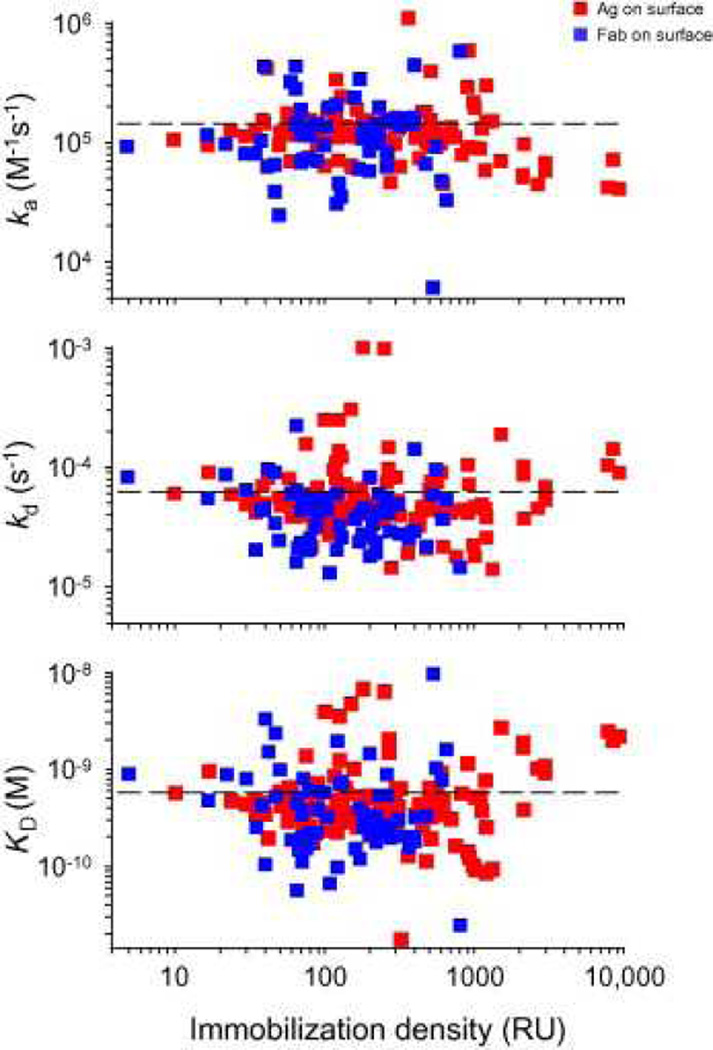
In Fig. 11, the reported constants are plotted against immobilization density. Even though some participants prepared particularly high-density surfaces (up to 9000 resonance units [RU]), the rate constants and affinities, for the most part, are randomly distributed about the average (shown at the dotted lines) across the very wide range of immobilization densities. Although at the highest densities (>2000 RU) the rate constants overall begin to deviate from the average, the lack of an apparent trend in each panel of Fig. 11 confirms that mass transport did not influence these interaction kinetics.
Fig. 11.
Kinetic parameters plotted against immobilization density. Ag surfaces are indicated in red, and Fab surfaces are indicated in blue. In each panel, the dashed line indicates the average determined value. RU, resonance units. (For interpretation of color mentioned in this figure the reader is referred to the web version of the article.)
But the plots in Fig. 11 do not indicate how well the reported rate constants actually describe the obtained binding responses. Typically, at high immobilization densities, the fit of a 1:1 interaction model can be suboptimal. Likewise, a simple interaction model tended to better describe the responses collected from Ag surfaces compared with Fab surfaces. As several participants noted, testing the GST-tagged Ag binding to Fab surfaces could introduce avidity effects. This effect is apparent in the comparison of Fig. 7GH and SH; the model overlays the responses in Fig. 7GH better than in Fig. 7SH even though the Ag surface densities in the former are higher than the Fab surface densities in the latter. From these studies overall, the best fits were obtained when participants tested the Fab binding to relatively low-density Ag surfaces.
Discussion
Benchmark studies are an important tool to educate biosensor users and the overall scientific community. Unlike previous studies, this time we did not provide a detailed protocol for the participants to follow. Instead, they each selected an assay format and immobilization method, performed preliminary binding tests and the full kinetic analysis, and submitted a detailed report that described their experimental approach, challenges, and results.
Although the deviations in the overall rate constants are larger here than in previous benchmark studies (due to the experimental flexibility that we gave the participants), we were pleased by the quality of most of the returned data sets. Several features illustrate the care that participants invested in these experiments. For example, many data sets include replicate analyte injections that demonstrate the reproducibility of the analysis. Also, a number of participants tested the interaction in both orientations and found the rate constants to be independent of which binding partner was chosen as the ligand. We were surprised to find that so many participants successfully performed the both-orientation experiment given that getting matching rate constants requires using particularly low-density Fab surfaces to minimize bivalent binding by the GST–Ag analyte (looking at the data sets in detail revealed that the best fits were obtained when the Fab in solution was tested against the GST–Ag surface). Several participants compared the rate constants obtained when the ligand was captured on or covalently coupled to the sensor surface and found that the two approaches gave similar results. Although this similarity might not be universal, the criticism that immobilization via amine coupling changes the inherent activity is not true for this pair of binding partners. Finally, nearly all participants recognized the importance of showing their binding data overlaid with the model fit. These figures provided valuable information about the reliability of the reported rate constants.
Of course, not all was perfect. In some cases, the instrument performance and/or the choice of experimental parameters could have been further optimized. For example, instrument drift produced responses that did not resemble the data pool at large. When these responses were fit to a drifting baseline model, the model overlays the data well but yielded erroneous rate constants. It would have been better if these participants had eliminated the drift experimentally rather than fitting the drifting baseline. Another significant problem was collecting too little data. The analyte injection needed to be long enough to observe curvature, and the dissociation phase needed to be monitored long enough to observe decay in the responses. This curvature and decay allow a modeling algorithm to define the rate constants well.
Overall, we found that the following set of conditions produces the most reliable responses and rate constants for this type of interaction. Stabilize the biosensor fully by priming extensively with buffer to ensure that the baseline does not drift. Prepare low-density (<100 RU) surfaces of the GST-tagged protein even though the system is not mass transport-limited (this approach minimizes avidity and potential crowding effects). Inject the analyte for a relatively long time (≥15 min). Collect wash phase data for at least 1 h to observe significant dissociation of this stable complex. Test replicate analyte injections to evaluate the stability of the binding partners and the suitability of the regeneration condition. Fit the responses to a 1:1 interaction model.
This benchmark study has demonstrated that reliable rate constants are obtainable by independent investigators using a range of biosensor technologies. We caution, however, that to some extent the ability of this group to generate high-quality data is not reflective of the average biosensor user’s skill level. These participants responded to a mass e-mail that we sent to our contacts, who are often individuals with some connection to our group (e.g., through workshops, collaborations, and/or general interest) and would be considered well-connected users. They also clearly have an interest in learning more about the biosensor technology, as evidenced by their willingness to participate actively in these studies. We are pleased to have such a large number of volunteers from around the world dedicate time and effort to this project. It is educational for us, for them, and for the general scientific community.
Acknowledgements
We thank KaloBios Pharmaceuticals for providing the purified Fab and GST–Ag, Biacore/GE Healthcare for providing sensor chips to help develop this model system, and Bio-Rad Laboratories for shipping all of the sample sets worldwide.
Abbreviations used
- GST
glutathione S-transferase
- SPR
surface plasmon resonance
- BSA
bovine serum albumin
- SNL
short-‘n-long
- kd
dissociation rate constant
- SDS
sodium dodecyl sulfate
- ka
association rate constant
- KD
equilibrium dissociation constant
- RU
resonance units
References
- 1.Rich RL, Myszka DG. Survey of the year 2005 commercial optical biosensor literature. J. Mol. Recognit. 2006;19:478–534. doi: 10.1002/jmr.808. [DOI] [PubMed] [Google Scholar]
- 2.Rich RL, Myszka DG. Survey of the year 2006 commercial optical biosensor literature. J. Mol. Recognit. 2007;20:300–366. doi: 10.1002/jmr.862. [DOI] [PubMed] [Google Scholar]
- 3.Rich RL, Myszka DG. Survey of the year 2007 commercial optical biosensor literature. J. Mol. Recognit. 2008;21:355–400. doi: 10.1002/jmr.928. [DOI] [PubMed] [Google Scholar]
- 4.Day YSN, Baird CL, Rich RL, Myszka DG. Direct comparison of equilibrium, thermodynamic, and kinetic rate constants determined by surface- and solution-based biophysical methods. Prot. Sci. 2002;11:1017–1025. doi: 10.1110/ps.4330102. [DOI] [PMC free article] [PubMed] [Google Scholar]
- 5.Myszka DG, Abdiche YN, Arisaka F, Byron O, Eisenstein E, Hensley P, Thomson JA, Lombardo CR, Schwarz F, Stafford W, Doyle ML. The ABRF–MIRG’02 Study: assembly state, thermodynamic, and kinetic analysis of an enzyme/inhibitor interaction. J. Biomol. Tech. 2003;14:247–269. [PMC free article] [PubMed] [Google Scholar]
- 6.Navratilova I, Papalia GA, Rich RL, Bedinger D, Brophy S, Condon B, Deng T, Emerick AW, Guan H-W, Hayden T, Heutmekers T, Hoorelbeke B, McCroskey MC, Murphy MM, Nakagawa T, Parmeggiani F, Qin X, Rebe S, Tomasevic N, Tsang T, Waddell MB, Zhang FF, Leavitt S, Myszka DG. Thermodynamic benchmark study with Biacore technology. Anal. Biochem. 2007;364:67–77. doi: 10.1016/j.ab.2007.01.031. [DOI] [PubMed] [Google Scholar]
- 7.Cannon MJ, Papalia GA, Navratilova I, Fisher RJ, Roberts LR, Worthy KM, Stephen AG, Marchesini GR, Collins EJ, Casper D, Qiu H, Satpaev D, Liparoto SF, Rice DA, Gorshkova II, Darling RJ, Bennett DB, Sekar M, Hommema E, Liang AM, Day ES, Inman J, Karlicek SM, Ullrich SJ, Hodges D, Chu T, Sullivan E, Simpson J, Rafique A, Luginbuhl B, Westin SN, Bynum M, Cachia P, Li YJ, Kao D, Neurauter A, Wong M, Swanson M, Myszka DG. Comparative analyses of a small molecule/enzyme interaction by multiple users of Biacore technology. Anal. Biochem. 2004;330:98–113. doi: 10.1016/j.ab.2004.02.027. [DOI] [PubMed] [Google Scholar]
- 8.Katsamba PS, Navratilova I, Calderon-Cacia M, Fan L, Thornton K, Zhu M, Bos TV, Forte C, Friend D, Laird-Offringa I, Tavares G, Whatley J, Shi E, Widom A, Lindquist KC, Klakamp S, Drake A, Bohmann D, Roell M, Rose L, Dorocke J, Roth B, Luginbuhl B, Myszka DG. Kinetic analysis of a high-affinity antibody/antigen interaction performed by multiple Biacore users. Anal. Biochem. 2006;352:208–221. doi: 10.1016/j.ab.2006.01.034. [DOI] [PubMed] [Google Scholar]
- 9.Papalia GA, Leavitt S, Bynum MA, Katsamba PS, Wilton R, Qiu H, Steukers M, Wang S, Bindu L, Phogat S, Giannetti AM, Ryan TE, Pudlak VA, Matusiewicz K, Michelson KM, Nowakowski A, Pham-Baginski A, Brooks J, Tieman B, Bruce BD, Vaughn M, Baksh M, Cho YH, De Wit M, Smets A, Vandersmissen J, Michiels L, Myszka DG. Comparative analysis of ten small molecules binding to carbonic anhydrase II by different investigators using Biacore technology. Anal. Biochem. 2006;359:94–105. doi: 10.1016/j.ab.2006.08.021. [DOI] [PubMed] [Google Scholar]
- 10.Papalia GA, Baer M, Luehrsen K, Nordin H, Flynn P, Myszka DG. High-resolution characterization of antibody fragment/antigen interactions using Biacore T100. Anal. Biochem. 2006;359:112–119. doi: 10.1016/j.ab.2006.08.032. [DOI] [PubMed] [Google Scholar]
- 11.Bravman T, Bronner V, Lavie K, Notcovich A, Papalia GA, Myszka DG. Exploring “one-shot” kinetics and small molecule analysis using the ProteOn XPR36 array biosensor. Anal. Biochem. 2006;358:281–288. doi: 10.1016/j.ab.2006.08.005. [DOI] [PubMed] [Google Scholar]
- 12.Abdiche Y, Malashock D, Pinkerton A, Pons J. Determining kinetics and affinity of protein interactions using a parallel real-time label-free biosensor, the Octet. Anal. Biochem. 2008;377:209–217. doi: 10.1016/j.ab.2008.03.035. [DOI] [PubMed] [Google Scholar]
- 13.Karlsson R, Katsamba PS, Nordin H, Pol E, Myszka DG. Analyzing a kinetic titration series using affinity biosensors. Anal. Biochem. 2006;349:136–147. doi: 10.1016/j.ab.2005.09.034. [DOI] [PubMed] [Google Scholar]
- 14.Rich RL, Cannon MJ, Jenkins J, Pandian P, Sundaram S, Magyar R, Brockman J, Lambert J, Myszka DG. Extracting kinetic rate constants from surface plasmon resonance array systems. Anal. Biochem. 2008;373:112–120. doi: 10.1016/j.ab.2007.08.017. [DOI] [PubMed] [Google Scholar]


