

Abstract
Down-regulation of hMSH3 is associated with elevated microsatellite alterations at selected tetranucleotide repeats and low levels of microsatellite instability in colorectal cancer (CRC). However, the mechanism that down-regulates hMSH3 in CRC is not known. In this study, a significant association between over-expression of glucose transporter 1, a marker for hypoxia, and down-regulation of hMSH3 in CRC tissues was observed. Therefore, we examined the effect of hypoxia on the expression of hMSH3 in human cell lines. When cells with wild type p53 (wt-p53) were exposed to hypoxia, rapid down-regulation of both hMSH2 and hMSH3 occurred. In contrast, when null or mutated p53 (null/mut-p53) cells were exposed to hypoxia, only hMSH3 was down-regulated, and at slower rate than wt-p53 cells. Using a reporter assay, we found that disruption of the two putative hypoxia response elements (HREs) located within the promoter region of the hMSH3 abrogated the suppressive effect of hypoxia on reporter activity regardless of p53 status. In an EMSA, two different forms of HIF-1α complexes that specifically bind to these HREs were detected. A larger complex containing HIF-1α predominantly bound to the HREs in hypoxic null/mut-p53 cells whereas a smaller complex predominated in wt-p53 cells. Finally, HIF-1α knockdown by siRNA significantly inhibited down-regulation of hMSH3 by hypoxia in both wt-p53 and mut-p53 cells. Taken together, our results suggest that the binding of HIF-1α complexes to HRE sites is necessary for down-regulation of hMSH3 in both wt-p53 and mut-p53 cells.
Keywords: hMSH3, Down-regulation, Hypoxia, HIF-1, p53, Colorectal cancer
1. Introduction
The DNA mismatch repair (MMR) system contributes to genetic stability by correcting errors during DNA synthesis, preventing improper recombination, and participating in cellular events induced by DNA damaging agents (reviews in [1–3]). An individual who is a carrier of germline mutations in MMR genes, such as the human MutL homolog 1 (hMLH1) or human MutS homolog 2 (hMSH2), will be predisposed to Lynch syndrome. Epigenetic silencing of hMLH1 is observed in a fraction of sporadic colorectal cancer (CRC) with high levels of microsatellite instability (MSI-H) [4–6]. In sporadic CRC, some tumors exhibit low levels of MSI (MSI-L) [6] and/or elevated microsatellite alterations at selected tetranucleotide repeats (EMAST) [7]. EMAST has been reported at varying frequencies in a variety of cancers including non-small cell lung cancer (NSCLC) [7,8], cancers of the head and neck [8], bladder [8–10], kidney [8], non-melanoma skin [9], prostate [11], serous ovarian [12] and colon and rectal [13–16]. We previously demonstrated that EMAST is exhibited by 50% to 60% of primary sporadic CRC [13,14] and loss of the human MutS homolog 3 (hMSH3) results in EMAST and MSI-L in CRC cell lines [13]. Furthermore, EMAST and MSI-L are significantly associated with down-regulation of hMSH3 in CRC tissues [13,15]. However, the mechanism(s) by which hMSH3 in CRC tissues are down-regulated is not known. Because hypoxia is common in solid tumor tissues [17] and it induces down-regulation of MMR genes in tissue-cultured cell lines, including hMLH1 [18], hMSH2 [19], hMSH6 [19] and hMSH3 [20], it was hypothesized that hypoxia could be one such mechanism. In this study, we first examined the expression of glucose transporter 1 (GLUT1), a marker for hypoxia [21], and determined its relationship to hMSH3 expression and EMAST in CRC tissues. We then investigated the effect of hypoxia on hMSH3 gene expression at mRNA and protein levels in cultured human cell lines derived from CRC and other origins. To understand how hypoxia modulates hMSH3 expression, we cloned the promoter region of hMSH3 and identified critical regions for the transcription of hMSH3 in response to hypoxia. Our results show that hypoxia down-regulates hMSH3 in CRC cell lines and suggest that down-regulation of hMSH3 in CRC tissues is likely caused by hypoxia which may result in EMAST and MSI-L.
2. Materials and methods
2.1. CRC tissue samples and immunohistochemistry (IHC)
Twenty-six randomly selected sporadic CRCs were collected from patients treated at Toho University’s Ohmori Hospital (Tokyo) and two CRC tissues were collected at the University of California San Diego under IRB approval. The level of hMSH3 expression and the MSI status of these tissues have been previously described [13,14,22]. Paraffin-embedded tissues were deparaffinized and rehydrated, followed by antigen retrieval (121 °C for 15 min in 0.01 M citrate buffer, pH 6.0). The tissues were incubated with an anti GLUT1 mouse monoclonal antibody (LAB VISION, Fremont, CA) overnight at 4 °C, followed by treatment with a secondary antibody. Staining was developed by diaminobenzide chromogen and counterstained with hematoxylin. The brown and blue signals indicate the presence (brown) or absence (blue) of GLUT1 immunoreactivity. The expression of GLUT1 was scored at three levels: when GLUT1 protein was detected in more than 50% of the tumor tissue area, we scored it over-expression (++); when signals were detected in less than 50% of area, we scored it positive (+); and when signals were not detected in most of the tumor tissues or were detected only sporadically within a tissue, we scored it positive/negative (+/−).
2.2. Cells and cell culture
The human CRC cell lines SW480 and SW620, and the human cervical cancer cell line HeLa S3 were obtained from American Type Culture Collection (Rockville, MD). The human CRC cell line colo320DM and the human neuroblastoma cell lines, GOTO and TGW, were obtained from the Japanese Cell Resources Bank (Osaka). The human embryonic kidney (HEK) 293 cell line and the human breast adenocarcinoma cell line MCF-7 were provided by Akimitsu Takagi of the Yakult Central Institute (Tokyo). HCT116+5 and HCT116+3+5 were established as described [13,23]. p53 knockout HCT116 (null-p53 HCT116) [24] was provided by Bert Vogelstein. p53 knockout HCT116 with wild type hMSH3 (null-p53 HCT116+5) was constructed by the transfer of normal human chromosome 5 to null-p53 HCT116 via micro-cell fusion [25]. Cells were grown in minimum essential medium (MEM) or RPMI 1640 medium supplemented with 10% fetal bovine serum at 37 °C in 5% CO2 in air in a humidified atmosphere. In hypoxia, cells were cultured in 5% CO2 in 0.1% O2, where the O2 concentration was controlled by Pro:ox model 110 (BioSopherix, New York, NY). The cells were continuously treated by hypoxia until they were harvested for the next experiments.
2.3. Quantitative reverse-transcription polymerase chain reaction (qRT-PCR)
mRNA was quantified by qRT-PCR. Exponentially growing cells at the initial density of 1×10⁶ were cultured in a 10-cm dish at 37 °C. After 48 hrs, the dish was placed in a normoxic or hypoxic (0.1% O2) chamber. Total RNA was extracted by the RNeasy Mini kit (Qiagen, Germantown, MD), and the Takara one step SYBR primescript plus RT-PCR kit (Takara Bio Co., Otsu, Shiga, Japan) was used for the subsequent cDNA synthesis and RT-PCR reactions. Each sample was amplified in triplicate and analyzed by the Applied Biosystems 7500 Fast Realtime PCR system (Life Technologies Inc., Carlsbad, CA). For normalization, ribosomal 18S was used [26]. The primer sequences used in this study are listed in Supplementary Table 1.
2.4. Western blotting
Cells at an initial cell density of 1×10⁶ cells per 10-cm dish were cultured for 2 days in normoxia and then in hypoxia (0.1% O2). After the indicated days of hypoxia, cells were harvested, cell lysate was prepared and Western blotting analysis was performed as described [27]. Heat-denatured cell lysates were applied and separated on a sodium dodecylsulfate (SDS)-polyacrylamide gel. Mouse monoclonal antibodies against hMSH3 (BD Biosciences, San Jose, CA), hMSH2 (SAD4) [28], and hypoxia-inducible factor (HIF)-1α (BD Biosciences) were used as the primary antibodies to detect each protein. α-tubulin was used as a loading control and detected by a mouse monoclonal antibody against α-tubulin (Sigma-Aldrich, St. Louis, MO). The blots were treated with the ECL-plus system (Amersham Pharmacia Biotech, Inc.) and separated proteins were visualized and quantified by a luminescent image analyzer, LAS-1000plus (Fuji Film Co., Tokyo).
2.5. Transfection of a p53 expression plasmid
Exponentially growing cells at the initial cell density of 2×10⁵ cells/well in a 6-well plate were cultured for 48 hrs and were transfected with 1 μg of pCEP4 or a p53 expressing plasmid, pXZ53WT constructed from pCEP4 [29] using lipofectin (Invitrogen, Life Technologies Inc., Carlsbad, CA). After 16 hrs, cultures were replaced with fresh medium and incubated for an additional 24 hrs. The cells were then cultured for another 48 hrs in normoxia or hypoxia.
2.6. Reporter gene plasmids and luciferase assay
Reporter plasmids with various DNA fragments spanning from −3102 to +50 relative to the transcription initiation site of the hMSH3 gene were constructed. Each fragment was amplified from the genomic DNA by PCR. Primer sequences have been listed in Supplementary Table 2. PCR products were ligated into the pGL3-Basic vector (Promega Co., Madison, WI). Three hypoxia response element (HRE) mutant plasmids were constructed using a Takara primeSTAR mutagenesis basal kit (Takara Bio Co.). The sequence of the first HRE1 (GCGTG) was mutated to GCATA and the second HRE2 (ACGTG) was mutated to TTTTG. All inserts and mutations were verified by DNA sequencing. Luciferase activities were measured as described [29]. All reporter assays were done in triplicate.
2.7. RNA interference
Cells (3×10⁵ cells/well) were cultured for 24 hrs in a 6-well plate and were transfected with 150 pmoles of small interfering RNA (siRNA) oligomer (Invitrogen) for HIF-1α (5′-AGUUAGUUCAAACUGAGUUAAUCCC-3′) or a negative control RNA oligomer (Negative Universal Control Low #3, Invitrogen) using lipofectamin 2000 (Invirogen). After transfection, cells were cultured in normoxia for 24 hrs and then placed under normoxia or hypoxia.
2.8. Electrophoretic mobility shift assay (EMSA)
EMSA was performed as described previously [30]. Briefly, double-strand oligonucleotide probes (Supplementary Table 3) were prepared with T4 polynucleotide kinase and [γ-32P]-ATP. Nuclear extract (12 μg) was pre-incubated with 0.1 μg poly[dI–dC]•poly[dI–dC] (Sigma Chemical Co., St. Louis, MO, USA) and buffer consisting of 10 mM Tris–HCl, pH7.5, 0.5 mM ethylenediaminetetraacetic acid, 4% glycerol, 50 mM NaCl, and 0.5 mM dithiothreitol in a total volume of 9 μl at 4 °C for 10 min. The radiolabeled probe (1 μl) was added and incubated for 30 min at 25 °C. In the binding competition assay, specific bindings of radio-labeled (hot) wild type HRE1 oligonucleotides probe (WT-HRE1) (TTGCT GCGTG CTTGA TACTT GTTC) to the protein complexes containing HIF-1α were monitored by adding an excess of non-radiolabeled (cold) WT-HRE1 probe (X8, X25 or X50 molar excess), a cold mutated HRE1 probe-1 (MT1-HRE1) (TTGCT TTTTG CTTGA TACTT GTTC) (X25 or X50), a cold another second mutated HRE1 probe-2 (MT2-HRE1) (TTGCT GCATA CTTGA TACTT GTTC) (X25 or X50), a cold wild type HRE2 probe (WT-HRE2) (ACAAA ACGTG TTAAC CCCTT GTGG) (X100) or a cold mutated HRE2 probe (MT-HRE2) (ACAAA TTTTG TTAAC CCCTT GTGG) (X100). In the binding inhibition assay using the anti HIF-1α antibody, the antibody specifically recognizes a DNA binding domain of HIF-1α. The binding reactions were pre-incubated with 2 μg of anti HIF-1α antibody (ab16066, Abcam, Cambridge, UK) for 10 min at 25 °C prior to the addition of the labeled probe. The reaction mixture was subjected to electrophoretic separation. The gels were dried and the binding complexes were visualized by a Typhoon 9400 scanner (GE Healthcare, Life sciences, Uppsala, Sweden).
2.9. Statistical analysis
Statistical significance was determined by the Student t-test (StatView I, Abacus Concepts, Inc., Berkeley, CA) or χ2-test. A P value of less than 0.05 indicates statistical significance.
3. Results
3.1. Down-regulation of hMSH3 is associated with over-expression of GLUT1 in CRC tissues
In our previous study, we demonstrated that EMAST is common in primary sporadic CRC [13,14]. Furthermore, loss of hMSH3 expression in tissue cultured cell lines results in EMAST and MSI-L and there is a significant correlation between EMAST and loss of hMSH3 expression in CRC tumor tissues [13]. However, loss of hMSH3 expression within a tumor tissue is largely heterogeneous and could be reversible [13]. During the course of hMSH3 IHC examination of primary CRC tissues, we have observed that MSH3-negative tumor cells frequently reside near the necrotic area. Because necrosis in a tumor mass is caused by hypoxia and because hypoxia down-regulates MMR proteins [17], we speculate that the observed down-regulation of hMSH3 and its consequence, MSI-L/EMAST, may be caused by hypoxia. To obtain evidence of the connection between hypoxia and down-regulation of hMSH3, and since over-expression of GLUT1 correlates with hypoxia [21], we examined the level of GLUT1 expression in 28 cases of sporadic CRC by IHC staining. The hMSH3 expression and MSI status of these 28 cases had been previously determined [13]. Of 28 CRC tissues examined, 19 CRC tissues over-expressed or were positive for GLUT1 expression and 9 CRC rarely expressed GLUT1 (Table 1, Supplementary Table 5). The representative IHC staining for GLUT1 and hMSH3 is shown in Fig. 1. In non-EMAST CRC tissues, most nuclei were stained positive for MSH3 (Fig. 1A) and there was no cytoplasmic or membranous staining of GLUT1 in the same tissue (Fig. 1B). In contrast, a mixture of MSH3-positive and -negative nuclei was visible in EMAST-positive CRC tissues (Fig. 1C) and over-expression of GLUT1 was detected in the cytoplasm and cell membranes of cancer cells (Fig. 1D). As shown in Table 1, there was a significant correlation between over-expression/positive of GLUT1 and down-regulation of MSH3 in CRC tissues (P=0.002). Likewise over-expression of GLUT1 was also associated with EMAST in CRC tissues (Supplementary Tables 4 and 5, P=0.002). These results support the idea that hypoxia may cause down-regulation of hMSH3, leading to MSI-L/EMAST.
Table 1.
Relationship between expression of GLUT1 and hMSH3.
Fig. 1.

The expression of GLUT1 and hMSH3 in CRC tissues. A: Microsatellite stable CRC tissue positive for nuclear hMSH3 expression. B: Microsatellite stable CRC tissue negative for cytoplasmic GLUT1 expression. C: An EMAST-positive CRC tissue negative for nuclear hMSH3 expression. D: An EMAST-positive CRC tissue over expressing cytoplasmic GLUT1. Despite the presence of non-specific MSH3 signals in the cytoplasm of CRC cells, there was a clear difference between the stained and unstained nucleus by MSH3 IHC (×200, x 630 (insets)).
3.2. Down-regulation of hMSH3 by hypoxia in vitro
We next examined the effect of hypoxia on the expression of hMSH3 in ten human cancer cell lines derived from different origins. The changes in hMSH3 expression at the mRNA and protein levels were monitored 3 days after hypoxia (0.1% O2). We observed three groups of cell lines that responded differently to hypoxia. In the first group, including HCT116+5, HCT116+3+5 and HEK293, a significant reduction in the level of hMSH3 mRNA (~35% of normoxic cells, Table 2) was observed in cells exposed to hypoxia compared to normoxic cells. Reduction in hMSH3 protein was also observed in HCT116+5 (40% of normoxic cells, Fig. 2E), HCT116+3+5 (50%, Supplementary Fig. 1) and HEK293 (66%, Supplementary Fig. 1) at 3 days after hypoxia. In the second group, including colo320DM, HeLa S3, SW480, SW620, and TGW, moderate levels of down-regulation in hMSH3 mRNA (~70%, Table 2) and protein (80–90%, Fig. 2A, Supplementary Fig. 1) were observed by hypoxia. In the third group, including MCF-7 and GOTO, down-regulation of hMSH3 mRNA (Table 2) and protein (Supplementary Fig. 1) was not detected during the 3 days of hypoxia. The difference in response to hypoxia between the first and the second group can be explained by the status of p53, because HCT116+5, HCT116+3+5 and HEK293 contain a wild type p53 whereas colo320DM, HeLa S3, SW480, SW620, and TGW contain mutated p53 [27,31].
Table 2.
hMSH3 downregulation pattern in hypoxia in human cell lines derived from various origins.
| Cell line | Origin | p53 Status | mRNA level, %a
|
Down-regulation pattern | |
|---|---|---|---|---|---|
| Day 1 | Day 3 | ||||
| HCT116+5 | colorectal cancer | wild type | 77.2 | 33.3b * | Rapid |
| HCT116+3+5 | colorectal cancer | wild type | 80.9 | 41.5* | Rapid |
| HEK293 | embryonic kidney | wild type | ntc | 32.6* | Rapid |
| SW480 | colorectal cancer | mutant | 76.9 | 68.8* | Moderate |
| SW620 | colorectal cancer | mutant | 73.8 | 75.3b* | Moderate |
| colo320DM | colorectal cancer | mutant | nt | 73.8 | Moderate |
| HeLa S3 | cervix carcinoma | mutant | nt | 79.4* | Moderate |
| TGW | neuroblastoma | mutant | nt | 69.5* | Moderate |
| GOTO | neuroblastoma | wild type | 107.5 | 96.2 | No |
| MCF-7 | breast adenocarcinoma | wild type | 103.6 | 100.6 | No |
P<0.05
Percentage of the relative mRNA amount in hypoxia was determined by the following formula: Ct at hypoxia/Ct at normoxia×100.
The mRNA level was determined at day 2 in hypoxia.
nt: not tested.
Fig. 2.
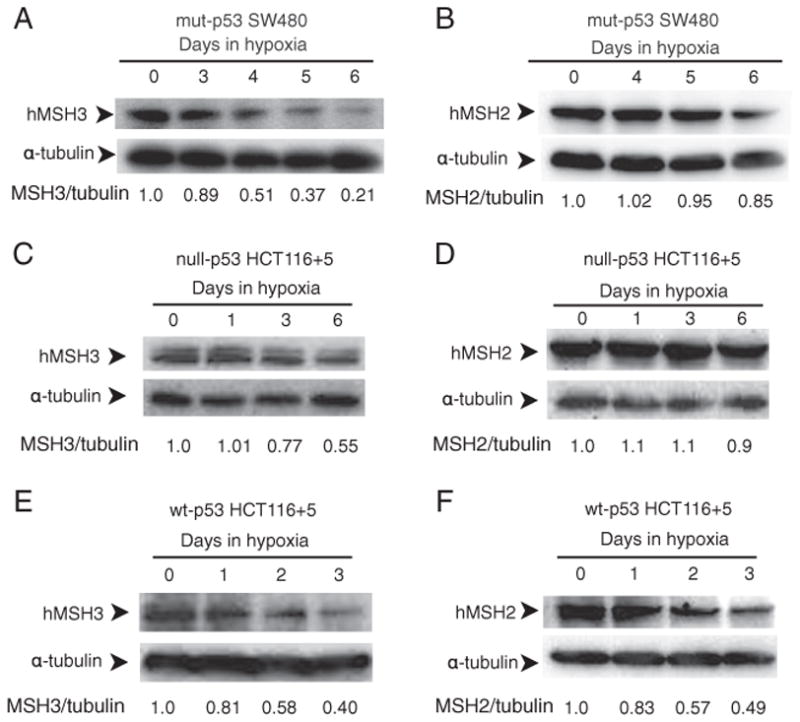
p53-dependent and p53-independent down-regulation of hMSH3 and hMSH2 proteins. A: hMSH3 expressed by normoxic and hypoxic mut-p53 SW480 cells. B: hMSH2 expressed by normoxic and hypoxic mut-p53 SW480 cells C: hMSH3 expressed by normoxic and hypoxic null-p53 HCT116+5 cells. D: hMSH2 expressed by normoxic and hypoxic null-p53 HCT116+5 cells. E: hMSH3 expressed by normoxic and hypoxic wt-p53 HCT116+5 cells. F: hMSH2 expressed by normoxic and hypoxic wt-p53 HCT116+5 cells. A significant reduction in hMSH3 and hMSH2 proteins was observed within 3 days after hypoxia in cells with wt-p53 but not in cells with null- or mut-p53. A significant reduction in hMSH3 but not in hMSH2 was observed in cells with null- or mut-p53 at 6 days after hypoxia.
3.3. p53-Dependent and -independent down-regulation of hMSH3 by hypoxia
To determine whether p53 status influenced expression of hMSH3 in response to hypoxia, we first measured hMSH3 mRNA levels in normoxic and hypoxic SW480 transiently expressing exogenously added wild type p53, and normoxic and hypoxic SW480 that had received an empty vector (Supplementary Fig. 3). The results showed that the presence of wild type p53 in SW480 significantly reduced levels of hMSH3 mRNA in response to hypoxia (Table 3). To further confirm the role of wild type p53 for down-regulation of hMSH3 by hypoxia, we constructed p53 knockout HCT116 (null-p53 HCT116) with wild type hMSH3 (null-p53 HCT116+5) by transferring a normal human chromosome 5 into null-p53 HCT116 via microcell chromosome transfer (Supplementary Fig. 2). We then compared hMSH3 expression in response to hypoxia between wt-p53 HCT116+5 and null-p53 HCT116+5. As shown in Table 3, the absence of p53 clearly reduced the suppressive effect of hypoxia on hMSH3 mRNA. Furthermore, re-introduction of the wild type p53 expression vector into null-p53 HCT116+5 cells recovered the suppressive effect of hypoxia on hMSH3 expression (Table 3). p53-dependent down-regulation of hMSH3 was also observed in protein levels (Fig. 2). A significant reduction in hMSH3 was observed within 3 days after hypoxia in wt-p53 HCT116+5 (Fig. 2E and F) but not in mut-p53 SW480 or null-p53 HCT116+5 (Fig. 2A, B, C and D). Taken together, the above results indicate that there is a p53-dependent pathway to down-regulate hMSH3 expression by hypoxia.
Table 3.
p53-dependent down-regulation of hMSH3 mRNA by hypoxia.
| Cell | p53 Status | Reduction of hMSH3 mRNA, % | P value |
|---|---|---|---|
| SW480+pCEP4 | mutant | 51.8 | 0.003 |
| SW480+pXZ53 | mutant+wild type | 64.8 | |
| HCT116+5 | wild type | 66.8 | 0.01 |
| null-p53 HCT116+5 | null | 32.7 | |
| null-p53 HCT116+5+pCEP4 | null | 40.0 | 0.007 |
| null-p53 HCT116+5+pXZ53 | null+wild type | 57.0 |
The hMSH3 mRNA was quantified by qRT-PCR. P values were determined by Student t-test.
When mut-p53 SW480 and null-p53 HCT116 +5 were cultivated under prolonged hypoxia (0.1% O2, 6 days), significant down-regulation in hMSH3 mRNA (Fig. 3) and protein (Fig. 2A, B, C and D) was observed in these cells. These results indicate that there is a p53-independent pathway to down-regulate hMSH3 expression. Although it has been shown that wild type p53 is required for down-regulation of hMSH2 by short term hypoxia (2 days) [19], it is not known whether hMSH2 is down-regulated in p53-mutant or -null cells under prolonged hypoxia. To address this question, null-p53 HCT116+5 and wt-p53 HCT116+5 were treated with 0.1% O2 for 3 and/or 6 days and expressions of hMSH2 were monitored for protein levels. In wt-p53 HCT116+5, a significant decrease in expression of both hMSH2 and hMSH3 was observed compared to null-p53 HCT116+5 within 3 days after hypoxia (Fig. 2C and D). In contrast, while the MSH3 protein was significantly reduced in null-p53 HCT116 +5 under prolonged hypoxia (6 days), there was no significant reduction in hMSH2 protein in the same cells (Fig. 2C and D). These results confirm the previous observation that down-regulation of hMSH2 by hypoxia is p53-dependent. Our results further demonstrate that down-regulation of hMSH3 can be achieved through p53-dependent and p53-independent pathways, and that the latter pathway may be triggered by prolonged hypoxia.
Fig. 3.

p53-independent down-regulation of hMSH3 mRNA. A: hMSH3 mRNA expressed by normoxic and hypoxic mut-p53 SW480 cells. B: hMSH3 mRNA expressed by normoxic and hypoxic null-p53 HCT116 +5 and wt-p53 HCT116+5 cells. Slow but similar levels of reduction in hMSH3 mRNA was observed after 6 days of hypoxia in null- or mut-p53 cells compared to wt-p53 cells.
3.4. Essential promoter regions for transcription of hMSH3
To explore the mechanism by which hypoxia controls the expression of the hMSH3, we next determined the promoter region(s) essential for transcription of hMSH3 locus using a reporter gene assay. Six reporter plasmids covering −3102 to +20 relative to the transcription initiation site were constructed (Fig. 4A). Luciferase activity of each construct was monitored in SW620 and HeLa S3. Reporter pGL3-MSH3-2658-20 having a region between −2658 and +20 showed the highest luciferase activity. The activity of this construct in SW620 and HeLa S3 was 3- to 4.7-fold higher than the activity of the reporter pGL3-MSH3-2480-20 having a region between −2480 and +20 (Fig. 4A). The reporter pGL3-MSH3-3102-20 having a region between −3102 and +20 showed 78% of the activity of the pGL3-MSH3-2658-20 and this difference was significant (SW620: P=0.04, HeLa S3: P=0.03). Thus, the results suggest that a binding site for a repressor protein may exist within the region between −3102 and −2658. When pGL3-MSH3-2480-20 was tested in both SW620 and HeLa S3, a significant reduction in reporter activity was observed (Fig. 4A). Similarly, other three reporter constructs missing the region spanning −2658 to −2480 showed basal activities. These results indicate that the region between −2658 and −2480 contains an enhancer element essential for hMSH3 transcription. The core promoter of hMSH3 has an incomplete initiator (Inr: 4/7) and complete downstream promoter element motifs (DPE: 6/6) at −1 to +6 and +29 to +34, respectively, which were frequently found in the TATA-less promoter (Fig. 4C) [32]. The reporter pGL3-MSH3-2658-20 used in the above experiments contains the Inr motif, but not the DPE motif. To determine the role of the DPE motif in hMSH3 transcriptional activity, we constructed pGL3-MSH3-681-50 and pGL3-MSH3-2658-50, each containing the DPE motif, and compared their reporter activities with those of pGL3-MSH3-681-20 and pGL3-2658-20. As shown in Fig. 4B, the two constructs containing DPE showed higher activity than the construct without DPE, indicating that DPE contributes to the enhancement of transcriptional activity. Thus, two regions, −2658 to −2480, and the core promoter region, −30 to +50, were identified as essential regions for transcription of the hMSH3.
Fig. 4.

Characterization of the hMSH3 promoter region. A: Reporter constructs containing different regions of the hMSH3 5′ sequences and their reporter activities in SW620 or HeLa S3 cells. The activity of pGL3-promoter was defined as 1 and the relative luciferase activity was determined. A difference in reporter activity was evaluated between the pGL3-MSH3-2658-20 and the other constructs using the Student t-test. *, P<0.01; **, P<0.05. B: The effect of DPE on transcriptional activity. Reporter constructs with and without DPE sequences were compared in SW620 cells. *, P<0.01; **, P<0.05. C: Consensus sequences for TATA-Box (TATAWAAR), Int (YYANWYY), and DPE (RGWYVT) within the core promoter region of hMSH3. A nucleotide sequence from −31 to +39 of the core promoter region of hMSH3 (lower line) and the positions of each consensus sequence are shown. The transcription initiation site is expressed as 1.
3.5. Role of putative hypoxia response element (HRE) sites in the promoter region of hMSH3 for down-regulation of hMSH3 by hypoxia
We next mapped a promoter sub-region that can control transcription of hMSH3 under hypoxia. When a reporter plasmid covering −2658 to +50 of hMSH3 was introduced into hypoxic and normoxic cells (mut-p53 SW620 and wt-p53 HCT116 +5), reporter activity was significantly reduced in hypoxic cells regardless of p53 status. Because a consensus sequence for HREs was present in two sites at −2525 to −2521 and −1639 to −1635 (Fig. 5A), we next determined whether these sequences played a role for hypoxia-induced repression of hMSH3. While the construct having two putative HREs (−2658 to +20) and the construct having one HRE (−2480 to +20) showed reduced reporter activity in hypoxic cells (Fig. 5B), the shorter construct (−1267 to +20) lacking the two HRE sites did not respond to hypoxia. Furthermore, the constructs with mutated HREs also did not show reduction in reporter activity by hypoxia (Fig. 5C). These results indicate that down-regulation of hMSH3 by hypoxia is partly mediated through putative HRE sites within a promoter region of the hMSH3.
Fig. 5.

The role of the putative HRE in down-regulation of reporter activity by hypoxia. A: A schematic map of two putative HREs in the 5′-upstream of hMSH3. The HRE1 (GCGTG) located at −2525 to −2521 and the HRE2 (ACGTG) located at −1639 to −1635. The arrow indicates the transcription initiation site. The HRE1 sequence was replaced by GCATA and the HRE2 site was replaced by TTTTG for mutation experiments in 5 C. B: The effect of HRE deletion on reporter activity in response to hypoxia. SW620 or HCT116+5 were transfected with the reporter plasmids, pGL3-MS3-2658-20, pGL3-MSH3-2480-20 and pGL3-MS3-1267-20. After transfection, cells were cultured for another 24 hrs in normoxia (open bars) and hypoxia (closed bars). *, P<0.01. C: The effect of mutations in HRE on reporter activity in response to hypoxia. Three reporter plasmids having mutations at HRE1, at HRE2, and at both HRE1 and HRE2, designated as pGL3-MS3-HRE1M, pGL3-MS3-HRE2M, and pGL3-MS3-WM were constructed from pGL3-MS3-2658-20. SW620 was transfected with these plasmids and cultured for another 24 hrs in normoxia (open bars) and hypoxia (closed bars). *, P<0.01.
3.6. Involvement of HIF-1α in down-regulation of hMSH3 by hypoxia
As shown above, the putative HRE sites within the hMSH3 promoter region are involved in hypoxia-induced repression of hMSH3 transcription. Because HIF-1α is a strong candidate protein that binds to HRE sites, we examined the effect of HIF-1α knockdown by siRNA on down-regulation of hMSH3 by hypoxia. The levels of HIF-1α in wt-p53 HCT116+5 and mut-p53 SW620 reached their maximum at 1 day after hypoxia and became undetectable by 3 days after hypoxia (Fig. 6A). When siRNA specific to HIF-1α was introduced into HCT116 +5 and SW620, a 78% reduction in the hypoxia-induced HIF-1α protein was observed within 1 day in cells treated with HIF-1α-specific siRNA as compared to hypoxic cells treated with control siRNA (Fig. 6B). Under these conditions, a significant difference in down-regulation of hMSH3 mRNA was observed between hypoxic wt-p53 HCT116+5 cells treated with HIF-1α specific siRNA and control siRNA (Fig. 6C, P=0.0258). Similarly, a significant difference was observed between hypoxic mut-p53 SW620 treated with HIF-1α specific siRNA and control siRNA at 1 day after hypoxia (Fig. 6C, P=0.046). Down-regulation of hMSH3 protein by hypoxia was also inhibited by HIF-1α siRNA in both cell lines (Fig. 6D).
Fig. 6.

Role of HIF-1α for down-regulation of hMSH3 by hypoxia. A: Stabilization of the HIF-1α protein in SW620 and HCT116+5 cells by hypoxia. Cells were cultured for 0, 1, 2, and 3 days in hypoxia and the amount of HIF-1α was monitored by Western blot analysis with anti HIF-1α antibody. α-Tubulin was used as a loading control. B: HIF-1α knockdown by siRNA. Cells were transfected with a negative control (ctr) oligomer or an HIF-1α siRNA (HIF) oligomer and cultured under hypoxia for the indicated days. The amount of HIF-1α was compared between hypoxic cells transfected with a negative control (ctr) oligomer and the HIF-1α siRNA (HIF) oligomer after normalization by α-tubulin signals. C: Effect of HIF-1α knockdown on hypoxia-induced down-regulation of hMSH3 mRNA. HCT116+5 and SW620 transfected with a negative control (ctr) oligomer (open bars) and an HIF-1α specific siRNA oligomer (closed bars) were cultured in hypoxia for the indicated number of days. The amount of hMSH3 mRNA was compared between the cells transfected with ctr and HIF siRNA. *, P<0.01; **, P<0.05. D: Effect of HIF-1α knockdown on hypoxia-induced down-regulation of hMSH3 protein. HCT116+5 and SW620 transfected with a negative control (ctr) oligomer (open bars) and an HIF-1α specific siRNA oligomer (closed bars) were cultured in hypoxia for the indicated number of days. The amount of hMSH3 was compared between hypoxic cells transfected with a negative control (ctr) oligomer and the HIF-1α siRNA (HIF) oligomer after normalization by α-tubulin signals.
We next determined whether HIF-1α directly binds to the putative HREs in the hMSH3 promoter by EMSA and binding inhibition assay using anti HIF-1α antibody specifically recognizes a DNA binding domain of HIF-1α (see Materials and methods). When the nuclear extracts from normoxic and hypoxic wt-p53 HCT116+5 cells were mixed with a radio-labeled (hot) wild type HRE1 probe (WT-HRE1), at least 5 species of proteins that bind to WT-HRE1 probe were induced by hypoxia (Fig. 7A). Two of them indicated as “a” and “b” were specifically diminished by anti HIF-1α antibody, indicating that “a” and “b” contain HIF-1α and bind to WT-HRE1 probe (Fig. 7A). These bindings were inhibited when an excess of non-radio-labeled (cold) WT-HRE1 oligonucleotides (WT-HRE1) was added to the reaction (Fig. 7A). In contrast, an excess of cold mutated oligonucleotides whose sequences were the same as the WT-HRE1 probe except the HRE1 site was replaced by mutated sequences, TTTTG, (MT1-HRE1) did not compete with hot WT-HRE1 probe. However, when another cold oligonucleotide whose sequences were the same as WT-HRE1 probe except that the HRE1 site was replaced by mutated sequences, GCATA, (MT2-HRE1) competed with hot WT-HRE1 for formation of band “a” but not that of band “b” (Fig. 7B). Furthermore, an excess of cold oligonucleotides containing the HRE2 region of the hMSH3 (WT-HRE2) but not the oligonucleotides containing mutated HRE2 site (MT-HRE2, TTTTG) inhibited the binding of WT-HRE1 probe to form bands “a” and “b” (Fig. 7C). Taken together, in hypoxic wt-p53 HCT116+5, 1) there were two forms of HIF-1α complexes, A and B, and they specifically bound to the HRE1 site of the WT-HRE1 probe, 2) complex A has a larger mass than the complex B, and the amount of its binding product with probe WT-HRE1, “a”, is less than the amount of a binding product formed between the complex B and probe WT-HRE1, “b”, 3) there is a difference in binding specificity between complexes A and B; A but not B binds to MT2-HRE1, and 4) both complexes A and B not only specifically bind to the HRE1 site but also to the HRE2 site (Fig. 7C). To confirm complexes A and B specifically bind to the HRE2 sites, hot-WT-HRE2 probe was mixed with hypoxic wt-p53 HCT116+5 nuclear extracts. As expected, two bands, “c” that has a larger mass than “d”, were detected in hypoxic cells and these bands were diminished by anti HIF-1α antibody and a cold WT-HRE2 probe but not by a cold MT-HRE2 probe (Supplementary Fig. 4A and 4B). These results confirm that complexes A and B specifically bind to the HRE2 sites.
Fig. 7.

Binding of HIF-1α to the HRE1 site within the hMSH3 promoter region in hypoxic wt-p53 HCT116+5 and mut-p53 SW620 cells. A and D: Two binding products, “a” and “b”, are formed between the protein complexes containing HIF-1α, A and B respectively, and the radio-labeled (hot) oligonucleotide probe containing the HRE1 site and its flanking sequences (WT-HRE1) in hypoxic wt-p53 HCT116+5 (A) or mut-p53 SW620 (D). –: nuclear extracts were not added (lane 1), NE: nuclear extracts, N: normoxic cell nuclear extracts were added (lanes 2), H: hypoxic cell nuclear extracts were added (lanes 3–8). Left panel: a non-radio-labeled (cold) WT-HRE1 probe was not added (–, lanes 2, 3) or was added 25-fold excess (25, lane 4) or 50-fold excess (50, lane 5) of hot probe. Right panel: anti HIF-1α antibody was either not added (–, lane 6) or added (anti HIF-1α antibody, lane 7), or control mouse IgG (IgG, lane 8) was added to the reaction mixture. F: free probe. Bands “a” and “b” were diminished by the anti HIF-1α antibody. B and E: Inhibition of binding of A or B to hot WT-HRE1 probe by 8-fold excess of cold-WT-HRE1: (diminished bands “a” and “b” in lane 3) in hypoxic wt-p53 HCT116+5 (B) or mut-p53 SW620 (E). No inhibition of binding of A or B to hot WT-HRE1 probe by 8-fold excess of cold-MT1-HRE1 probe that contain exact the same DNA sequence as WT-HRE1 probe except HRE1 site was replaced by oligonucleotides, TTTTG, (lane 5). Inhibition of binding of A but not B to hot WT-HRE1 probe by 8-fold excess of cold-MT2-HRE1 probe containing replaced oligonucleotides, GCATA: (diminished band “a” but not “b” in lane 4). NE: nuclear extracts, H: hypoxic cell nuclear extracts, (+): added to the reaction mixture, (–): not added, F: free probe. These results indicate that the protein complexes A and B specifically bound to the HRE1 site but A has an additional binding specificity to another sequences compared to B. C and F: Inhibition of binding of A or B to hot WT-HRE1 probe by 100-fold excess of cold-HRE2: (diminished bands “a” and “b” in lane 2) in hypoxic wt-p53 HCT116+5 (C) or mut-p53 SW620 (F). No inhibition of binding of A or B to hot WT-HRE1 probe by 100-fold excess of cold-MT1-HRE2 probe that contain exact same sequence as WT-HRE2 probe except HRE2 site was replaced by oligonucleotides, TTTTG, (lane 3). NE: nuclear extracts, H: hypoxic cell nuclear extracts, (–): not added, F: free probe. The results indicate that A and B bound to the HRE2 sites of WT-HRE2 probe.
When the experiments described above were repeated using cell extracts from hypoxic mut-p53 SW620, two complexes A and B were also detected (Fig. 7D–F and Supplementary Fig. 4C and 4D). However, the binding of A to the HRE1 (Fig. 7D–F) and HRE2 (Supplementary Fig. 4C and 4D) in hypoxic mut-p53 SW620 dominated over that of B, whereas the binding of B to the HREs (Fig. 7A–C and Supplementary Fig. 4A and B) dominated over that of A in wt-p53 HCT116 +5. Because of this sharp contrast in the binding profiles of A and B between wt-p53 and mut-p53 cells, we performed EMSA using cell extracts from null-p53 HCT116+5 cells to examine whether the status of p53 may effect the binding profile of complexes A and B. As shown in Fig. 8, in contrast to the results obtained from wt-p53 counterparts, the intensity of bands “a” in the HRE1 site (Fig. 8A) and the intensity of band c in the HRE2 site (Fig. 8B) became stronger in null-p53 cells. These results support the idea that p53 status may influence the binding of complexes A and B to HRE sites.
Fig. 8.

Bindings of protein complexes containing HIF-1α to the HRE1 and HRE2 sites in hypoxic null-p53 HCT116 +5. A: A hot-WT-HRE1 probe was mixed with nuclear extracts (NE) from normoxic cells (N) or hypoxic cells (H) and subjected to electrophoresis. Five species of protein complexes were induced by hypoxia (lane 2) compared to normoxic cell (lane 1). Among them bands “a” and “b” were diminished by anti HIF-1α antibody (lane 4) compared to control, nothing added (–) (lane 3) or mouse IgG added (lane 5). F: free probe. Compared to wt-p53 HCT116+5, the intensity of band “a” becomes stronger, indicating that the binding of protein complex A to the HRE1 site becomes dominant over complex B where the case is the same in hypoxic mut-p53 SW620. B: A hot-WT-HRE2 probe was mixed with nuclear extracts (NE) from normoxic cells (N) or hypoxic cells (H) and subjected to electrophoresis. Five species of protein complexes were induced by hypoxia (lane 2) compared to normoxic cell (lane 1). Among them bands “c” and “d” were diminished by anti HIF-1α antibody (lane 4) compared to control, nothing added (–) (lane 3) or mouse IgG added (lane 5). F: free probe. Compared to wt-p53 HCT116+5 (Supplementary Figs. 4A and 4B), the intensity of band “c” becomes stronger, indicating that the binding of protein complex A to the HRE2 site becomes dominant over complex B where the case is the same hypoxic mut-p53 SW620 (Supplementary Figs. 4C and 4D).
4. Discussion
In this study, we showed that there is a significant association between over-expression of the hypoxic marker GLUT1 and down-regulation of hMSH3 (Table 1). A significant association between over-expression of GLUT1 and EMAST in CRC tissues was also observed (Supplementary Table 4). These results support the idea that hypoxia may down-regulate hMSH3, which may result in MSI-L/EMAST in CRC tissues.
We therefore aimed to obtain direct evidence that hypoxia down-regulates hMSH3 expression in vitro using 10 human tissue-cultured cell lines. This analysis clarified that there are at least three different modes of hMSH3 expression in response to hypoxia. First is the p53-dependent mode of regulation in which the rate of down-regulation in MSH3 was rapid at both mRNA and protein levels. Second is the p53-independent mode of regulation that occurred under prolonged hypoxia (6 days) and at slower rate in cells with mutated or null p53 (Fig. 2). Third is case where there was no down-regulation of MSH3 in response to hypoxia after either a short or prolonged period of hypoxia. This type of response was observed in two cell lines with wt-p53, MCF-7 and GOTO (Table 2). Because we detected stabilization of HIF-1α and down-regulation of hMSH2 in MCF-7 cells within 24 hr after hypoxia, this cell line has an intact pathway to down-regulate hMSH2. It remains to be determined why these cell lines lack responsiveness to hypoxia for down-regulation of hMSH3. In contrast to hMSH3, no significant down-regulation of hMSH2 occurred in cells with null/mut-p53 cells under both short and prolonged hypoxia. The results indicate that hMSH2 and hMSH3 loci respond differently to hypoxia.
The above results suggest that the status of p53 has a major impact on the hypoxic response of MSH3 expression in CRC tissues. It is interesting to note that the EMAST phenotype that is a consequence of hMSH3-deficiency is significantly associated with mut-p53 in NSCLC [7]. As shown in this paper, hMSH3 can be down-regulated in cells with wt-p53 and with null/mut-p53 by hypoxia. However, it could be that hypoxic cells with mut-p53 have greater capacity to multiply their DNA under depressed MSH3 compared to hypoxic cells with wt-p53 [33]. This could explain why EMAST tumors have a high frequency of p53 mutations in NSCLC. To test whether this is the case in CRC, we analyzed the LOH status of 3 polymorphic markers within the TP53 locus in our 26 cases of primary CRC. Our preliminary data indicates that 65% (13 of 20 cases) of EMAST CRC and 33.3% (2 of 6 cases) of non-EMAST CRC showed LOH at least one of three markers examined (Supplementary Table 4). However, although there was a trend for association between LOH at TP53 locus and EMAST, it was not statistically significant (P=0.169). A further study that can detect mutations in TP53 by direct sequencing using a larger cohort is necessary to clarify this matter.
In this study, we isolated the promoter region of the hMSH3 to identify critical sequences that may affect hMSH3 transcription in response to hypoxia. By reporter gene assays, we identified two putative HREs sequences, whose deletions or mutations resulted in loss of responsiveness of the reporter constructs to hypoxia in a cell lines with wt-p53 and mut-p53 cell lines (Fig. 5). These results suggest that down-regulation of hMSH3 by hypoxia is mediated through the binding of some transcription factor at these HRE sites.
Since HIF-1α is a strong candidate for such a factor, we investigated whether HIF-1α mediates down-regulation of hMSH3 by hypoxia. First, a knockdown of HIF-1α resulted in a significant loss of responsiveness to hypoxia in cell lines with wt-p53 and mut-p53 cells (Fig. 6A–D). Second, the EMSA showed that there are two different forms of the protein complexes containing HIF-1α, A and B, induced in both hypoxic wt-p53 HCT116+5 and in mut-p53 SW620, specifically bind to putative HRE1 and HRE2 sites (Fig. 7A–F). Furthermore, our results suggest that complex A occupies the HRE1 and the HRE2 sites in null/mut-p53 cells more predominately than does complex B, whereas complex B occupies both HREs in wt-p53 cells more predominately than does complex A. It remains to be determined whether an exact correlation exists between the binding profiles of A and B, and p53 status in general.
In our preliminary experiments, biochemical hypoxia induced by desferrioxamine mesylate or cobalt failed to down-regulate hMSH3 in HCT116+5 and SW480, even though stabilization of HIF-1α occurred in treated cells. These results suggest that some factor(s) in addition to HIF-1α by hypoxia is required for down-regulation of hMSH3. Further experiments are necessary to clarify the identities of the protein complexes containing HIF-1α, A and B, as well as an additional transcription factor that interacts with HIF-1α, to clarify their relationships to p53 status and to down-regulation of hMSH3 transcription.
It has been proposed by Koshiji et al. that expression of hMSH2 in normoxic cells is mediated by binding of a complex between SP1 and MYC/MAX to the GC box of the promoter region at this locus, but that in hypoxic cells, HIF-1α replaces MYC/MAX to form a complex with SP1 in a p53-dependent manner, leading to down-regulation of hMSH2 expression in wt-p53 hypoxic cells [19]. Our preliminary experiments showed that knockdown of c-myc by siRNA (> 90% reduction in c-myc mRNA compared to control) in HCT116+5 and SW620 did not reduce hMSH3 expression, suggesting that interaction between HIF-1α and SP1, which displaces MYC/MAX from a gene promoter, may not be essential for hMSH3 down-regulation by hypoxia. On the other hand, direct interaction between HIF-1α and HREs at the promoter regions of hMSH2 has not been explored even though at least four putative HREs exist at the promoter region of this gene. Thus, it would be interesting to determine whether HIF-1α complex B, that predominantly binds to the hMSH3 HREs in wt-p53 cells, selectively interacts with HREs of the hMSH2 locus while complex A does not, and whether this interaction also plays a role for down-regulation of hMSH2 by hypoxia.
Finally, what is a pathobiological significance of hypoxia-induced down-regulation of hMSH3 on CRC carcinogenesis? Several studies have demonstrated that hypoxia enhances the aggressiveness of cancer and promotes the metastatic potential of primary tumor tissues [34–38]. Therefore, depressed hMSH3 may not only induce MSI-L and/or EMAST but may also induce frame-shift mutations at the intragenic microsatellite present in a putative target gene in hypoxic CRC cells. Such a mutated gene may contribute to the progression of CRC. Alternatively, the down-regulation of hMSH3 and its consequent MSI-L and/or EMAST may merely be a byproduct of hypoxia and have little effect on the progression of CRC. In either case, the MSI-L and/or EMAST phenotype in primary CRC may be significantly associated with the metastatic potential of these tumors. In support of this idea, the MSI-L exhibited by Dukes’ C primary CRC is associated with a poor prognosis [39]. Based on this assumption, we are currently examining the relationship between recurrent metastasis and MSI-L/EMAST in sporadic primary CRCs.
5. Conclusion
Over-expression of GLUT1 is associated with down-regulation of hMSH3 and with MSI-L/EMAST in CRC tissues. Hypoxia induces down-regulation of hMSH3 expression in human cancer cell lines through p53-dependent and p53-independent mechanisms. HIF-1α stabilized by hypoxia is involved in suppressing hMSH3 transcription through HREs sites within the 5′ promoter region of hMSH3 in both p53-dependent and p53-independent pathways.
Supplementary Material
Acknowledgments
We thank Dr. Motonari Kondo for his continuous support and Mrs. M. Koi for editing the manuscript. This work was supported in part by a Grant-in-Aid for Scientific Research from the Japan Society for the Promotion of Science (21591736 and 22591495), a Project Research Grant of Toho University School of Medicine (22-8, 23-10), NIH grants R01 CA72851 and funds from Sammons Cancer Center, Baylor University Medical Center.
Appendix A. Supplementary data
Supplementary data to this article can be found online at doi:10. 1016/j.bbamcr.2012.01.017.
References
- 1.Kunkel TA, Erie DA. DNA mismatch repair. Annu Rev Biochem. 2005;74:681–710. doi: 10.1146/annurev.biochem.74.082803.133243. [DOI] [PubMed] [Google Scholar]
- 2.Zhang Y, Rohde LH, Wu H. Involvement of nucleotide excision and mismatch repair mechanisms in double strand break repair. Curr Genomics. 2009;10:250–258. doi: 10.2174/138920209788488544. [DOI] [PMC free article] [PubMed] [Google Scholar]
- 3.Stojic L, Brun R, Jiricny J. Mismatch repair and DNA damage signalling. DNA Repair (Amst) 2004;3:1091–1101. doi: 10.1016/j.dnarep.2004.06.006. [DOI] [PubMed] [Google Scholar]
- 4.Lynch HT, Lynch PM, Lanspa SJ, Snyder CL, Lynch JF, Boland CR. Review of the Lynch syndrome: history, molecular genetics, screening, differential diagnosis, and medicolegal ramifications. Clin Genet. 2009;76:1–18. doi: 10.1111/j.1399-0004.2009.01230.x. [DOI] [PMC free article] [PubMed] [Google Scholar]
- 5.Boland CR, Goel A. Microsatellite instability in colorectal cancer. Gastroenterology. 2010;138:2073–2087. e2073. doi: 10.1053/j.gastro.2009.12.064. [DOI] [PMC free article] [PubMed] [Google Scholar]
- 6.Boland CR, Thibodeau SN, Hamilton SR, Sidransky D, Eshleman JR, Burt RW, Meltzer SJ, Rodriguez-Bigas MA, Fodde R, Ranzani GN, Srivastava S. A National Cancer Institute Workshop on Microsatellite Instability for cancer detection and familial predisposition: development of international criteria for the determination of microsatellite instability in colorectal cancer. Cancer Res. 1998;58:5248–5257. [PubMed] [Google Scholar]
- 7.Ahrendt SA, Decker PA, Doffek K, Wang B, Xu L, Demeure MJ, Jen J, Sidransky D. Microsatellite instability at selected tetranucleotide repeats is associated with p53 mutations in non-small cell lung cancer. Cancer Res. 2000;60:2488–2491. [PubMed] [Google Scholar]
- 8.Xu L, Chow J, Bonacum J, Eisenberger C, Ahrendt SA, Spafford M, Wu L, Lee SM, Piantadosi S, Tockman MS, Sidransky D, Jen J. Microsatellite instability at AAAG repeat sequences in respiratory tract cancers. Int J Cancer. 2001;91:200–204. doi: 10.1002/1097-0215(200002)9999:9999<::aid-ijc1031>3.0.co;2-0. [DOI] [PubMed] [Google Scholar]
- 9.Danaee H, Nelson HH, Karagas MR, Schned AR, Ashok TD, Hirao T, Perry AE, Kelsey KT. Microsatellite instability at tetranucleotide repeats in skin and bladder cancer. Oncogene. 2002;21:4894–4899. doi: 10.1038/sj.onc.1205619. [DOI] [PubMed] [Google Scholar]
- 10.Catto JW, Azzouzi AR, Amira N, Rehman I, Feeley KM, Cross SS, Fromont G, Sibony M, Hamdy FC, Cussenot O, Meuth M. Distinct patterns of microsatellite instability are seen in tumours of the urinary tract. Oncogene. 2003;22:8699–8706. doi: 10.1038/sj.onc.1206964. [DOI] [PubMed] [Google Scholar]
- 11.Burger M, Denzinger S, Hammerschmied CG, Tannapfel A, Obermann EC, Wieland WF, Hartmann A, Stoehr R. Elevated microsatellite alterations at selected tetranucleotides (EMAST) and mismatch repair gene expression in prostate cancer. J Mol Med. 2006;84:833–841. doi: 10.1007/s00109-006-0074-0. [DOI] [PubMed] [Google Scholar]
- 12.Singer G, Kallinowski T, Hartmann A, Dietmaier W, Wild PJ, Schraml P, Sauter G, Mihatsch MJ, Moch H. Different types of microsatellite instability in ovarian carcinoma. Int J Cancer. 2004;112:643–646. doi: 10.1002/ijc.20455. [DOI] [PubMed] [Google Scholar]
- 13.Haugen AC, Goel A, Yamada K, Marra G, Nguyen TP, Nagasaka T, Kanazawa S, Koike J, Kikuchi Y, Zhong X, Arita M, Shibuya K, Oshimura M, Hemmi H, Boland CR, Koi M. Genetic instability caused by loss of MutS homologue 3 in human colorectal cancer. Cancer Res. 2008;68:8465–8472. doi: 10.1158/0008-5472.CAN-08-0002. [DOI] [PMC free article] [PubMed] [Google Scholar]
- 14.Yamada K, Kanazawa S, Koike J, Sugiyama H, Xu C, Funahashi K, Boland CR, Koi M, Hemmi H. Microsatellite instability at tetranucleotide repeats in sporadic colorectal cancer in Japan. Oncol Rep. 2010;23:551–561. [PMC free article] [PubMed] [Google Scholar]
- 15.Lee SY, Chung H, Devaraj B, Iwaizumi M, Han HS, Hwang DY, Seong MK, Jung BH, Carethers JM. Microsatellite alterations at selected tetranucleotide repeats are associated with morphologies of colorectal neoplasias. Gastroenterology. 2010;139:1519–1525. doi: 10.1053/j.gastro.2010.08.001. [DOI] [PMC free article] [PubMed] [Google Scholar]
- 16.Devaraj B, Lee A, Cabrera BL, Miyai K, Luo L, Ramamoorthy S, Keku T, Sandler RS, McGuire KL, Carethers JM. Relationship of EMAST and microsatellite instability among patients with rectal cancer. J Gastrointest Surg. 2010;14:1521–1528. doi: 10.1007/s11605-010-1340-6. [DOI] [PMC free article] [PubMed] [Google Scholar]
- 17.Koi M, Boland C. Tumor hypoxia and genetic alterations in sporadic cancers. J Obstet Gynaecol Res. 2011;37:85–98. doi: 10.1111/j.1447-0756.2010.01377.x. [DOI] [PMC free article] [PubMed] [Google Scholar]
- 18.Mihaylova VT, Bindra RS, Yuan J, Campisi D, Narayanan L, Jensen R, Giordano F, Johnson RS, Rockwell S, Glazer PM. Decreased expression of the DNA mismatch repair gene Mlh1 under hypoxic stress in mammalian cells. Mol Cell Biol. 2003;23:3265–3273. doi: 10.1128/MCB.23.9.3265-3273.2003. [DOI] [PMC free article] [PubMed] [Google Scholar]
- 19.Koshiji M, To KK, Hammer S, Kumamoto K, Harris AL, Modrich P, Huang LE. HIF-1α induces genetic instability by transcriptionally downregulating MutSα expression. Mol Cell. 2005;17:793–803. doi: 10.1016/j.molcel.2005.02.015. [DOI] [PubMed] [Google Scholar]
- 20.Rodriguez-Jimenez FJ, Moreno-Manzano V, Lucas-Dominguez R, Sanchez-Puelles JM. Hypoxia causes downregulation of mismatch repair system and genomic instability in stem cells. Stem Cells. 2008;26:2052–2062. doi: 10.1634/stemcells.2007-1016. [DOI] [PubMed] [Google Scholar]
- 21.Chung FY, Huang MY, Yeh CS, Chang HJ, Cheng TL, Yen LC, Wang JY, Lin SR. GLUT1 gene is a potential hypoxic marker in colorectal cancer patients. BMC Cancer. 2009;9:241. doi: 10.1186/1471-2407-9-241. [DOI] [PMC free article] [PubMed] [Google Scholar]
- 22.Yamada K, Zhong X, Kanazawa S, Koike J, Tsujita K, Hemmi H. Oncogenic pathway of sporadic colorectal cancer with novel germline missense mutations in the hMSH2 gene. Oncol Rep. 2003;10:859–866. [PubMed] [Google Scholar]
- 23.Koi M, Umar A, Chauhan DP, Cherian SP, Carethers JM, Kunkel TA, Boland CR. Human chromosome 3 corrects mismatch repair deficiency and microsatellite instability and reduces N-methyl-N′-nitro-N-nitrosoguanidine tolerance in colon tumor cells with homozygous hMLH1 mutation. Cancer Res. 1994;54:4308–4312. [PubMed] [Google Scholar]
- 24.Bunz F, Dutriaux A, Lengauer C, Waldman T, Zhou S, Brown JP, Sedivy JM, Kinzler KW, Vogelstein B. Requirement for p53 and p21 to sustain G2 arrest after DNA damage. Science. 1998;282:1497–1501. doi: 10.1126/science.282.5393.1497. [DOI] [PubMed] [Google Scholar]
- 25.Koi M, Morita H, Shimizu M, Oshimura M. Construction of mouse A9 clones containing a single human chromosome (X/autosome translocation) via micro-cell fusion. Jpn J Cancer Res. 1989;80:122–125. doi: 10.1111/j.1349-7006.1989.tb02278.x. [DOI] [PMC free article] [PubMed] [Google Scholar]
- 26.Kalish JA, Willis DJ, Li C, Link JJ, Deutsch ER, Contreras MA, Quist WC, Logerfo FW. Temporal genomics of vein bypass grafting through oligonucleotide microarray analysis. J Vasc Surg. 2004;39:645–654. doi: 10.1016/j.jvs.2003.10.049. [DOI] [PubMed] [Google Scholar]
- 27.Sugiyama H, Arita M, Min Z, Zhong X, Iwasaki I, Hirano K, Shimatake H, Hemmi H. A novel dysfunctional p53 mutation in the human neuroblastoma cell line TGW. Tohoku J Exp Med. 2003;201:229–237. doi: 10.1620/tjem.201.229. [DOI] [PubMed] [Google Scholar]
- 28.Kikuchi Y, Takano S. Preparation of antibodies against hMSH2 and hMLH1 and its cellular localization in human colon cancer cell lines. J Med Soc Toho Univ. 1997;43:432–445. [Google Scholar]
- 29.Sugiyama H, Arita M, Zhong X, Min Z, Hemmi H. Differential inducibility of p53 downstream genes in human neuroblastoma cell lines. J Med Soc Toho. 2003;50:13–23. [Google Scholar]
- 30.Arita M, Zhong X, Min Z, Hemmi H, Shimatake H. Multiple sites required for expression in 5′-flanking region of the hMLH1 gene. Gene. 2003;306:57–65. doi: 10.1016/s0378-1119(03)00385-8. [DOI] [PubMed] [Google Scholar]
- 31.Jia LQ, Osada M, Ishioka C, Gamo M, Ikawa S, Suzuki T, Shimodaira H, Niitani T, Kudo T, Akiyama M, Kimura N, Matsuo M, Mizusawa H, Tanaka N, Koyama H, Namba M, Kanamaru R, Kuroki T. Screening the p53 status of human cell lines using a yeast functional assay. Mol Carcinog. 1997;19:243–253. doi: 10.1002/(sici)1098-2744(199708)19:4<243::aid-mc5>3.0.co;2-d. [DOI] [PubMed] [Google Scholar]
- 32.Juven-Gershon T, Kadonaga JT. Regulation of gene expression via the core promoter and the basal transcriptional machinery. Dev Biol. 2010;339:225–229. doi: 10.1016/j.ydbio.2009.08.009. [DOI] [PMC free article] [PubMed] [Google Scholar]
- 33.Thompson KE, Royds JA. Hypoxia and reoxygenation: a pressure for mutant p53 cell selection and tumour progression. Bull Math Biol. 1999;61:759–778. doi: 10.1006/bulm.1999.0109. [DOI] [PubMed] [Google Scholar]
- 34.Yoo YG, Christensen J, Huang LE. HIF-1α confers aggressive malignant traits on human tumor cells independent of its canonical transcriptional function. Cancer Res. 2011;71:1244–1252. doi: 10.1158/0008-5472.CAN-10-2360. [DOI] [PMC free article] [PubMed] [Google Scholar]
- 35.Chang Q, Jurisica I, Do T, Hedley DW. Hypoxia predicts aggressive growth and spontaneous metastasis formation from orthotopically grown primary xenografts of human pancreatic cancer. Cancer Res. 2009;71:3110–3120. doi: 10.1158/0008-5472.CAN-10-4049. [DOI] [PubMed] [Google Scholar]
- 36.Li XF, O’Donoghue JA. Hypoxia in microscopic tumors. Cancer Lett. 2008;264:172–180. doi: 10.1016/j.canlet.2008.02.037. [DOI] [PMC free article] [PubMed] [Google Scholar]
- 37.Liu L, Sun L, Zhao P, Yao L, Jin H, Liang S, Wang Y, Zhang D, Pang Y, Shi Y, Chai N, Zhang H. Hypoxia promotes metastasis in human gastric cancer by up-regulating the 67-kDa laminin receptor. Cancer Sci. 2010;101:1653–1660. doi: 10.1111/j.1349-7006.2010.01592.x. [DOI] [PMC free article] [PubMed] [Google Scholar]
- 38.Liu L, Zhu XD, Wang WQ, Shen Y, Qin Y, Ren ZG, Sun HC, Tang ZY. Activation of β-catenin by hypoxia in hepatocellular carcinoma contributes to enhanced metastatic potential and poor prognosis. Clin Cancer Res. 2010;16:2740–2750. doi: 10.1158/1078-0432.CCR-09-2610. [DOI] [PubMed] [Google Scholar]
- 39.Kohonen-Corish MR, Daniel JJ, Chan C, Lin BP, Kwun SY, Dent OF, Dhillon VS, Trent RJ, Chapuis PH, Bokey EL. Low microsatellite instability is associated with poor prognosis in stage C colon cancer. J Clin Oncol. 2005;23:2318–2324. doi: 10.1200/JCO.2005.00.109. [DOI] [PubMed] [Google Scholar]
Associated Data
This section collects any data citations, data availability statements, or supplementary materials included in this article.