

Abstract
Cyst growth in patients with autosomal dominant polycystic kidney disease is thought to be due to increased tubular cell proliferation. One model to explain this altered proliferation suggests that the polycystin proteins PC1 and PC2 localize to apical cilia and serve as an integral part of the flow-sensing pathway thus modulating the proliferative response. We measured proliferation and apoptosis in proximal tubule derived cell lines lacking PC1. These cells showed increased rates of proliferation, a decreased rate of apoptosis, compared to control heterozygous cell lines, and spontaneously formed cysts rather than tubules in an in vitro tubulogenesis assay. Addition of neutrophil gelatinase associated lipocalin (NGAL), a small secreted protein that binds diverse ligands, to the cells lacking PC1 inhibited proliferation and increased apoptosis leading to slower cyst growth in vitro. Sustained over-expression at low level of NGAL by an adenoviral delivery system suppressed cyst enlargement without improving renal function in the Pkd1 mutant mice. Our studies show that renal epithelial cells lacking PC1 have an inherent tendency to hyper-proliferate forming cysts in vitro independent of a flow stimulus. The potential benefit of attenuating cyst growth with NGAL remains to be determined.
Keywords: Pkd, apoptosis, proliferation, NGAL, tubulogenesis, cysts
Autosomal-dominant polycystic kidney disease is one of the most common hereditary causes of kidney failure. The disease occurs most often as a result of mutations in either the PKD1 or PKD2 genes that encode the proteins polycystin-1 (PC1) and polycystin-2 (PC2), respectively.1,2 A prominent feature of the disease is the development of cysts along multiple segments of the nephron. Over a period of years, these cysts enlarge and disrupt the normal kidney architecture, eventually leading to end stage renal disease. The focal nature of the cysts in humans with autosomal-dominant polycystic kidney disease is thought to be because of the random acquisition of mutations in the normal allele for the respective PKD gene in some tubular cells.3–6 The subsequent cyst formation has been proposed to require increased proliferation and/or decreased differentiation of the mutant cells.1,2,7–9
Mouse models of PKD have been developed in which Pkd1 or Pkd2 have been mutated or knocked-out. Similar to humans, mice that are heterozygous for the mutant Pkd1 or Pkd2 gene exhibit normal kidney development and only acquire cysts later in life.10,11 In contrast, homozygous loss of either PC1 or PC2 expression results in extensive tubule dilatation beginning at embryonic day 15.5 as well as embryonic or perinatal lethality in the pups.11,12 The observation that both PC1 and PC2 localize to primary cilia, and that mutations in other cilial proteins can result in phenotypic polycystic kidney disease in animal models,13–15 has recently led to a major focus on the role of aberrant cilia function in the process of cyst formation. Evidence in Madin–Darby canine kidney cells as well as other cell types suggests that cilia are responsible for flow-dependent cellular signaling.16 Consistent with this, cystic dilatation of the tubules in Pkd1−/− mice begins at approximately the same time as glomerular filtration starts (~E15), leading some to postulate that cilia act as flow sensors in vivo and that failure of normal signaling by this sensor results in aberrant control of tubular cell proliferation, apoptosis, and/or differentiation, leading to progressive cyst formation.17
Polycystin genotype-dependent, but cilia-independent phenotypes have also been reported. In vitro studies of renal epithelial cells in which Pkd1 or Pkd2 have been over-expressed, or cyst-lining cells obtained from kidneys of rodents with PKD, suggest that the level of polycystin expression can influence the inherent tendency of epithelial cells to form cysts in culture systems that lack a flow component.18,19 Furthermore, PC1 has been localized to sites of cell–cell as well as cell–matrix interaction,20,21 suggesting that polycystins may be involved in signaling that is independent of the primary cilium.
To study the role of PC1 in regulating cyst formation, we have established Pkd1fl/− and Pkd1−/− mouse proximal tubule cell lines that are derived from a single common parental Pkd1fl/− clone. As compared to Pkd1fl/− cells that form tubular structures in a three-dimensional culture system, Pkd1−/− cells give rise primarily to cysts in vitro. Furthermore, the null cells have increased rates of proliferation and decreased apoptosis resulting in more rapid expansion of cell numbers.
On the basis of our previous observation that loss of expression of the small secreted protein neutrophil gelatinase-associated lipocalin (NGAL) can induce cyst formation in normal renal cell lines,22 we examined the effects of NGAL on Pkd1−/− cells. NGAL is a 24-kDa protein that is secreted by multiple cells, including renal tubular cells, and whose function remains incompletely understood. NGAL belongs to a family of small secreted proteins that have been shown to bind diverse ligands including bacterial siderophore, soluble extracellular macromolecules, growth factors, and cell surface receptors such as megalin.22–27 Multiple studies have demonstrated that NGAL can act to either deliver those factors or sequester them. For example, NGAL can bind siderophore and thus sequester iron to inhibit bacterial growth, as well as deliver iron intracellularly where it is necessary for the regulation of iron-dependent enzymes.27 In the present work, administration of exogenous NGAL was found to increase apoptosis of Pkd1−/− cells, resulting in decreased cyst growth in vitro. In vivo expression of NGAL using an adenoviral delivery system resulted in slowed growth of cysts in a postnatal model of Pkd1-dependent cyst formation, although blood urea nitrogen values were not significantly improved by this treatment.
RESULTS
Pkd1−/− cells preferentially form cysts in vitro
We have previously demonstrated that wild-type renal tubular epithelial cells, when suspended in a 70:30 mixture of collagen type I and Matrigel, predominantly form multicellular tubular structures.28 To determine the influence of Pkd1 gene expression on the tubulogenic potential of renal epithelial cells, PN null cells and PH heterozygous control cells were suspended in matrix as described in `Materials and Methods' and cultured in the absence of a flow stimulus. Although PH cells formed elongated cord-shaped structures (Figure 1a), cells lacking Pkd1 expression formed far greater numbers of cystic structures (Figure 1b). Most cysts developed a visible lumen whereas others grew as enlarging spheres of cells. Quantitative analysis revealed that approximately 45% of structures formed by PN cells were cystic, whereas PH cells almost exclusively formed branching linear structures similar to those previously described for wild-type proximal tubule and collecting duct cells (Figure 1c; Chen et al.29 and Karihaloo et al.30).
Figure 1. Pkd1 null cells preferentially form cysts and hyperproliferate in vitro.

Cells were suspended in a 70:30 collagen:Matrigel mixture and grown for 5 days before quantitation of tubular or cystic structures. (a) Heterozygous PH cells formed mostly linear branching structures with less than 3% cystic structures. (b) Pkd1 null PN cells formed a mixture of cystic structures (arrows) as well as structures that were more linear in shape (arrowheads). (c) Quantitation of the percentage of cystic structures formed for each cell genotype; n=8 for PN (4 each for PN18 and PN24) and n=6 for PH (3 each for PH2 and PH3) cells, respectively, *P<0.001. (d) A total of 1×10⁴ cells from each genotype were plated and cultured for 48 h in the presence of 10% FBS before trypsinization and counting; n=4 for each cell type, *P<0.005 vs the PH2 or PH3 cell lines. (e) Cells were cultured at equal densities and labeled with BrdU for 30 min. BrdU-positive cells were detected by FACS analysis as described; n=4 for each cell type, *P<0.002 vs the PH2 or PH3 cell lines. (f) Cells were cultured at equal densities and serum starved for 48 h before harvest and Annexin V staining and FACS analysis as described; n=3 separate experiments for each cell line, *P<0.01 vs the PH2 or PH3 cell lines.
Pkd1−/− cells demonstrate increased proliferation and decreased apoptosis compared to heterozygous cells
Cyst growth in polycystic kidney disease has been attributed, among other causes, to an increased proliferative capacity of cells lacking normal Pkd gene expression.19,31,32 In agreement with this, Pkd1 null cells were found to require more frequent passaging than heterozygous parental cells. When plated at identical initial cell densities and grown for 4 days, Pkd1 null cells demonstrated a significant increase in total cell number as compared to PH or an independently isolated wild-type proximal tubule cell line, MPT cells33,34 (Figure 1d).
The observed increase in total cell number could be due to an increased rate of proliferation, a decreased rate of apoptosis, or both. 5-Bromodeoxyuridine (BrdU) incorporation by subconfluent cells cultured in Dulbecco's modified Eagle's medium (DMEM)/F12 + 2% fetal bovine serum (FBS) revealed a significant increase in proliferation by Pkd1−/− cells as compared to PH cells (Figure 1e). In addition, Annexin V labeling of the cells demonstrated that only 10–12% of Pkd1−/− cells were undergoing apoptosis after 48 h of serum starvation as compared to 25–30% of Pkd1+/− cells and a similar percentage of MPT cells (Figure 1f). Taken together, these data suggest that loss of Pkd1 gene expression leads directly to expansion of the cell population in vitro due to increased cell proliferation and decreased apoptosis.
NGAL expression inhibits cell growth
We have previously demonstrated that immortalized mouse inner medullary collecting duct cells (mIMCD-3) express high levels of the secreted protein NGAL. We found that NGAL expression can regulate hepatocyte growth factor-mediated morphogenesis in mIMCD-3 cells, and that knockdown of NGAL resulted in a shift from tubule formation to cyst formation.22 During the course of these experiments, it was noted that cells in which NGAL expression was suppressed required more frequent passaging, suggesting that NGAL might also regulate the rate of cell proliferation and/or apoptosis.
To determine the role of NGAL in regulating cell proliferation, mIMCD3 cells were transfected with shRNAs directed against NGAL or a scrambled control, and stable cells selected as previously described.22 Of note, the knockdown resulted in greater than 90% loss of NGAL protein expression. Equal numbers of cells were plated and cell numbers were determined following 2 days of culture in DMEM/F12 + 2% FBS. Cells in which NGAL expression was suppressed exhibited a greater increase in both total cell number (Figure 2a) and viable cell number (Figure 2b) as compared to parental mIMCD-3 cells or control cells expressing the scrambled shRNA. BrdU uptake studies revealed a modest but significant increase in proliferation by cells in which NGAL was suppressed (Figure 2c), whereas Annexin V staining demonstrated a marked reduction in apoptosis by these cells (Figure 2d). These data demonstrate that high levels of NGAL expression can suppress renal tubular cell mass expansion by decreasing proliferation and increasing apoptosis.
Figure 2. Suppression of NGAL expression causes increased proliferation and decreased apoptosis in IMCD cells.

mIMCD-3 cells were stably transfected with two shRNAs directed against NGAL (shRNA 1+2) or the scrambled control shRNA. (a) A total of 1×10⁵ cells were plated and cultured for 48 h in the presence of 10% FBS before trypsinization and counting; n=6 separate experiments for each cell type, *P<0.04 vs cells expressing the scrambled shRNA. (b) A total of 1×10⁴ cells per well were plated and cultured for 48 h in the presence of 10% FBS before incubation with the WST-1 reagent and detection of viable cells via determination of OD 415/655 (proliferation index); n=4 independent experiments, *P*lt;0.01 vs cells expressing the scrambled shRNA. (c) Cells at equal density were cultured in the presence of BrdU for 30 min before FACS analysis for BrdU incorporation; n=3 independent experiments, *P<0.03 vs cells expressing the scrambled shRNA. (d) Cells at equal density were serum starved for 48 h before labeling with Annexin V PE and quantification by FACS analysis; n=4 independent experiments, *P<0.05 vs cells expressing the scrambled shRNA.
NGAL can induce apoptosis of Pkd1−/− cells
As the suppression of NGAL expression in mIMCD-3 cells using shRNA resulted in the same phenotypic changes (increased proliferation, decreased apoptosis, and increased cyst formation) that we observed in Pkd1−/− cells, we investigated the hypothesis that loss of PC1 expression causes a downregulation of NGAL secretion by renal tubular cells. Examination of NGAL expression by reverse transcriptase–PCR and western blot analysis revealed no difference in the levels of NGAL between Pkd1−/− and PH cells (data not shown), suggesting that PC1 expression does not directly regulate NGAL production.
On the basis of the observation that knockdown of NGAL expression in IMCD-3 cells resulted in an increase in cell numbers, we examined the possibility that addition of exogenous NGAL to Pkd1−/− cells could suppress cell proliferation. When Pkd1−/− cells were cultured in the presence of NGAL (20 μg/ml), the total cell number at the end of 2 days was approximately 40% less than that of cells treated with phosphate-buffered saline alone (Figure 3a). However, examination of BrdU incorporation revealed that cell proliferation was not significantly suppressed in NGAL-treated cells (Figure 3b). To examine the effect of NGAL on apoptosis, Pkd1−/− cells were serum starved for 2 days in the presence or absence of 20 μg/ml NGAL. Annexin V staining of Pkd1−/− cells treated with NGAL revealed a >40% increase in apoptosis as compared to untreated cells in both clones tested (Figure 3c).
Figure 3. Addition of NGAL induces apoptosis in Pkd1 null cells.
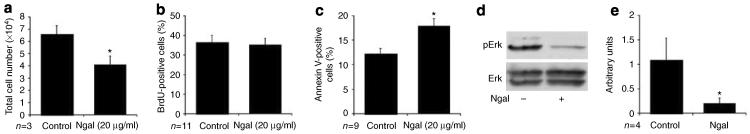
(a) A total of 1×10⁴ Pkd1 null cells were plated and allowed to grow for 48 h±NGAL (20 μg/ml) before trypsinization and counting; n=6 (3 each for PN18 and PN24), *P<0.005. (b) Cells were plated at equal density and grown for 48 h±NGAL, and labeled with BrdU for 30 min before harvest and FACS analysis; n=11 (6 for PN18 and 5 for PN24). (c) Cells were plated at equal density and serum starved for 48 h before labeling with Annexin V PE and FACS analysis; n=9 (4 for PN18 and 5 for PN24), *P<0.01. (d) Cells were treated for 24 h±NGAL and whole cell lysates immunoblotted for the phosphorylated form of Erk (pErk) and for total Erk (Erk). (e) Quantitation of activated Erk normalized to total Erk for vehicle control and NGAL-treated cells as in (d); n=4, *P<0.01.
We have recently found that Pkd1−/− cells exhibit an increase in basal extracellular signal-regulated kinase (Erk) activation as compared to control cells,35 and that NGAL can inhibit hepatocyte growth factor-stimulated Erk activation.22 Erk signaling is a well-known stimulus for cell proliferation36,37 and has been shown to mediate either pro- or antiapoptotic effects depending on the cellular context.38–40 We therefore examined the impact of NGAL on Erk activation in Pkd1−/− cells. Treatment of Pkd1−/− cells with NGAL for 24 h resulted in an 80% decrease in Erk activation (Figure 3d, quantified in e). Thus, in Pkd1−/− cells NGAL can act to inhibit basal Erk activation and increase cell apoptosis, leading to a decrease in cell number.
NGAL suppresses Pkd1−/− cell cyst growth in vitro and in vivo
As noted, we have previously demonstrated that suppression of NGAL expression also resulted in an increase in cyst formation by IMCD-3 cells grown in a three-dimensional matrix.22 To determine whether exogenous NGAL could inhibit cyst formation by Pkd1−/− cells, PN cells were suspended in a 70:30 collagen:Matrigel matrix in the presence or absence of NGAL (20 μg/ml) for 5 days. In the presence of NGAL, PN cells were still found to form a high percentage of cysts (45.6±7.3% cystic structures), suggesting that NGAL cannot reverse the inherent tendency of Pkd1 null cells to form cystic rather than tubulogenic structures. However, the cysts in the NGAL-treated cells were found to be smaller and had less evidence of lumen formation, suggesting that cyst growth was slowed by the addition of NGAL (Figure 4a and b). Quantitation of relative cyst area and volume (calculated assuming a spherical shape) confirmed that treatment with NGAL caused a 60% reduction in cyst growth (Figure 4c and d). Consistent with the ability of NGAL to inhibit cell proliferation, the total number of multicellular structures was also reduced in NGAL-treated cells (control = 8.4±0.6 structures per 10 h.p.f. vs NGAL treated = 3.2±0.2 (n = 30 wells, P<0.005)).
Figure 4. NGAL inhibits cyst growth in vitro.

(a, b) Pkd1 null cells were grown in a 70:30 collagen:Matrigel mixture for 5 days in the (a) absence or (b) presence of added NGAL (20 μg/ml). (c, d) Quantification of cyst area and volume from cells grown as in (a, b). Images were obtained from 10 random fields of three separate experiments. (c) Relative cyst area (calculated as mean pixels2 by outlining 76 cysts (36 from PN18 cells and 40 from PN24 cells) for each condition) and (d) cyst volume (calculated as pixels3 assuming a spherical shape) were determined using the Adobe Photoshop software. *P<0.001.
These results demonstrated that supplemental NGAL can inhibit cyst growth in vitro. To determine if these effects were reproduced in vivo, we utilized a murine model of conditional Pkd1 knockout in the nephron. Pkd1flox/−:Ksp Cre pups35,41 were injected intravenously on P2 and 7 with a replication incompetent adenovirus encoding NGAL,42 or the empty control adenovirus. The adenovirus has been shown to infect primarily the liver, resulting in a moderate increase in circulating and urinary levels of NGAL for 5–7 days post-injection (Figure 5a, average serum NGAL = 1.6-fold greater in NGAL-Adv-injected pups as compared to control Adv pups). Mice were killed on P12 and the kidneys examined. Kidney weight and the ratio of kidney weight to total body weight were significantly diminished in Pkd1flox/−:Ksp-Cre pups that received the NGAL-expressing adenovirus compared to those that received control adenovirus (Figure 5b and c), although they remained substantially larger than control kidneys. Consistent with this partial inhibition of kidney growth, TdT-mediated dUTP nick end labeling (TUNEL) staining revealed a significant increase in apoptosis of cyst-lining cells from the NGAL-treated Pkd1flox/−:Ksp-Cre pups as compared to those that received control adenovirus (Figure 5d). Hematoxylin and eosin sections showed that the kidneys of NGAL-treated Pkd1flox/−:Ksp-Cre pups had cysts that were typically smaller than those in mock-treated Pkd1flox/−:Ksp-Cre littermates, resulting in a decrease in cortical expansion in these animals (Figure 5e). However, extensive cyst formation and growth were present in all tubule segments in both groups as compared to normal kidneys. Consistent with these extensive cystic changes, blood urea nitrogen values were not significantly different in the two groups (Figure 5f).
Figure 5. Expression of NGAL suppresses kidney cyst growth in vivo.

(a) Upper panels: Newborn wild-type mice were injected with either a control adenovirus (control Adv) or NGAL-expressing adenovirus on P2 and serum drawn on P5 for western analysis of circulating NGAL. Each lane represents a separate mouse pup. Lower panel: Western blot of urine obtained on the indicated days from a mouse pup that received a single injection of the NGAL-expressing adenovirus on P2. (b) Kidney and body weights were obtained on P12 from either noncystic mice or Pkd1flox/−:Ksp-Cre mice that had received either control adenovirus or NGAL adenovirus. Normal (n=7), Pkd1flox/−:Ksp-Cre control (n=7), and Pkd1flox/−:Ksp-Cre+NGAL pups (n=6), *P<0.001 vs normal kidney, **P<0.02 vs Pkd1flox/−:Ksp-Cre control. (c) Ratio of kidney weight to body weight (expressed as a percentage) from the mice treated as in (b). *P<0.001 vs normal kidney, **P<0.01 vs Pkd1flox/−:Ksp-Cre control. (d) TUNEL staining was performed on P12 kidneys from Pkd1flox/−:Ksp-Cre treated as in (b). Cyst-lining cells that were TUNEL positive are expressed as a percentage of all cyst-lining cells (identified by DAPI nuclear staining) in threeseparate animals, *P<0.01. (e) H&E stain of representative kidney sections from P12 Pkd1flox/−:Ksp-Cre mice that had received control adenovirus or NGAL adenovirus. The image was taken at ×4 magnification to show the entire cross-section from the renal pelvis to the capsule. (f) BUN values on P12 for the mice treated as in (b).
DISCUSSION
The present studies demonstrate that Pkd1 null cells preferentially form cysts under conditions in which control cells heterozygous for Pkd1, as well as other wild-type renal cell lines, form tubules. Furthermore, Pkd1 null cells exhibit basal rates of proliferation that are higher than control cells and rates of apoptosis that are lower than control cells. The two independent clones of each Pkd1 genotype cell line should minimize the possibility that these differences are due to the method of initial cell isolation or clonal differences arising during cell culture, and suggest instead that selective loss of PC1 expression directly alters cell proliferation as well as the propensity to form cysts.
These results are in conceptual agreement with the studies by Boletta et al.18 in which the overexpression of PC1 in Madin–Darby canine kidney cells resulted in slower proliferation and increased tubulogenesis. However, one notable difference is that they describe decreased rates of apoptosis with overexpression of PC1 in Madin–Darby canine kidney cells whereas we observe decreased rates of apoptosis with selective loss of PC1 in our cell lines. It is possible that this difference reflects a cell-line-specific alteration in susceptibility to apoptotic stimuli. Alternatively, it is possible that there is a bell-shaped effect of PC1 expression levels on rates of apoptosis, similar to the Pkd1 gene dose effect that is demonstrated by the cystic kidney disease present in mice with transgenic overexpression of PC1.43
These results also raise the question of what role apoptosis is playing during cyst formation in polycystic kidney disease. Although it has been reported in several nonorthologous models of rodent cystic kidney disease and recently in a γ-GT-Pkd1 conditional knockout mouse44 that rates of apoptosis are increased and that this can directly promote cyst formation (reviewed in45), we have not observed increased apoptosis in cyst-lining cells of either the Pkd1flox/−:Ksp-Cre mouse35 or the Pkd2WS25 mouse (unpublished data). Thus, the role of apoptosis in cyst formation in autosomal-dominant forms of polycystic kidney disease remains unclear. Furthermore, similar to our results demonstrating that NGAL can increase cyst-lining cell apoptosis and slow cyst growth in the Pkd1flox/−:Ksp-Cre mouse, Ostrom et al.46 have shown that enhanced apoptosis can slow cyst growth in the cpk mouse.
Our data are consistent with the in vivo observations that cyst-lining cells in humans or animals with PKD exhibit an increased mitotic index.47,48 Multiple mechanisms for increased proliferation in Pkd1 null cells have been proposed. Cells lacking functional PC1 have been shown to lose flow-dependent calcium signaling but exhibit a prolonged ligand-activated calcium response,49 which in turn may stimulate PKC activation and increased cell proliferation.50 Recently, PC1 and PC2 have been suggested to regulate cell cycle through interaction with the helix-loop-helix inhibitory protein Id2,32 whereas Nishio et al.51 have suggested increased proliferation of cyst cells due to downregulation of p53. The assays described in the present study were performed in the absence of flow and in subconfluent cells where cilia are not expected to develop. This suggests that PC1-dependent signals mediating the phenotypic differences of increased proliferation and decreased apoptosis observed in the null cells may be independent of cilial signaling activated by flow.
The change from a tubular architecture to cystic architecture in autosomal-dominant polycystic kidney disease occurs when a single cell in the wall of the tubule suffers a mutation in the remaining normal copy of the Pkd gene and the cell undergoes a change in phenotype that includes abnormal proliferation. The net effect of the consequent alteration leads to spherical expansion of one region of the tubule into the surrounding interstitium, that is cyst formation. One interpretation of this model is that polycystins need to regulate two processes: the rate of cell proliferation and tissue polarity of the expanding null cell burden to account for cyst formation.52 This concept has been supported by the mouse models of PKD in which initial tubule development occurs normally until tubule dilatation begins at embryonic day 15.5. Our present experiments, as well as previous studies examining PC1 or PC2 over-expression,18,19 demonstrate that polycystins can regulate the inherent tendency of the cells to organize into cystic or tubular shapes, possibly via pathways that are independent of those regulating cell survival.
We have previously shown that suppression of expression of the small secreted protein NGAL could shift the phenotypic response of wild-type IMCD cells to cystogenesis rather than tubulogenesis.22 In that study, NGAL at ng/ml concentrations was shown to sequester hepatocyte growth factor and prevent in vitro tubulogenesis. In the current study we utilized μg/ml concentrations of NGAL (similar to those used in the studies of Mori et al.53) and found that NGAL can inhibit the growth of Pkd1 null cell-derived cysts, but not the inherent tendency of these cells to form cysts. Thus it appears that the anti-tubulogenic actions of NGAL on normal renal epithelial cells are achieved at low concentrations by the sequestration of extracellular growth factors, whereas the cyst growth-suppressing actions require higher concentrations of NGAL and are mediated by a different mechanism.
In addition to the extracellular sequestration of compounds such as growth factors, two receptors have been identified that can mediate NGAL uptake into cells, 24p3R and megalin (reviewed in54). It has been demonstrated that when NGAL is associated with siderophore or a siderophore-like factor, cellular uptake of the NGAL–siderophore–iron complex will act to deliver iron intracellularly and inhibit apoptosis, whereas uptake of iron-lacking NGAL is postulated to induce apoptosis via the depletion of intracellular iron and subsequent activation of Bim1.23,54 Consistent with these divergent phenotypes of iron-loaded and non-iron-loaded NGAL, Mori et al.53 have shown that a NGAL–siderophore–iron complex when delivered in vivo can protect mice from ischemically induced renal injury by preventing apoptosis of tubular cells. Thus, if taken up in sufficient quantities by the cell, the NGAL used in our experiments (which was purified from bacteria that do not make siderophore) could sequester intracellular iron and induce the apoptotic responses that inhibit cyst growth.
The results of our in vivo delivery of NGAL in Pkd1 cystic mouse pups showed that the sustained modest increase in circulating NGAL achieved with adenoviral delivery led to an increase in cyst-lining cell apoptosis and a slowing of cyst growth as demonstrated by the lesser kidney weight and smaller cyst size histologically. We found that NGAL can inhibit the high level of basal Erk activation seen in Pkd1 null cells. Although this may be contributing to the proapoptotic effect of iron-lacking NGAL, the failure of U0126 to inhibit cyst growth in vivo35 suggests that blockade of Mek inhibition of Erk1/2 phosphorylation alone does not explain the in vivo effects of NGAL observed in the current studies. Despite the decrease in the rate of cyst growth following NGAL expression, nearly all of the tubules had undergone significant cystic dilatation and overall renal function was not improved in these animals. It remains to be determined whether higher levels of NGAL might be more beneficial in these mouse models of PKD, although the potential benefits of slower cyst growth may well be counterbalanced by increased rates of apoptosis in noncystic cells in the kidney and other organs.
MATERIALS AND METHODS
Cell culture
Proximal tubule cell lines null (PN18 and PN24, collectively PN cells) and heterozygous (PH2 and PH3, collectively PH cells) for Pkd1 were made from a single mouse carrying a conditional allele for Pkd1 and the conditionally immortalizing ImmortoMouse (H-2Kb-tsA58) transgene.35 The null and heterozygous cell lines were clonally derived from single parental Pkd1fl/− clones following transient transfection with Cre recombinase. MPT cells are proximal tubule cells derived from the wild-type H-2Kb-tsA58 mouse as previously described.33 All H-2Kb-tsA58-derived cells (PN18, PN24, PH2, PH3, and MPT) were maintained and passaged in DMEM/F12 supplemented with 10% FBS and γ-interferon (5 U/ml; Sigma-Aldrich, St. Louis, MO, USA) at 33 °C and 5% CO2. Cells were changed to γ-interferon-free medium 5 days before usage in the described experiments and maintained at 37 °C to suppress large T antigen expression. mIMCD-3 cells are mouse inner medullary collecting duct cells55 and were cultured at 37 °C in DMEM/F12 supplemented with 10% FBS as described previously.22
In vitro tubulogenesis
In vitro tubulogenesis was performed as described previously.22 Briefly, cells were trypsinized and an equal number (1.5×10⁴ per ml) suspended in a 70:30 mixture of Collagen Type-I and Matrigel (BD Biosciences, San Jose, CA, USA). Cultures were maintained for a period of 1 week in the presence of DMEM/F12+10% FBS at 37 °C/5% CO2. In some experiments cells were cultured in the presence or absence of NGAL (20 μg/ml). Cultures were assessed for the presence of cyst-like or tubular structures by scoring all structures in 10 random ×20 fields/well as either cysts (spherical) or tubules (linear structures). For each experiment, three wells were scored for each cell type and the number and type of structures/×20 field averaged for an n of 1. Representative structures were photographed at ×20 using a Nikon microscope with Hoffman modulation. Images were obtained using a SpotRT digital camera and processed using the Photoshop software.
Evaluation of cell proliferation and apoptosis
Total cell number
Cells were plated at equal amounts (1 × 10⁴ for Pkd cell lines, 1 × 10⁵ for IMCD, and MPT cell lines), cultured for 2 days, and then trypsinized, resuspended and counted using a hemocytometer to determine total cell number.
WST-1 assay
Viable cell numbers were determined using the WST-1 assay as previously described.56 Briefly, 1 × 10⁴ cells per well were plated onto each well of a 96-well plate and cultured for 2 days. WST-1 proliferation reagent (10 μl; Roche Molecular Biochemicals, Indianapolis, IN) was directly added to each well and the cells incubated at 37 °C. The WST-1 reagent is a tetrazolium salt that is cleaved by mitochondrial dehydrogenase to formazan. The amount of formazan released directly correlates with the number of viable cells. After 1.5 h, the colored end product was read at 415 nm with the reference wavelength set at 655 nm. This absorbance, corrected for absorbance of the medium, is shown as the proliferation index.57
BrdU incorporation
Cells were plated under subconfluent conditions and allowed to grow to near confluence in the presence of 10% FBS. To assess the number of proliferating cells, BrdU (10 μm) was added for 30 min before washing and cell trypsinization. BrdU-positive cells were quantified by fluorescence-activated cell sorting (FACS) analysis using the FITC BrdU Flow kit (BD Pharmingen, San Jose, CA, USA).
Apoptosis assay
Apoptosis was assessed by the detection of Annexin V staining using flow cytometry. Annexin V stains the membranes of cells expressing phosphatidylserine in the outer leaflet of the phospholipid bilayer, an early marker of apoptosis.58 To induce apoptosis, cells were serum starved for 2 days. Cells were then trypsinized and incubated with PE Annexin V. Apoptotic cell population was quantified by FACS analysis using the Apoptosis Detection Kit (BD Pharmingen). For detection of apoptosis in kidney sections, TUNEL staining was performed according to the manufacturer's instructions (Roche Molecular Biochemicals). Kidney sections from three animals in each group were scored in a blinded fashion for TUNEL-positive cyst-lining cells and total cyst-lining cells (identified by 4,6-diamidino-2-phenylindole nuclear staining) and the results expressed as percentage of apoptotic cells. Greater than 6000 cells were scored for each phenotype.
Western analysis of mitogen-activated protein kinase activation
Cells were treated ± NGAL for 24 h and western blots of whole cell lysates performed as previously described.22 Activated Erk and total Erk were detected using anti-phosphoErk and anti-Erk antibodies, respectively (1:3000 dilution; Cell Signaling Technologies, Danvers, MA, USA).
In vitro and in vivo experiments with NGAL
In vitro alterations of NGAL
To suppress endogenous NGAL expression, mIMCD-3 cells were stably transfected with two shRNAs directed against NGAL, or a scrambled control shRNA, resulting in a >90% reduction in NGAL secretion as previously described.22 For the addition of exogenous NGAL to Pkd1 null cells, NGAL was synthesized in BL21 bacteria in the absence of bacterial siderophore or iron, and purified as previously described.22
In vitro expression of NGAL
Total RNA was purified from cells by a standard Trizol preparation (Life Technologies Inc., Rockville, MD). cDNA was synthesized from 2 μg of total RNA in a 40 μl reaction, using the MMLV Superscript II enzyme and oligo-dT primer (Life Technologies Inc.). PCR was performed with QuantiTect SYBR Green PCR Master Mix (Qiagen, Valencia, CA, USA) using the iCycler iQ Real-Time PCR Detection System (Bio-Rad, Hercules, CA, USA). Each quantitative PCR reaction (25 μl) was composed of Qiagen PCR Master Mix, 0.3 μm of forward and reverse primers, and 5 μml of cDNA sample (reverse transcriptase product diluted 10 times). The optimized PCR conditions for analysis consisted of 1 cycle enzyme activation at 95 °C for 10 min, followed by 40 cycles at 95 °C for 30 s, 60 °C for 30 s, and 72 °C for 30 s. The abundance of individual transcript was defined by 2−ΔCt method of quantification59 with β-actin cDNA was used as the internal reference.
Adenoviral NGAL delivery in cystic Pkd1 mice
The NGAL expressing adenovirus was generated using the AdTrack cytomegalovirus green fluorescent protein vector as previously described.42 Newborn Pkd1flox/−:Ksp Cre pups35,41 were injected with 10 μl of NGAL adenovirus or empty adenoviral vector on day 2 and day 7 and then killed at day 12. Whole body weight and kidney weight were measured, and kidneys were preserved in formaldehyde for sectioning and hematoxylin and eosin staining. Blood urea nitrogen values were performed by the Mouse Metabolic Phenotyping Center at Yale University using the COBAS Integra system (Roche).
Statistical analysis
A two-tailed Student's t-test was used to analyze and compare data within the groups. Data are presented as mean±s.e.m.
ACKNOWLEDGMENTS
This work was supported by a Polycystic Kidney Disease Center of Excellence grant to SS and LGC (P50 DK57328), and by a Polycystic Kidney Disease Foundation grant to PS.
Footnotes
DISCLOSURE The authors state no conflict of interest.
REFERENCES
- 1.Igarashi P, Somlo S. Genetics and pathogenesis of polycystic kidney disease. J Am Soc Nephrol. 2002;13:2384–2398. doi: 10.1097/01.asn.0000028643.17901.42. [DOI] [PubMed] [Google Scholar]
- 2.Wilson PD. Polycystic kidney disease. N Engl J Med. 2004;350:151–164. doi: 10.1056/NEJMra022161. [DOI] [PubMed] [Google Scholar]
- 3.Reeders ST. Multilocus polycystic disease. Nat Genet. 1992;1:235–237. doi: 10.1038/ng0792-235. [DOI] [PubMed] [Google Scholar]
- 4.Watnick TJ, Torres VE, Gandolph MA, et al. Somatic mutation in individual liver cysts supports a two-hit model of cystogenesis in autosomal dominant polycystic kidney disease. Mol Cell. 1998;2:247–251. doi: 10.1016/s1097-2765(00)80135-5. [DOI] [PubMed] [Google Scholar]
- 5.Wu G, Hayashi T, Park JH, et al. Identification of PKD2L, a human PKD2-related gene: tissue-specific expression and mapping to chromosome 10q25. Genomics. 1998;54:564–568. doi: 10.1006/geno.1998.5618. [DOI] [PubMed] [Google Scholar]
- 6.Qian F, Watnick TJ, Onuchic LF, et al. The molecular basis of focal cyst formation in human autosomal dominant polycystic kidney disease type I. Cell. 1996;87:979–987. doi: 10.1016/s0092-8674(00)81793-6. [DOI] [PubMed] [Google Scholar]
- 7.Ramasubbu K, Gretz N, Bachmann S. Increased epithelial cell proliferation and abnormal extracellular matrix in rat polycystic kidney disease. J Am Soc Nephrol. 1998;9:937–945. doi: 10.1681/ASN.V96937. [DOI] [PubMed] [Google Scholar]
- 8.Sutters M, Germino GG. Autosomal dominant polycystic kidney disease: molecular genetics and pathophysiology. J Lab Clin Med. 2003;141:91–101. doi: 10.1067/mlc.2003.13. [DOI] [PubMed] [Google Scholar]
- 9.Al-Bhalal L, Akhtar M. Molecular basis of autosomal dominant polycystic kidney disease. Adv Anat Pathol. 2005;12:126–133. doi: 10.1097/01.pap.0000163959.29032.1f. [DOI] [PubMed] [Google Scholar]
- 10.Lu W, Fan X, Basora N, et al. Late onset of renal and hepatic cysts in Pkd1-targeted heterozygotes. Nat Genet. 1999;21:160–161. doi: 10.1038/5944. [DOI] [PubMed] [Google Scholar]
- 11.Wu G, Markowitz GS, Li L, et al. Cardiac defects and renal failure in mice with targeted mutations in Pkd2. Nat Genet. 2000;24:75–78. doi: 10.1038/71724. [DOI] [PubMed] [Google Scholar]
- 12.Lu W, Peissel B, Babakhanlou H, et al. Perinatal lethality with kidney and pancreas defects in mice with a targetted Pkd1 mutation. Nat Genet. 1997;17:179–181. doi: 10.1038/ng1097-179. [DOI] [PubMed] [Google Scholar]
- 13.Barr MM, DeModena J, Braun D, et al. The Caenorhabditis elegans autosomal dominant polycystic kidney disease gene homologs lov-1 and pkd-2 act in the same pathway. Curr Biol. 2001;11:1341–1346. doi: 10.1016/s0960-9822(01)00423-7. [DOI] [PubMed] [Google Scholar]
- 14.Pazour GJ, San Agustin JT, Follit JA, et al. Polycystin-2 localizes to kidney cilia and the ciliary level is elevated in orpk mice with polycystic kidney disease. Curr Biol. 2002;12:R378–R380. doi: 10.1016/s0960-9822(02)00877-1. [DOI] [PubMed] [Google Scholar]
- 15.Yoder BK, Hou X, Guay-Woodford LM. The polycystic kidney disease proteins, polycystin-1, polycystin-2, polaris, and cystin, are co-localized in renal cilia. J Am Soc Nephrol. 2002;13:2508–2516. doi: 10.1097/01.asn.0000029587.47950.25. [DOI] [PubMed] [Google Scholar]
- 16.Praetorius HA, Spring KR. The renal cell primary cilium functions as a flow sensor. Curr Opin Nephrol Hypertens. 2003;12:517–520. doi: 10.1097/00041552-200309000-00006. [DOI] [PubMed] [Google Scholar]
- 17.Nauli SM, Zhou J. Polycystins and mechanosensation in renal and nodal cilia. Bioessays. 2004;26:844–856. doi: 10.1002/bies.20069. [DOI] [PubMed] [Google Scholar]
- 18.Boletta A, Qian F, Onuchic LF, et al. Polycystin-1, the gene product of PKD1, induces resistance to apoptosis and spontaneous tubulogenesis in MDCK cells. Mol Cell. 2000;6:1267–1273. doi: 10.1016/s1097-2765(00)00123-4. [DOI] [PubMed] [Google Scholar]
- 19.Grimm DH, Karihaloo A, Cai Y, et al. Polycystin-2 regulates proliferation and branching morphogenesis in kidney epithelial cells. J Biol Chem. 2006;281:137–144. doi: 10.1074/jbc.M507845200. [DOI] [PubMed] [Google Scholar]
- 20.Wilson PD, Geng L, Li X, et al. The PKD1 gene product, `polycystin-1,' is a tyrosine-phosphorylated protein that colocalizes with alpha2beta1-integrin in focal clusters in adherent renal epithelia. Lab Invest. 1999;79:1311–1323. [PubMed] [Google Scholar]
- 21.Joly D, Ishibe S, Nickel C, et al. The polycystin 1-C-terminal fragment stimulates ERK-dependent spreading of renal epithelial cells. J Biol Chem. 2006;281:26329–26339. doi: 10.1074/jbc.M601373200. [DOI] [PubMed] [Google Scholar]
- 22.Gwira JA, Wei F, Ishibe S, et al. Expression of neutrophil gelatinase-associated lipocalin regulates epithelial morphogenesis in vitro. J Biol Chem. 2005;280:7875–7882. doi: 10.1074/jbc.M413192200. [DOI] [PubMed] [Google Scholar]
- 23.Devireddy LR, Gazin C, Zhu X, et al. A cell-surface receptor for lipocalin 24p3 selectively mediates apoptosis and iron uptake. Cell. 2005;123:1293–1305. doi: 10.1016/j.cell.2005.10.027. [DOI] [PubMed] [Google Scholar]
- 24.Flower DR, North AC, Attwood TK. Structure and sequence relationships in the lipocalins and related proteins. Protein Sci. 1993;2:753–761. doi: 10.1002/pro.5560020507. [DOI] [PMC free article] [PubMed] [Google Scholar]
- 25.Goetz DH, Willie ST, Armen RS, et al. Ligand preference inferred from the structure of neutrophil gelatinase associated lipocalin. Biochemistry. 2000;39:1935–1941. doi: 10.1021/bi992215v. [DOI] [PubMed] [Google Scholar]
- 26.Hvidberg V, Jacobsen C, Strong RK, et al. The endocytic receptor megalin binds the iron transporting neutrophil-gelatinase-associated lipocalin with high affinity and mediates its cellular uptake. FEBS Lett. 2005;579:773–777. doi: 10.1016/j.febslet.2004.12.031. [DOI] [PubMed] [Google Scholar]
- 27.Schmidt-Ott KM, Mori K, Li JY, et al. Dual action of neutrophil gelatinase-associated lipocalin. J Am Soc Nephrol. 2007;18:407–413. doi: 10.1681/ASN.2006080882. E-pub 2007 January 2017. [DOI] [PubMed] [Google Scholar]
- 28.Nickel C, Benzing T, Sellin L, et al. The polycystin-1 C-terminal fragment triggers branching morphogenesis and migration of tubular kidney epithelial cells. J Clin Invest. 2002;109:481–489. doi: 10.1172/JCI12867. [DOI] [PMC free article] [PubMed] [Google Scholar]
- 29.Chen D, Roberts R, Pohl M, et al. Differential expression of collagen- and laminin-binding integrins mediates ureteric bud and inner medullary collecting duct cell tubulogenesis. Am J Physiol Renal Physiol. 2004;287:F602–F611. doi: 10.1152/ajprenal.00015.2004. E-pub 2004 June 2008. [DOI] [PubMed] [Google Scholar]
- 30.Karihaloo A, Nickel C, Cantley LG. Signals which build a tubule. Nephron Exp Nephrol. 2005;100:e40–e45. doi: 10.1159/000084111. [DOI] [PubMed] [Google Scholar]
- 31.Bhunia AK, Piontek K, Boletta A, et al. PKD1 induces p21(waf1) and regulation of the cell cycle via direct activation of the JAK-STAT signaling pathway in a process requiring PKD2. Cell. 2002;109:157–168. doi: 10.1016/s0092-8674(02)00716-x. [DOI] [PubMed] [Google Scholar]
- 32.Li X, Luo Y, Starremans PG, et al. Polycystin-1 and polycystin-2 regulate the cell cycle through the helix-loop-helix inhibitor Id2. Nat Cell Biol. 2005;7:1202–1212. doi: 10.1038/ncb1326. [DOI] [PubMed] [Google Scholar]
- 33.Sinha D, Wang Z, Price VR, et al. Chemical anoxia of tubular cells induces activation of c-Src and its translocation to the zonula adherens. Am J Physiol Renal Physiol. 2003;284:F488–F497. doi: 10.1152/ajprenal.00172.2002. E-pub 2002 November 2005. [DOI] [PubMed] [Google Scholar]
- 34.Karihaloo A, Karumanchi SA, Cantley WL, et al. Vascular endothelial growth factor induces branching morphogenesis/tubulogenesis in renal epithelial cells in a neuropilin-dependent fashion. Mol Cell Biol. 2005;25:7441–7448. doi: 10.1128/MCB.25.17.7441-7448.2005. [DOI] [PMC free article] [PubMed] [Google Scholar]
- 35.Shibazaki S, Yu Z, Nishio S, et al. Cyst formation and activation of the extracellular regulated kinase pathway after kidney specific inactivation of Pkd1. Hum Mol Genet. 2008;7:7. doi: 10.1093/hmg/ddn039. [DOI] [PMC free article] [PubMed] [Google Scholar]
- 36.Dixon RJ, Brunskill NJ. Lysophosphatidic acid-induced proliferation in opossum kidney proximal tubular cells: role of PI 3-kinase and ERK. Kidney Int. 1999;56:2064–2075. doi: 10.1046/j.1523-1755.1999.00797.x. [DOI] [PubMed] [Google Scholar]
- 37.Yamaguchi T, Pelling JC, Ramaswamy NT, et al. cAMP stimulates the in vitro proliferation of renal cyst epithelial cells by activating the extracellular signal-regulated kinase pathway. Kidney Int. 2000;57:1460–1471. doi: 10.1046/j.1523-1755.2000.00991.x. [DOI] [PubMed] [Google Scholar]
- 38.Xia Z, Dickens M, Raingeaud J, et al. Opposing effects of ERK and JNK-p38 MAP kinases on apoptosis. Science. 1995;270:1326–1331. doi: 10.1126/science.270.5240.1326. [DOI] [PubMed] [Google Scholar]
- 39.Buckley S, Driscoll B, Barsky L, et al. ERK activation protects against DNA damage and apoptosis in hyperoxic rat AEC2. Am J Physiol. 1999;277:L159–L166. doi: 10.1152/ajplung.1999.277.1.L159. [DOI] [PubMed] [Google Scholar]
- 40.Zhuang S, Yan Y, Daubert RA, et al. ERK promotes hydrogen peroxide-induced apoptosis through caspase-3 activation and inhibition of Akt in renal epithelial cells. Am J Physiol Renal Physiol. 2007;292:F440–F447. doi: 10.1152/ajprenal.00170.2006. [DOI] [PubMed] [Google Scholar]
- 41.Shao X, Somlo S, Igarashi P. Epithelial-specific Cre/lox recombination in the developing kidney and genitourinary tract. J Am Soc Nephrol. 2002;13:1837–1846. doi: 10.1097/01.asn.0000016444.90348.50. [DOI] [PubMed] [Google Scholar]
- 42.Seth P, Porter D, Lahti-Domenici J, et al. Cellular and molecular targets of estrogen in normal human breast tissue. Cancer Res. 2002;62:4540–4544. [PubMed] [Google Scholar]
- 43.Pritchard L, Sloane-Stanley JA, Sharpe JA, et al. A human PKD1 transgene generates functional polycystin-1 in mice and is associated with a cystic phenotype. Hum Mol Genet. 2000;9:2617–2627. doi: 10.1093/hmg/9.18.2617. [DOI] [PubMed] [Google Scholar]
- 44.Starremans PG, Li X, Finnerty PE, et al. A mouse model for polycystic kidney disease through a somatic in-frame deletion in the 5′ end of Pkd1. Kidney Int. 2008;73:1394–1405. doi: 10.1038/ki.2008.111. [DOI] [PubMed] [Google Scholar]
- 45.Edelstein CL. What is the role of tubular epithelial cell apoptosis in polycystic kidney disease (PKD)? Cell Cycle. 2005;4:1550–1554. doi: 10.4161/cc.4.11.2185. [DOI] [PubMed] [Google Scholar]
- 46.Ostrom L, Tang MJ, Gruss P, et al. Reduced Pax2 gene dosage increases apoptosis and slows the progression of renal cystic disease. Dev Biol. 2000;219:250–258. doi: 10.1006/dbio.2000.9618. [DOI] [PubMed] [Google Scholar]
- 47.Nadasdy T, Laszik Z, Lajoie G, et al. Proliferative activity of cyst epithelium in human renal cystic diseases. J Am Soc Nephrol. 1995;5:1462–1468. doi: 10.1681/ASN.V571462. [DOI] [PubMed] [Google Scholar]
- 48.Lanoix J, D'Agati V, Szabolcs M, et al. Dysregulation of cellular proliferation and apoptosis mediates human autosomal dominant polycystic kidney disease (ADPKD) Oncogene. 1996;13:1153–1160. [PubMed] [Google Scholar]
- 49.Nauli SM, Alenghat FJ, Luo Y, et al. Polycystins 1 and 2 mediate mechanosensation in the primary cilium of kidney cells. Nat Genet. 2003;33:129–137. doi: 10.1038/ng1076. [DOI] [PubMed] [Google Scholar]
- 50.Manzati E, Aguiari G, Banzi M, et al. The cytoplasmic C-terminus of polycystin-1 increases cell proliferation in kidney epithelial cells through serum-activated and Ca(2+)-dependent pathway(s) Exp Cell Res. 2005;304:391–406. doi: 10.1016/j.yexcr.2004.10.023. [DOI] [PubMed] [Google Scholar]
- 51.Nishio S, Hatano M, Nagata M, et al. Pkd1 regulates immortalized proliferation of renal tubular epithelial cells through p53 induction and JNK activation. J Clin Invest. 2005;115:910–918. doi: 10.1172/JCI22850. [DOI] [PMC free article] [PubMed] [Google Scholar]
- 52.Fischer E, Legue E, Doyen A, et al. Defective planar cell polarity in polycystic kidney disease. Nat Genet. 2006;38:21–23. doi: 10.1038/ng1701. E-pub 2005 December 2011. [DOI] [PubMed] [Google Scholar]
- 53.Mori K, Lee HT, Rapoport D, et al. Endocytic delivery of lipocalin–siderophore–iron complex rescues the kidney from ischemia-reperfusion injury. J Clin Invest. 2005;115:610–621. doi: 10.1172/JCI23056. [DOI] [PMC free article] [PubMed] [Google Scholar]
- 54.Schmidt-Ott KM, Mori K, Li JY, et al. Dual action of neutrophil gelatinase-associated lipocalin. J Am Soc Nephrol. 2007;18:407–413. doi: 10.1681/ASN.2006080882. [DOI] [PubMed] [Google Scholar]
- 55.Rauchman M, Nigam S, Delpire E, et al. An osmotically tolerant inner medullary collecting duct cell line from an SV40 transgenic mouse. Am J Physiol: Renal. 1993;265:F416–F424. doi: 10.1152/ajprenal.1993.265.3.F416. [DOI] [PubMed] [Google Scholar]
- 56.Ueland JM, Gwira J, Liu ZX, et al. The chemokine KC regulates HGF-stimulated epithelial cell morphogenesis. Am J Physiol Renal Physiol. 2004;286:F581–F589. doi: 10.1152/ajprenal.00289.2003. [DOI] [PubMed] [Google Scholar]
- 57.Ishiyama M, Tominaga H, Shiga M, et al. A combined assay of cell viability and in vitro cytotoxicity with a highly water-soluble tetrazolium salt, neutral red and crystal violet. Biol Pharm Bull. 1996;19:1518–1520. doi: 10.1248/bpb.19.1518. [DOI] [PubMed] [Google Scholar]
- 58.Koopman G, Reutelingsperger CP, Kuijten GA, et al. Annexin V for flow cytometric detection of phosphatidylserine expression on B cells undergoing apoptosis. Blood. 1994;84:1415–1420. [PubMed] [Google Scholar]
- 59.Fink L, Seeger W, Ermert L, et al. Real-time quantitative RT-PCR after laser-assisted cell picking. Nat Med. 1998;4:1329–1333. doi: 10.1038/3327. [DOI] [PubMed] [Google Scholar]