Abstract
A novel expression vector constructed from genes of Pichia pastoris was applied for heterologous gene expression in Saccharomyces cerevisiae. Recombinant streptokinase (SK) was synthesized by cloning the region encoding mature SK under the control of glyceraldehyde 3-phosphate dehydrogenase (GAP) promoter of Pichia pastoris in Saccharomyces cerevisiae. SK was intracellularly expressed constitutively, as evidenced by lyticase-nitroanilide and caseinolytic assays. The functional activity was confirmed by plasminogen activation assay and in vitro clot lysis assay. Stability and absence of toxicity to the host with the recombinant expression vector as evidenced by southern analysis and growth profile indicate the application of this expression system for large-scale production of SK. Two-stage statistical approach, Plackett-Burman (PB) design and response surface methodology (RSM) was used for SK production medium optimization. In the first stage, carbon and organic nitrogen sources were qualitatively screened by PB design and in the second stage there was quantitative optimization of four process variables, yeast extract, dextrose, pH, and temperature, by RSM. PB design resulted in dextrose and peptone as best carbon and nitrogen sources for SK production. RSM method, proved as an efficient technique for optimizing process conditions which resulted in 110% increase in SK production, 2352 IU/mL, than for unoptimized conditions.
1. Introduction
Streptokinase (SK) is a nonenzymatic thrombolytic protein secreted by Lancefield group C strains of beta hemolytic streptococci and is important in their virulence [1, 2]. A growing thrombotic mass may lead to partial or complete thrombotic arterial occlusion and end-organ ischemia or infarction. SK activates the fibrinolytic system indirectly by forming a 1 : 1 stoichiometric complex with plasminogen or plasmin. When fibrin thrombi develop, plasminogen adsorbs to the clot and SK penetrates the clot, activating plasminogen to plasmin, a proteolytic enzyme which dissolves the clot from within. SK has been used successfully in the treatment of pulmonary embolism, myocardial infarction, arterial/deep vein thrombosis, and clotted arteriovenous fistulae [1, 3].
Fibrinolytic molecules (enzymes/nonenzymes) were extracted, purified to homogeneity from a variety of microbial sources, and tested for their efficacy and toxigenicity [1, 4–6]. The Streptococcus equisimilis H46A strain expressing SK is pathogenic and also secretes other potent antigenic toxins. The skc gene encoding SK (47 kDa) is produced in a heterologous host that is generally regarded as safe (GRAS) organism. A variety of bacterial and yeast hosts were successfully exploited for the production of active SK [7, 8]. S. cerevisiae, due to its extensive data on gene manipulation tools, is the traditional host for the production of heterologous proteins. The advent of alcohol oxidase (AOX) expression system of P. pastoris led to successful protein industrialization. The disadvantages associated with AOX expression system are chiefly that the methanol utilization led to the development of alternate promoter systems GAP, FLD, and ICL1 for protein expression. Of the above promoters, GAP-(glyceraldehyde 3 phosphate dehydrogenase-) based promoter system has been extensively applied for constitutive continuous bioprocess [7, 9–12]. SK was expressed as intracellular/secretory molecule in P. pastoris and Schizosaccharomyces pombe [7, 13–15].
Microtiter analyses have been used to determine protein contents, enzyme activities, ligand binding and are increasingly popular with the use of colorimetry/ fluorescence for efficiency and throughput. They have also been used to determine growth and lysis by spheroplast lysis assay [16–18]. We describe here the adaptation of this assay in conjunction with a chromogenic substrate for qualitative detection of SK levels in yeast clones [19].
SK production was maximized by screening carbon and nitrogen sources using two-evel Plackett-Burman (PB) design [20]. Conventionally, optimization of the process variables involves changing one variable at a time while others are held constant. Practically, this method is laborious to test every possible combination of test variables as it results in large number of experiments [21, 22]. Besides, it does not consider the effect of interactions of various parameters. Alternatively, response surface methodology (RSM) can be used to evaluate and understand interaction among process variables [23]. RSM was successfully applied into bioprocess parameter optimization [24–28].
We have previously reported the production of hepatitis B surface antigen (HBsAg) in S. cerevisiae utilizing GAP promoter of P. pastoris [12]. The same vector backbone was used for SK expression. In the current, investigation we have explored the following: (1) intracellular expression of SK in S. cerevisiae utilizing GAP promoter of P. pastoris (2) optimization of nutrients for SK production using the above expression system by response surface methodology (RSM) and comparison between normal and baffled flasks, and (3) qualitative SK detection by Lyticase-nitroanilide assay (LNA). We report the successful constitutive intracellular expression of SK in S. cerevisiae, detection by LNA, followed by increased production using baffled-flask design after RSM. Significantly, peptone and dextrose have shown the maximal SK production. We have obtained a level of expression considerable to that achieved in other yeast systems.
2. Materials and Methods
2.1. Materials
Media for bacterial and yeast growth Todd-Hewitt broth himedia (Mumbai, India) and yeast extract peptone dextrose (YPD) from USB (Cleveland, OH) were used. Restriction enzymes, T4 DNA ligases, were purchased from New England Biolabs (Beverly, MA). PCR was performed with Eppendorf mastercycler using Pfu DNA polymerase (Stratagene, CA, USA). Plasmid transformation and retainment were done in Escherichia coli DH5α from Gibco BRL (Gaithersburg, MD). Saccharomyces cerevisiae INVSC1 (MATa, his3D1, leu2, trp1-289, and ura3-52) from Invitrogen (Carlsband, CA, USA) is used in expression studies. Human plasminogen, thrombin, and fibrinogen were purchased from Calbiochem (La Jolla, CA)/Sigma (St.Louis, MO). Nitroanilide substrate S-2251 is purchased from Fluka (Buchs/Switzerland).
2.2. Growth Media and Conditions
All E. coli DH5 α based experiments were performed in low-salt luria broth (1% tryptone, and 0.5% yeast extract, 0.5% NaCl pH 7.5) medium with Zeocin (25 μg/mL). Transformants of S. cerevisiae were selected on YPD (1% yeast extract, 2% peptone, and 2% dextrose) medium with Zeocin (200 μg/mL) at 30°C. For protein expression, S. cerevisiae were cultured in YPD medium at 30°C.
2.3. Construction of Recombinant Streptokinase Expression Vector
SK coding region was amplified by PCR using P1-CAGCAGGAATTCATTGCTG GACCTGAGTGG, and P2-TCCCCTCGAGTTATTTGTCGTTAGGGTTATC primers from pGAPZA-SK vector [7] in a gene Eppendorf mastercycler PCR system and ligated to pB2ZB2 vector [12] downstream of GAP promoter at EcoRI and XhoI sites. In-frame cloning of skc gene between GAP promoter and AOX TT terminator in the expression plasmid was analyzed by restriction digestion and DNA sequencing as described previously [7]. The resulting recombinant plasmid pB2ZB2-SK (Figure 1) was maintained in E. coli DH5 α with Zeocin as a selection pressure. pB2ZB2-SK was used as an integrative expression vector to transform S. cerevisiae.
Figure 1.
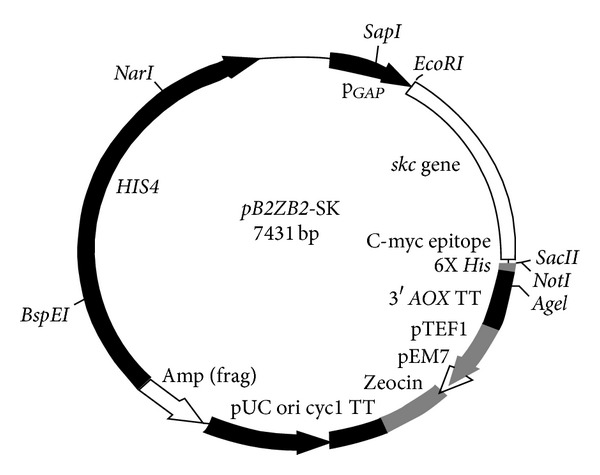
Plasmid map of expression vector pB2ZB2-SK constructed to express streptokinase in S. cerevisiae. 1.25 Kbp skc gene is operably cloned downstream to GAP promoter generating a recombinant pB2ZB2-SK expression vector. Appropriate restriction endonuclease sites are designated.
2.4. Transformation and Screening of S. cerevisiae with pB2ZB2-SK
S. cerevisiae were transformed with NarI-linearized pB2ZB2-SK vector (7431 bp) by lithium acetate method and selected as detailed earlier [12]. The transformants were screened for PGAP-skc-AOXTT cassette by colony PCR [7].
2.4.1. Lyticase Nitroanilide Assay (LNA Assay)
A part of the transformant colony was inoculated in a 96-well conical-bottomed microtest plate (Thermo Scientific Microtiter plates) with each well containing 300 μL of YPD-Zeocin medium. The plate was properly sealed and incubated at 30°C, 100 rpm for 16 h to obtain exponential-phase cells. Doubling time of log phase for Saccharomyces in YPD medium is ~90 min. The density of cells in liquid culture was determined at A600 (Thermo Multiskan Spectrum spectrophotometer). A fresh 96-well conical-bottomed plate was inoculated with 0.3 OD cells with each well containing 300 μL of YPD medium and incubated at 30°C, 100 rpm for 24 h. After incubation, cell density was determined and the plates were centrifuged for 5 min at 430 g (Eppendorf microcentrifuge 5430 R). The supernatant was discarded from each well using a vacuum pump. The cells were washed in PBS and centrifuged for 2 min at 430 g. The culture was diluted in Z buffer (60 mM Na2HPO4, 40 mM NaH2PO4, 10 mM KCl, 1 mM MgSO4, and 50 mM β-ME, pH 7.0) to obtain 0.6 OD. 50 μL of lyticase (10 μg) was added to the cell suspension and incubated for 30 min at 22°C with no shaking. This is followed by addition and incubation of 100 μL of 0.01% Triton X-100 solution for 15 min at 22°C. After incubation, plates were centrifuged for 5–10 min at 430 g. If cell lysis is incomplete, freeze thawing at −80°C was done.
A 20 μL of cell-lysis supernatant was transferred to flat-bottom 96-well microtitration plates (Thermo Scientific) and proceeded with S-2251 assay. Control samples were prepared by adding 20 μL 0.1 M Tris-HCl buffer, pH 7.4, 30 μL substrate S-2251 (0.6 mM), and 100 μL plasminogen solution (0.1 CU/mL). In the test samples, the reaction was performed after the addition of 20 μL SK, 30 μL S-2251, and 100 μL plasminogen solutions. The plate was immediately placed in the plate reader previously heated at 37°C. The absorbance of the wells was measured at 405 nm every 30 s for 30 min. Plates were shaken for 5 s before reading the absorbance using a Thermo Multiskan Spectrum spectrophotometer and analyzing with SkanIt software. A calibration curve was constructed from five measurements with reference standards (50–2500 IU/mL). Each SK dilution was assayed a minimum of three times. One unit of SK is defined as the amount of enzyme activity that converts 1 μmol of substrate per min per Liter.
2.5. Time Course/Expression Experiments
S. cerevisiae clone with maximum SK expression (S.cerv-SK), screened by LNA assay, was cultured in a 10 mL YPD medium at 30°C for 24 hrs, 180 rpm. 1.0 OD of 24 hr culture was inoculated in a 25 mL YPD medium in a 150 mL normal/baffled flask [29]. A time course study was performed at 30°C, 180 rpm for 120 hrs to evaluate the growth and expression profile. S. cerevisiae harboring only the parent plasmid and untransformed strains were used as controls. Cell lysates of S.cerv-SK clone were prepared as discussed previously [12] and soluble SK was screened using chromogenic assay and clot lysis assay. The cell lysate was analyzed for expression of rSK or stored at −70°C.
2.6. Southern Analysis
Genomic DNA was isolated from S. cerevisiae culture as per the standard procedure [30]. Quantified genomic DNA (10 μg) was restricted with SapI and AgeI and electrophoresed on 0.8% agarose gel. Resolved fragments were transferred to Hybond nylon membrane, probed with 1.63 Kbp PGAP-skc-AOXTT cassette fragment, and radiolabeled by nick translation kit (GIBCO-BRL) with [α-32P] dCTP. A PGAP-skc-AOXTT cassette fragment was generated by digestion of pB2ZB2-SK vector with SapI and AgeI. DNA from untransformed host was also included in the analysis. After hybridization and washing, PGAP-skc-AOXTT insertion to yeast genomic DNA was visualized by autoradiography.
2.7. Activity Assay Methods
Plasminogen activation assay, fibrin plate lysis assay, and in vitro clot lysis assay were performed as described previously [19, 31–35]. Purified native SK (Streptase) was used as a standard.
2.8. Carbon and Organic Nitrogen Sources Screening by Plackett-Burman Design
The aim of the present study was to screen significant carbon and organic nitrogen sources with respect to their main effects on SK production by PB design, but it is not intended to study interaction effects between various medium constituents. Different carbon sources, namely, dextrose, galactose, fructose, maltose, sucrose, lactose, and glycerol, and nitrogen sources, namely, yeast extract, tryptone, peptone, casamino acids, beef extract corn steep liquor, and polypeptone, were screened by PB design. Seven carbon and nitrogen sources were selected with each variable at two levels, high concentrations (+1; 2%) and low concentrations (−1; 1%), respectively, and tested for SK production.
Experiments were carried in 250 mL Erlenmeyer flasks with 100 mL of production medium. Different carbon and nitrogen sources were screened at 1% yeast extract, 2% peptone, pH 7.0, 200 rpm, and 2% dextrose, pH 7.0, 200 rpm for SK production, respectively. Supplementary Tables S1 and S2, available online at http://dx.doi.org/10.1155/2013/268249, shows design matrix (eight experiments) generated by PB to screen carbon and nitrogen sources. Number of positive signs and negative signs per trial are (k + 1)/2 and (k − 1)/2, respectively. Here, k represents the number of variables, that is, 7 for both carbon and nitrogen sources. Columns of design matrix (supplementary Tables S1 and S2) should have equal number of positive and negative signs, meaning that each row represents a trial run and each column represents an independent variable. The effect of each variable was determined by the following equation:
| (1) |
where E(x i) is the concentration effect of the tested variable; M i + and M i − are from the trials where the variable (x i) measured at high and low concentrations, respectively; N is the number of trials. STATISTICA 6.0 (Stat Soft, Inc, Tulsa, OK) software was used for regression and graphical analysis of the data obtained.
2.9. Experimental Design and Optimization of SK Production Medium by RSM [21–23]
Optimum SK production medium composition was achieved by estimating the levels of parameters using RSM. RSM is an empirical technique used for the evaluation of relationships between a cluster of controlled experimental factors and measured responses. A central composite design (CCD) was used for RSM studies. CCD has the total number of combinations 2k + 2∗k + n 0, where k is the number of independent variables and n 0 is the number of repetitions of the experiments at the center point. Four important SK production medium components were selected by the best results of conventional (one at a time) approach. Further, these four parameters were evaluated for their interactive behaviors by using a statistical approach. The levels of four variables, namely, yeast extract, 2.6% (x 1); dextrose, 2.7% (x 2); pH, 7.1 (x 3), and temperature, 30°C (x 4) were coded at five levels −2, −1, 0, 1, and, 2 by using (2).
For statistical calculations, the variables X i were coded as x i according to the following transformation.
The range and levels of the variables in coded units for RSM studies are given in supplementary Table S3. Consider
| (2) |
where x i is the dimensionless coded value of the variable X i, X 0 is the value of the X i at the center point, and ΔX is the step change.
The behavior of the system was explained by the following quadratic model (3).
| (3) |
where Y is the predicted response, β 0 is the intercept term, β i is the linear effect, β ii is the multiple effect, and β ij is the interaction effect. The full quadratic equation for four factors is given by model (4).
| (4) |
In the present study, a 24 full factorial central composite design with eight points and six replicates at central point was used to fit the second-order polynomial equation. This approach has resulted in 30 experiments. Regression and graphical analysis of data were carried out by STATISTICA 6.0 (Stat Soft, Inc, Tulsa, OK). Selection of optimum combination of four test variables for the better SK production was performed according to the CCD experimental plan (supplementary Table S4). Analysis of variance (ANOVA) was used for regression equations to obtain optimal levels of SK production as a function of the initial values of yeast extract, dextrose, pH, and temperature.
3. Results and Discussion
Streptokinase was expressed intracellularly with no posttranslational proteolysis in P. pastoris by AOX1 [13] and GAP [7] promoters. Constitutive intracellular expression, continuous bioprocess in YPD medium for SK were achieved with P. pastoris [7]. Expression of SK in S. cerevisiae either by intracellular or secretory mode was not reported previously. The present study demonstrates the constitutive expression of rSK intracellularly in S. cerevisiae by employing the GAP promoter of P. pastoris. This is the first report of a GAP promoter operable, dominant selective, optimized constitutive intracellular expression of recombinant SK in S. cerevisiae.
3.1. Construction of Recombinant Expression Vectors
The pB2ZB2 plasmid contains the PGAP-skc-AOXTT cassette, wild-type histidinol dehydrogenase (HIS4) gene for linearized integration into host genome and Zeocin cassette bi-functional in both S. cerevisiae and E. coli for the selection of transformants.The skc gene was cloned into the pB2ZB2 vector generating recombinant expression vector pB2ZB2-SK (Figure 1). The cloning of skc gene downstream of GAP promoter was confirmed by PCR and nucleotide sequencing. Genetic markers like HIS4 and ARG4 of S. cerevisiae were used in episomal and integrative vectors in P. pastoris [36]. SUC2 marker of S. cerevisiae was used as dominant selection in P. pastoris [36]. Constitutive promoters like PGK1 (Phospho Glycerate Kinase) and TDH3 (Triose Phosphate Dehydrogenase 3) of S. cerevisiae have been used for heterologous protein expression [36, 37].
HIS4 locus encoding histidinol dehydrogenase in P. pastoris and S. cerevisiae shares more than 50% homology at DNA level. NarI restriction site in HIS4 locus was chosen to linearize the recombinant pB2ZB2-SK vector, as the sequence homology around this site is more than 85%. Efficient integration to S. cerevisiae HIS4 locus by homologous recombination with P. pastoris HIS4 locus was successfully achieved. Integration of skc gene expression cassette was confirmed by PCR with promoter- and terminator-specific primers and by southern hybridization indicating that the expression of SK is in fact mediated by GAP promoter.
3.2. Generation of Constitutive Saccharomyces-SK Clones
NarI linearized pB2ZB2-SK recombinant vector was used to transform S. cerevisiae. Saccharomyces transformants integrated with the constitutive SK expression cassette were selected on YPD agar plates containing Zeocin for 3-4 days at 30°C (Figure 2(a)). The presence of 1.5 Kbp PGAP-skc-AOXTT insert in Saccharomyces transformants was confirmed by colony PCR (Figure 2(b)). 85 transformants selected with Zeocin were analyzed for SK expression by LNA assay. 84 transformants had SK expression, and the clone (S.cerv-SK) with 1050 IU/mL is chosen for further experiments. Southern hybridization analysis of the S.cerv-SK probed with PGAP-skc-AOXTT DNA fragment generated a 1.63 Kbp product (Figure 4).
Figure 2.
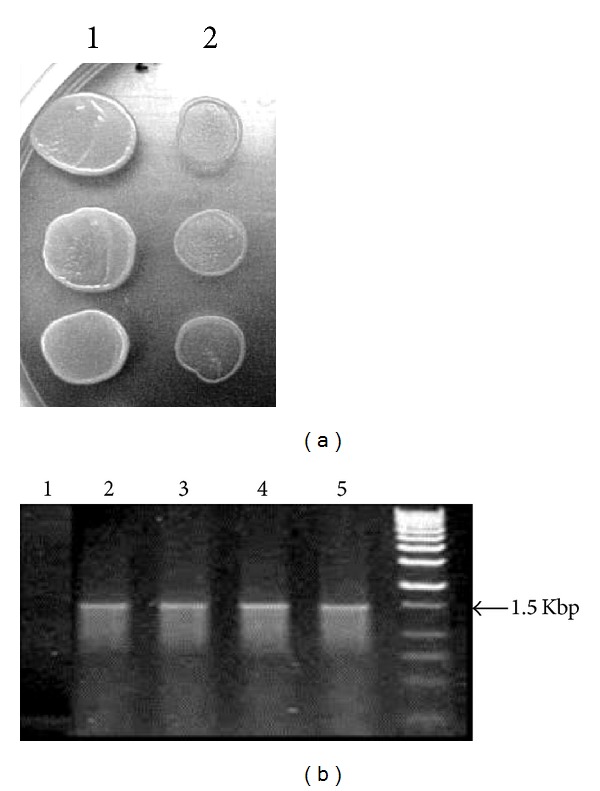
Screening of S. cerevisiae transformants. (a) S. cerevisiae transformed with pB2ZB2-SK expression vector were selected on YPD-Zeocin (200 μg/mL) medium. Transformants with pB2ZB2-SK vector (Lane 1), untransformed S. cerevisiae (Lane 2). (b) Colony PCR (P3 and P4 primers) of Saccharomyces transformants selected on YPD Zeocin medium. Untransformed S. cerevisiae (Lane 1), transformants with 1.5 Kbp skc expression cassette fragments (Lanes 2, 3, 4, and 5) and 0.25–12.0 Kbp DNA ladder (Lane 6).
Figure 4.
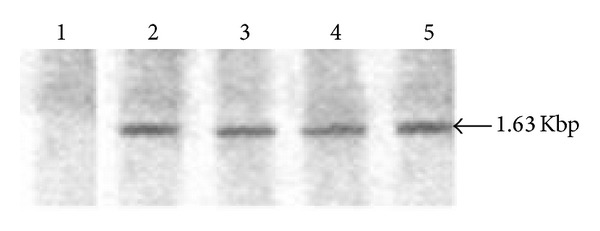
Southern blot analyses of S. cerevisiae-SK clone. Genomic 635 DNA of the clone was restricted with SapI/AgeI enzymes, blotted, and hybridized with α32P-labelled 1.63 Kbp PGAP-skc-AOXTT cassette fragment. S. cerevisiae clone genomic DNA extracted at 24 (Lane 2), 72 (Lane 3), 96 (Lane 4), and 120 hrs (Lane 5) and untransformed S. cerevisiae genomic DNA (Lane 1). 1.63 Kbp PGAP-skc-AOXTT cassette fragment is specified.
3.3. Growth and Expression Profile
A comparative growth/expression analysis was performed between normal and baffled-flask cultures. Quantification of SK activity by plasminogen activation assay using cell lysates indicated an expression level of 1050 IU/mL in a normal flask and 1300 IU/mL for a baffled flask (Figure 3(a)). All the media optimization experiments were conducted with baffle-flask design.
Figure 3.
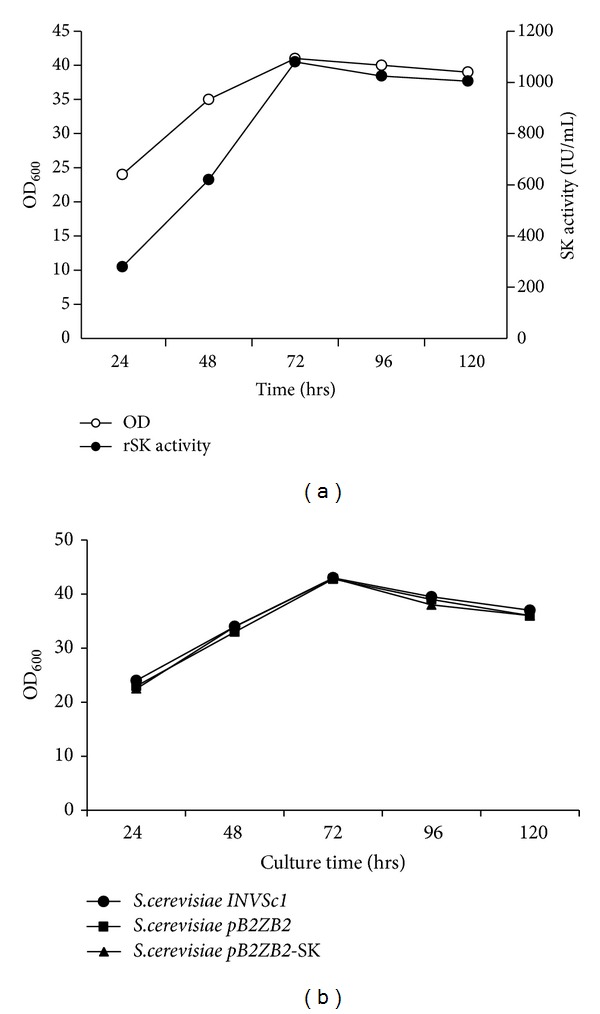
(a) Plasminogen activation assay of rSK. Growth profile and outline of SK expression of S. cerevisiae clone. Cells were grown in YPD medium for 5 days. Aliquots of cells were examined at different time intervals for growth and SK activity in the cell lysis supernatant by chromogenic assay using S-2251 substrate. (b) Expression of rSK has no toxic effect on the growth rate of the S. cerevisiae host. S. cerevisiae INVSc1 cells were transformed with parent plasmids and recombinant expression vector pB2ZB2-SK. Cells were cultured in YPD broth and aliquots were withdrawn at indicated time points up to 120 hrs, OD600 recorded and plotted. The above data is a mean of three to six independent experiments.
Stability and integration of skc gene in the Saccharomyces clone expressing SK were analyzed by southern blot analysis. 1.63 Kbp band is consistently seen from 24 to 120 hrs indicating stability of the continuously cultured clone (Figure 4).
The toxicity of continuous expression of SK on the host cells harboring the plasmids pB2ZB2-SK and pB2ZB2 and parent untransformed cells was investigated by comparing the growth rate. No significant difference in growth rate of S. cerv-SK clone, compared with the controls, was observed. (Figure 3(b)). The above data indicates a correlation between the time of onset of expression of SK with an increase in the growth rate, suggesting that the expression of SK is not toxic to the host. Qualitative and quantitative analyses of rSK in cell lysis supernatant were performed by caseinolytic assay and plasminogen activation assay (S-2251 substrate) at different time intervals of growth. The results indicate that expression of rSK is observed from day 1 and is maintained till the end of the experiment.
3.4. Carbon and Nitrogen Sources Screening by Plackett-Burman Design
Plackett-Burman statistical design was used to test various carbon (dextrose, sucrose, fructose, maltose, galactose, lactose and glycerol) and nitrogen sources' (yeast extract, tryptone, peptone, casamino acids, beef extract corn steep liquor, and polypeptone) effect on SK production.
Pareto charts (Figures 6 and 7) were used to show the effect of various carbon and nitrogen sources on SK production. It is evident from Figure 6 that dextrose has a significant effect on SK production. The SK production in a normal flask was 1050 IU/mL and 1300 IU/mL in a baffled flask resulting in that dextrose is the most significant carbon source for SK production in a baffled flask. On the other hand glycerol had, least effect on SK production with yields 310 and 440 IU/mL in normal and baffled flasks, respectively. Further, the influence of different nitrogen sources on SK production has been shown in Figure 7. Yeast extract was most influential with 1410 and 1100 IU/mL of SK production in baffled and normal flasks, respectively. From Figures 6 and 7, it is clearly evident that the shape of the flask has a significant effect on the amount of SK produced in confirmative lines with the work done by Villatte et al. [29]. Results indicate that PB design is a powerful technique to identify carbon and nitrogen sources for better SK production. Further, CCD and RSM were used to identify the exact optimal values of the individual parameter.
Figure 6.
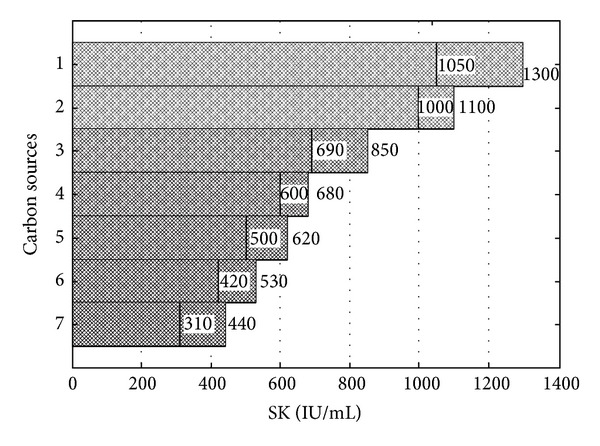
Pareto chart for the estimation of influence of different carbon sources on SK production (IU/mL) by P. pastoris: (1) dextrose, (2) galactose, (3) maltose, (4) sucrose, (5) lactose, (6) fructose, and (7) glycerol.
Figure 7.
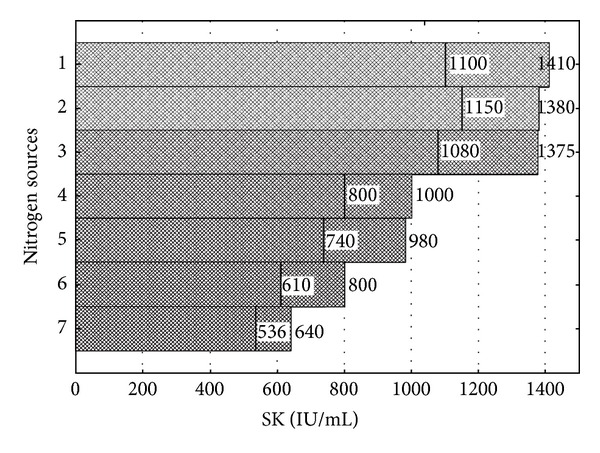
Pareto chart for the estimation of the influence of different nitrogen sources on SK production (IU/mL) by P. pastoris: (1) peptone, (2) yeast extract, (3) polypeptone, (4) beef extract, (5) tryptone, (6) casamino acids, and (7) corn steep liquor.
3.5. Optimization of SK Production Medium Conditions by Design of Experiments and RSM
Experiments 16, 15, 14 and 2 (supplementary Table S4) resulted in a maximum production of SK with 2350, 2150, 2100, and 2100 IU/mL, respectively, among all combinations. Four critical independent variables, yeast extract, dextrose, pH, and temperature, were chosen to optimize the production of SK by S. cerevisiae. Experiments were performed according to the CCD experimental design given in supplementary Table S5 in order to search for the optimum combination of components of the medium.
From supplementary Table S5 (model summary), coefficient of determination (R 2), 0.816, indicates fitness of model which means that the statistical model can explain 81.6% of variability in the response for SK production. The R 2 value should always be between 0 and 1 and the closer the R 2 value to 1, the stronger the model to predict the response. The adjusted R 2 value is another one (supplementary Table S5) which corrects the R 2 value for the sample size and for the number of terms in the model. Here, the adjusted R 2 value is 0.645, indicating better fitness of the model used for optimization by RSM [38, 39]. The value of adjusted R 2 is smaller than R 2 if the model has many terms and the sample size is small. The values of adjusted R 2, 0.645; R 2, 0.816; and the coefficient of variation, CV = 11.13%, indicate that the model can predict precise values from the experiments carried out for SK production.
Multiple regression analysis was carried out on CCD experimental data and a second-order full polynomial equation was fitted. Equation (5) gives the empirical relationship between SK production (Y) and four test variables in coded units:
| (5) |
where Y is SK production in IU/mL, Y is the response of (5), and x 1, x 2, x 3, and x 4 are the coded values of the test variables: yeast extract, 2.6% (x 1); dextrose, 2.7% (x 2); pH, 7.1 (x 3); temperature, 30°C (x 4).
Results of analysis of variance (ANOVA) carried out on a second-order response surface model are given in supplementary Tables S5 and S6. Student's t-test and p values were used to estimate each coefficient (supplementary Tables S5 and S6. Student's t test and p values were used to estimate each coTables S5 and S6). Larger t-value and smaller p value are more significant to determine coefficients which means that linear effects of yeast extract (p < 0.006) and dextrose (p < 0.007) and interactive effect of pH and temperature (p < 0.0001) are significant in SK production.
Contour plots are the graphical representation of the model generated and were drawn to illustrate effects of independent variables and combined effects of each independent variable upon response variable. Contour plots, Figures 8(a)–8(f), help in predicting the SK production for different levels of production medium conditions. Infinite combinations of two test variables, while others held at 0 level, are indicated in contour plots.
Figure 8.

((a)–(f)) 3D surface and contour plots of SK production by Pichia pastoris (IU/mL): the effect of two variables while the other two are held at 0 level.
Figures 8(a)–8(c) show the trend of SK production in IU/mL with the variation in yeast extract with respect to dextrose, pH, and temperature, and the maximum predicted SK production of 2000, 2400, and 2000 IU/mL, respectively, was observed. Figures 8(d) and 8(e) show the trend of SK production in IU/mL with the variation in dextrose with respect to pH and temperature, while a maximum SK production was predicted as of 2300 and 1900, respectively. Similarly, Figure 8(f) shows that a maximum of 2300 IU/mL SK production was predicted with the variation in pH and temperature.
Regression equation was solved by a numerical method [39, 40] and the optimal values of the four test variables in coded units are x 1 = −0.72, x 2 = 0.491, x 3 = 7.2, and x 4 = −0.681. The predicted value of Y (SK production, IU/mL) at these values of x's was 2461.13 IU/mL. The real values of the four test variables were obtained by substituting the respective coded values in (2) and found to be yeast extract (x 1), 3.215%; dextrose (x 2), 2.952%; pH, 7.42 (x 3), and temperature, 32.45 (x 4). Further, optimized SK production medium conditions were validated in 250 mL EM flask containing 100 mL of production medium. Experiments were conducted in triplicates to check the reproducibility of SK production using optimized conditions. The SK production of 2352.07 IU/mL (average of three experiments) was obtained at optimal conditions. This shows an increase of almost 110% than before optimizing experimental conditions. The experimental value of the SK production was almost equal if we consider 95% of the confidence limits for the prediction of Y value at optimized conditions with the shake-flask results.
3.6. Streptokinase Expressed in S. cerevisiae Is Functionally Active
Various qualitative and quantitative assays have been developed for the detection of SK activity; casein plate assay [32], fibrin plate assay [33], chromogenic assay [19], in vitro clot lysis assay [31], and a combination of these assays [34] were being proposed to accurately determine the SK activity. Lyticase produced by Arthrobacter luteus consists of β-1, 3-glucanase that attacks the β-1, 3-glucans in a random endolytic approach releasing oligosaccharides in a pH-dependent mode [17].
Lyticase-assisted yeast estrogen screening assay was performed to evaluate the environmental toxicity of certain chemicals [18]. There are many methods available for measuring the activity of plasminogen activators: changes in clot physical structure or retainment of trapped bubbles, fibrin opacity measurement by lysis zones on plates, and changes in OD in microtiter plate formats. The common endpoint in these methods is the time to half lysis. Alternative methods use radiochemical detection or utilize modified fibrinogens with chromogenic detection. Methods using chromogenic substrates have been developed where fibrin is removed before OD measurement or involving fibrin (ogen) chemically immobilized to microtiter plates or in the presence of opaque fibrin [34].
The mechanism of quantification of SK is the conversion of inactive plasminogen to active plasmin form. Plasmin acts on the chromogenic plasmin substrate D-Val-Leu-Lys-p-nitroanilide and liberates p-nitroaniline upon cleavage [19]. Cell lysis supernatant containing SK obtained by lyticase treatment was analyzed for plasminogen activation capability by S-2251 chromogenic assay. Spectrophotometric calibration of cell density at OD600 was determined by direct counting in a hemocytometer or by serial titration on YPD Zeocin agar plates for viable colonies.
The biologically active nature of rSK expressed in S. cerevisiae was further analyzed by a fibrin agarose indicator clearing assay after resolving the crude protein by SDS-PAGE (Figure 5). SK resolved in PAGE activates the plasminogen, in non-enzymatic mode, in the agar gel to plasmin. Plasmin dissolves the fibrin clot formed in the agar gel evident by clear bands indicating the fibrinolytic activity. 47 kDa form of constitutively expressing SK is functional. In vitro clot lysis assay [34] was also used to confirm the biologically active nature of the rSK.
Figure 5.
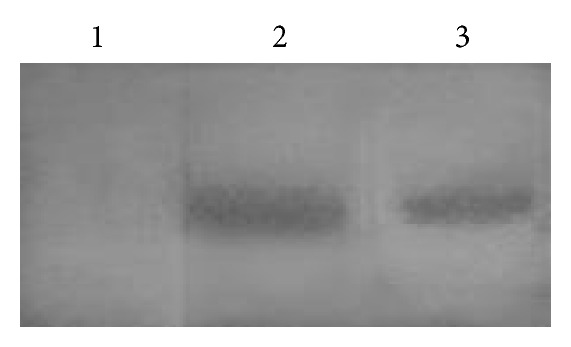
Fibrin agarose indicator gel. Untransformed S. cerevisiae cell lysate (Lane 1), commercial SK (lane 2), and rSK expressed in S. cerevisiae SK clone (Lane 3).
3.7. Stability of SK
Stability studies using cell lysate of S. cerevisiae expressing rSK at −20°C, 4°C, 25°C, 37°C, and 42°C indicated the presence of plasminogen activation efficiency at −20°C, 0°C, and 4°C (Table 1). Similar results were obtained from rSK expressed in P. pastoris and with SK purified from E. coli that was used as control.
Table 1.
Stability of intracellularly expressed SK in S. cerevisiae cell lysates.
| Storage temperaturea | % Functional activityb in Cell lysis supernatant |
|---|---|
| −20°C | 100 |
| 0°C | 94 |
| 4°C | 86 |
| 25°C | 9 |
| 37°C | — |
| 42°C | — |
aCell lysis supernatant of Saccharomyces clone expressing SK was stored at above temperatures for duration of 96 hrs.
bFunctional activity was assayed by in vitro clot lysis method and is a mean of three assays.
The level of SK activity achieved by constitutive intracellular expression in P. pastoris is 2352 IU/mL compared to that of Schizosaccharomyces pombe (2450 IU/mL) [9] and P. pastoris (3200 IU/mL and 2089 IU/mL) [7, 14]. The optimization of nutrients at shake flask level is to be extrapolated to bioreactor level to obtain large-scale production of rSK. Continuous constitutive bioreactor culture is being investigated to achieve rSK expression at industrial scale.
4. Conclusion
In conclusion, we have accomplished constitutively expressing rSK intracellularly in S. cerevisiae using P. pastoris expression backbone. The expressed SK protein (2352 IU/mL) on fibrin-plate zymography and chromogenic assay exhibited plasminogen activation property. Continuous cultivation bioreactor and purification strategies are being devised to obtain a protein of homogeneity.
Supplementary Material
Tables S1 to S6 are statistical information used and generated while optimizing process conditions for better SK production by Saccharomyces cerevisiae. Table S1 and S2 are the design matrix for screening carbon and organic nitrogen sources by using Placket-Burmun design. Experiments were conducted according to the design matrix and results are used in subsequent optimization studies. Table S3 is the range and levels of four variables considered for optimization. Table S4 is the design matrix generated according to central composite design for response surface methodology. Table S5 and S6 are ANOVA of quadratic equation and responses multiple linear regression analysis respectively.
Conflict of Interests
All the authors of this paper disclose that there is no conflict of interest between companies/organizations and for the material used and discussed in the present work.
Acknowledgments
This study was supported by a funding under the Technology Education Quality Improvement Program (TEQIP) by the World Bank to the Centre for Biotechnology, Jawaharlal Nehru Technological University (JNTU), Hyderabad, India. Ravi N. Vellanki acknowledges the Council of Scientific and Industrial Research (CSIR), Government of India for the Senior Research Fellowship (SRF).
Abbreviations
- SK:
Streptokinase
- GAP:
Glyceraldehyde 3-phosphate dehydrogenase
- AOX:
Alcohol oxidase
- HRP:
Horse radish peroxidase
- HIS4:
Histidinol dehydrogenase
- RSM:
Response surface methodology.
References
- 1.Banerjee A, Chisti Y, Banerjee UC. Streptokinase—a clinically useful thrombolytic agent. Biotechnology Advances. 2004;22(4):287–307. doi: 10.1016/j.biotechadv.2003.09.004. [DOI] [PubMed] [Google Scholar]
- 2.Sun H, Xu Y, Sitkiewicz I, et al. Inhibitor of streptokinase gene expression improves survival after group A streptococcus infection in mice. Proceedings of the National Academy of Sciences of the United States of America. 2012;109(9):3469–3474. doi: 10.1073/pnas.1201031109. [DOI] [PMC free article] [PubMed] [Google Scholar]
- 3.Xavier D, Pais P, Devereaux P, et al. Treatment and outcomes of acute coronary syndromes in India (CREATE): a prospective analysis of registry data. The Lancet. 2008;371(9622):1435–1442. doi: 10.1016/S0140-6736(08)60623-6. [DOI] [PubMed] [Google Scholar]
- 4.Balaraman K, Prabakaran G. Production and purification of a fibrinolytic enzyme (thrombinase) from Bacillus sphaericus . Indian Journal of Medical Research. 2007;126(5):459–464. [PubMed] [Google Scholar]
- 5.Chitte RR, Deshmukh SV, Kanekar PP. Production, purification, and biochemical characterization of a fibrinolytic enzyme from thermophilic Streptomyces sp. MCMB-379. Applied Biochemistry and Biotechnology. 2011;165(5-6):1406–1413. doi: 10.1007/s12010-011-9356-2. [DOI] [PubMed] [Google Scholar]
- 6.Ueda M, Kubo T, Miyatake K, Nakamura T. Purification and characterization of fibrinolytic alkaline protease from Fusarium sp. BLB. Applied Microbiology and Biotechnology. 2007;74(2):331–338. doi: 10.1007/s00253-006-0621-1. [DOI] [PubMed] [Google Scholar]
- 7.Vellanki RN, Potumarthi R, Mangamoori LN. Constitutive expression and optimization of nutrients for streptokinase production by Pichia pastoris using statistical methods. Applied Biochemistry and Biotechnology. 2009;158(1):25–40. doi: 10.1007/s12010-008-8315-z. [DOI] [PubMed] [Google Scholar]
- 8.Pimienta E, Ayala JC, Rodríguez C, et al. Recombinant production of Streptococcus equisimilis streptokinase by Streptomyces lividans . Microbial Cell Factories. 2007;6(article 20) doi: 10.1186/1475-2859-6-20. [DOI] [PMC free article] [PubMed] [Google Scholar]
- 9.HartnerF.S. FS, Ruth C, Langenegger D, et al. Promoter library designed for fine-tuned gene expression in Pichia pastoris . Nucleic Acids Research. 2008;36(12, article e76) doi: 10.1093/nar/gkn369. [DOI] [PMC free article] [PubMed] [Google Scholar]
- 10.Cos O, Ramón R, Montesinos JL, Valero F. Operational strategies, monitoring and control of heterologous protein production in the methylotrophic yeast Pichia pastoris under different promoters: a review. Microbial Cell Factories. 2006;5(article 17) doi: 10.1186/1475-2859-5-17. [DOI] [PMC free article] [PubMed] [Google Scholar]
- 11.Zhang AL, Luo JX, Zhang TY, et al. Recent advances on the GAP promoter derived expression system of Pichia pastoris . Molecular Biology Reports. 2009;36(6):1611–1619. doi: 10.1007/s11033-008-9359-4. [DOI] [PubMed] [Google Scholar]
- 12.Vellanki RN, Komaravelli N, Tatineni R, Mangamoori LN. Expression of hepatitis B surface antigen in Saccharomyces cerevisiae utilizing glyceraldeyhyde-3-phosphate dehydrogenase promoter of Pichia pastoris . Biotechnology Letters. 2007;29(2):313–318. doi: 10.1007/s10529-006-9242-0. [DOI] [PubMed] [Google Scholar]
- 13.Hagenson MJ, Holden KA, Parker KA, et al. Expression of streptokinase in Pichia pastoris yeast. Enzyme and Microbial Technology. 1989;11(10):650–656. [Google Scholar]
- 14.Pratap J, Rajamohan G, Dikshit KL. Characteristics of glycosylated streptokinase secreted from Pichia pastoris: enhanced resistance of SK to proteolysis by glycosylation. Applied Microbiology and Biotechnology. 2000;53(4):469–475. doi: 10.1007/s002530051643. [DOI] [PubMed] [Google Scholar]
- 15.Kumar R, Singh J. Expression and secretion of a prokaryotic protein streptokinase without glycosylation and degradation in Schizosaccharomyces pombe . Yeast. 2004;21(16):1343–1358. doi: 10.1002/yea.1184. [DOI] [PubMed] [Google Scholar]
- 16.Ovalle R, Spencer M, Thiwanont M, Lipke PN. The spheroplast lysis assay for yeast in microtiter plate format. Applied and Environmental Microbiology. 1999;65(8):3325–3327. doi: 10.1128/aem.65.8.3325-3327.1999. [DOI] [PMC free article] [PubMed] [Google Scholar]
- 17.Scott JH, Schekman R. Lyticase: endoglucanase and protease activities that act together in yeast cell lysis. Journal of Bacteriology. 1980;142(2):414–423. doi: 10.1128/jb.142.2.414-423.1980. [DOI] [PMC free article] [PubMed] [Google Scholar]
- 18.Schultis T, Metzger JW. Determination of estrogenic activity by LYES-assay (yeast estrogen screen-assay assisted by enzymatic digestion with lyticase) Chemosphere. 2004;57(11):1649–1655. doi: 10.1016/j.chemosphere.2004.06.027. [DOI] [PubMed] [Google Scholar]
- 19.Kulisek ES, Holm SE, Johnston KH. A chromogenic assay for the detection of plasmin generated by plasminogen activator immobilized on nitrocellulose using a para-nitroanilide synthetic peptide substrate. Analytical Biochemistry. 1989;177(1):78–84. doi: 10.1016/0003-2697(89)90017-1. [DOI] [PubMed] [Google Scholar]
- 20.Plackett RL, Burman JP. The design of optimum multifactorial experiments. Biometrika. 1946;33(4):305–325. [Google Scholar]
- 21.Akhnazarova S, Vafarov V. Experiment Optimization in Chemistry and Chemical Engineering. Moscow, Russia: Mir Publications; 1982. [Google Scholar]
- 22.Myers RH, Montgomery DC. Process and Product Optimization Using Designed Experiments. New York, NY, USA: Wiley-Interscience; 1995. Response surface methodology. [Google Scholar]
- 23.Khuri AI, Cornell JA. Response Surfaces: Design and Analysis. New York, NY, USA: Marcel Dekker; 1987. [Google Scholar]
- 24.Sharma S, Malik A, Satya S. Application of response surface methodology (RSM) for optimization of nutrient supplementation for Cr (VI) removal by Aspergillus lentulus AML05. Journal of Hazardous Materials. 2009;164(2-3):1198–1204. doi: 10.1016/j.jhazmat.2008.09.030. [DOI] [PubMed] [Google Scholar]
- 25.Gasparetti C, Buzzini P, Cramarossa MR, Turchetti B, Pagnoni UM, Forti L. Application of the response surface methodology (RSM) for optimizing the production of volatile organic compounds (VOCs) by Trichosporon moniliiforme . Enzyme and Microbial Technology. 2006;39(6):1341–1346. [Google Scholar]
- 26.Potumarthi R, Jacques L, Harry W, Danquah M. Surface immobilization of Rhizopus oryzae (ATCC, 96382) for enhanced production lipase enzyme by multiple responses optimization. Asia-Pacific Journal of Chemical Engineering. 2012;7(3, supplement):S285–S295. [Google Scholar]
- 27.Potumarthi R, Mugeraya G, Jetty A. Biological treatment of toxic petroleum spent caustic in fluidized bed bioreactor using immobilized cells of Thiobacillus RAI01. Applied Biochemistry and Biotechnology. 2008;151(2-3):532–546. doi: 10.1007/s12010-008-8229-9. [DOI] [PubMed] [Google Scholar]
- 28.Potumarthi R, Subhakar C, Pavani A, Jetty A. Evaluation of various parameters of calcium-alginate immobilization method for enhanced alkaline protease production by Bacillus licheniformis NCIM-2042 using statistical methods. Bioresource Technology. 2008;99(6):1776–1786. doi: 10.1016/j.biortech.2007.03.041. [DOI] [PubMed] [Google Scholar]
- 29.Villatte F, Hussein AS, Bachmann TT, Schmid RD. Expression level of heterologous proteins in Pichia pastoris is influenced by flask design. Applied Microbiology and Biotechnology. 2001;55(4):463–465. doi: 10.1007/s002530000479. [DOI] [PubMed] [Google Scholar]
- 30.Hoffman CS, Winston F. A ten-minute DNA preparation from yeast efficiently releases automomous plasmids for transformation of Escherichia coli . Gene. 1987;57(2-3):267–272. doi: 10.1016/0378-1119(87)90131-4. [DOI] [PubMed] [Google Scholar]
- 31.Couto LT, Donato JL, de Nucci G. Analysis of five streptokinase formulations using the euglobulin lysis test and the plasminogen activation assay. Brazilian Journal of Medical and Biological Research. 2004;37(12):1889–1894. doi: 10.1590/s0100-879x2004001200015. [DOI] [PubMed] [Google Scholar]
- 32.Granelli-Piperno A, Reich E. A study of proteases and protease-inhibitor complexes in biological fluids. Journal of Experimental Medicine. 1978;148(1):223–234. doi: 10.1084/jem.148.1.223. [DOI] [PMC free article] [PubMed] [Google Scholar]
- 33.Malke H, Ferretti JJ. Streptokinase: cloning, expression, and excretion by Escherichia coli . Proceedings of the National Academy of Sciences of the United States of America. 1984;81(11):3557–3561. doi: 10.1073/pnas.81.11.3557. [DOI] [PMC free article] [PubMed] [Google Scholar]
- 34.Longstaff C, Whitton CM. A proposed reference method for plasminogen activators that enables calculation of enzyme activities in SI units. Journal of Thrombosis and Haemostasis. 2004;2(8):1416–1421. doi: 10.1111/j.1538-7836.2004.00816.x. [DOI] [PubMed] [Google Scholar]
- 35.US Pharmacopeial Convention, Inc. United States Pharmacopeia 27/National Formulary 22. Rockville, Md, USA: US Pharmacopeial Convention, Inc.; 2004. [Google Scholar]
- 36.Wang TT, Choi JY, Lee BH. Transformation systems of non-Saccharomyces yeasts. Critical Reviews in Biotechnology. 2001;21(3):177–218. doi: 10.1080/20013891081719. [DOI] [PubMed] [Google Scholar]
- 37.Nacken V, Achstetter T, Degryse E. Probing the limits of expression levels by varying promoter strength and plasmid copy number in Saccharomyces cerevisiae . Gene. 1996;175(1-2):253–260. doi: 10.1016/0378-1119(96)00171-0. [DOI] [PubMed] [Google Scholar]
- 38.Box GEP, Hunter WG, Hunter JS. Statistics for Experimenters. New York, NY, USA: John Wiley & Sons; 1978. [Google Scholar]
- 39.Cochran WG, Cox GM, editors. Experimental Design. New York, NY, USA: John Wiley & Sons; 1957. [Google Scholar]
- 40.Montgomery D. Design and Analysis of Experiments. New York, NY, USA: John Wiley & Sons; 2001. [Google Scholar]
Associated Data
This section collects any data citations, data availability statements, or supplementary materials included in this article.
Supplementary Materials
Tables S1 to S6 are statistical information used and generated while optimizing process conditions for better SK production by Saccharomyces cerevisiae. Table S1 and S2 are the design matrix for screening carbon and organic nitrogen sources by using Placket-Burmun design. Experiments were conducted according to the design matrix and results are used in subsequent optimization studies. Table S3 is the range and levels of four variables considered for optimization. Table S4 is the design matrix generated according to central composite design for response surface methodology. Table S5 and S6 are ANOVA of quadratic equation and responses multiple linear regression analysis respectively.


