

Abstract
Purpose
To evaluate the effect of prostaglandin analogs (PGAs) on the biomechanical properties (corneal hysteresis [CH], corneal resistance factor [CRF]) and central corneal thickness (CCT) of patients with open-angle glaucoma.
Methods
A total of 108 eyes were prospectively included for repeated measurements of intraocular pressure (IOP) with Goldmann applanation tonometry (GAT) and ocular response analyzer (ORA), CCT, followed by CH and CRF measurements by the ORA, during the same visit. Of these, 66 were treated with latanoprost, and 42 were treated with latanoprost and timolol. IOP, CH, CRF, and CCT were measured before treatment and at 6-month intervals.
Results
It appears that under local PGA treatment, IOP values decreased and CH and CCT significantly increased, whereas CRF did not. CCT slightly but significantly increased at all time points of the study (0.50–3.00 μm and 1.50–5.50 μm), and we observed a constant significant increase in CH (0.4–0.7 mmHg and 0.65–0.95 mmHg). Concerning the correlation of GAT IOP with CCT and CH, it was found that at the time points 0, 1, and 2 there were statistically significant correlations.
Conclusion
The changes of CCT and CH under PGA treatment in clinical practice may influence IOP measurements and patient follow-up significantly. This should be investigated further to confirm the relationship between corneal properties and treatment of open-angle glaucoma.
Keywords: corneal hysteresis, corneal resistance factor, central corneal thickness, glaucoma, prostaglandins, ocular response analyzer, intraocular pressure
Introduction
Open-angle glaucoma (OAG) is the second-leading cause of permanent blindness worldwide, affecting more than 60.5 million people aged over 40 years, increasing to 79.6 million by 2020.1 Topical antiglaucoma therapy to lower intraocular pressure (IOP) with prostaglandin analogs (PGAs) is the treatment of choice for millions of patients. For the past few years, the clinical gold standard for measuring IOP was Goldmann applanation tonometry (GAT). Recent studies have shown that the biomechanical properties of the cornea, such as corneal hysteresis (CH) and corneal resistance factor (CRF), may influence the measurement and hence the proper adjustment of IOP.2,3 These important parameters are measured with an ocular response analyzer (ORA). ORAs use two air pulses: from the initial air pulse, the cornea absorbs some energy, which causes the second applanation-pressure measurement to be lower. The difference between the two pressures is CH. CRF reflects the overall resistance of the cornea to deformation, and may correlate with central corneal thickness (CCT).
It has been shown that CCT significantly affects IOP measurement, and may itself be a risk factor for developing glaucoma.4–8 Studies dealing with long-term local treatment with such PGAs as latanoprost suggest association with adverse effects, some of which affect the corneal stromal structure and CCT.9,10
Since many questions arise regarding the relationship of IOP reduction to CH, CRF, and CCT, the purpose of this study was to investigate if long-term local treatment with PGAs could significantly affect the biomechanics and central thickness of the cornea.
Materials and methods
This prospective study was performed in the Department of Ophthalmology of Athens University, at G Gennimatas Hospital. The study was approved by the institutional review board of the hospital, and all study procedures adhered to the tenets of the Declaration of Helsinki. After a detailed explanation of the procedure benefits and risks, informed consent was obtained from all patients. None of the patients refused to enroll, and none were lost to follow-up during the course of the study.
A total of 108 eyes were included in this study. Of these, 66 were treated with latanoprost, and 42 were treated with latanoprost and timolol. Exclusion criteria included patients with any corneal pathology, preexisting ocular hypotensive medication, previous surgical intervention, those with any type of glaucoma other than OAG, and patients unable or unwilling to be followed up for an extended period.
All patients underwent ophthalmic examination, and vision was tested before treatment and at 6-month intervals. IOP was measured using GAT and ORA (IOPg, IOPcc). CH and CRF were also measured with ORA (Reichert Technologies, Depew, NY, USA) until five measurements were obtained per eye. The average score was retained. Pachymetry was then performed using a US-1800 ultrasonic pachymeter (Nidek, Gamagori, Japan) after applying a topical anesthetic. All measurements were made between 4pm and 8pm by the same observer. This series of exams was strictly observed to keep the epithelium of the cornea intact. As per protocol, two GAT and ten separate consecutive CCT measurements were obtained. The patients’ ages ranged from 45 to 80 years.
Statistical analysis
All variables were tested for normality using graphical (histograms) and mathematical methods (Kolmogorov–Smirnov and Shapiro–Wilk statistics). GAT was used for the IOP measurement for all statistics presented, unless otherwise specified. Every time point of the therapy is marked with a number ranging from 0 to 6, with 0 signifying evaluation of the patient and start of the treatment. For every time point, the mean standard deviation median and interquartile range are examined in order to provide a thorough insight of each patient sample. We examined the significance of the changes in the aforementioned patient samples for every time point of the study in relevance to point zero. Statistical analyses were conducted by applying suitably, depending on the occasion, parametric (t-tests) or equivalent nonparametric methods (Mann–Whitney–Wilcoxon sign test), through which the significance of changes was tested. Finally, we used multivariate regression analysis in order to quantify the correlations of GAT IOP with CCT and CH.
Results
A total of 108 were enrolled in this study. Of these, randomly, 66 were treated with latanoprost and 42 were treated with latanoprost and timolol. All patients completed the 3-year study. Follow-up examination was every 6 months. There were no significant differences between the groups in terms of age or sex.
The characteristics of the study by sex and treatment are shown in Table 1. The mean IOP at baseline was 17.59 ± 3.91 for latanoprost and 19.38 ± 3.61 for the latanoprost and timolol study group. The values over the duration of the study decreased, as shown in Table 2.
Table 1.
Characteristics of the study by treatment groups at the start of the study
| Latanoprost | Latanoprost and timolol | ||||
|---|---|---|---|---|---|
| Therapy | |||||
| Number of eyes | 66 (47.1%) | 42 (30%) | |||
| Mean | SD | Mean | SD | P-value | |
|
| |||||
| Variable | |||||
| Age | 61.82 | 10 | 62.57 | 8.88 | 0.487 |
| Goldmann | 17.59 | 3.91 | 19.38 | 3.61 | 0.019 |
| CCT | 558.5 | 32.65 | 564.67 | 28.27 | 0.316 |
| CRF | 10.11 | 1.34 | 10.56 | 1.36 | 0.082 |
| CH | 9.22 | 0.76 | 9.17 | 0.81 | 0.733 |
Abbreviations: SD, standard deviation; CCT, central corneal thickness; CRF, corneal resistance factor; CH, corneal hysteresis.
Table 2.
Intraocular pressure values during the study
| Time | Mean | Mean difference | SD | Median | Median difference | IQR | P-value |
|---|---|---|---|---|---|---|---|
| Latanoprost | |||||||
| 0 | 17.59 | – | 3.910 | 17.00 | – | 7 | – |
| 1 | 14.47 | −3.120 | 1.703 | 15.00 | −2.00 | 2 | <0.001 |
| 2 | 14.29 | −3.300 | 1.895 | 14.00 | −3.00 | 2 | <0.001 |
| 3 | 13.86 | −3.730 | 1.188 | 14.00 | −3.00 | 2 | <0.001 |
| 4 | 13.83 | −3.760 | 1.158 | 14.00 | −3.00 | 2 | <0.001 |
| 5 | 13.81 | −3.780 | 1.162 | 14.00 | −3.00 | 2 | <0.001 |
| 6 | 13.74 | −3.850 | 1.396 | 14.00 | −3.00 | 2 | <0.001 |
| Latanoprost and timolol | |||||||
| 0 | 19.38 | – | 3.609 | 20.50 | – | 6.00 | – |
| 1 | 14.67 | −4.71 | 1.262 | 14.00 | −6.50 | 2.00 | <0.001 |
| 2 | 14.29 | −5.09 | 1.066 | 14.00 | −6.50 | 1.00 | <0.001 |
| 3 | 14.26 | −5.12 | 0.885 | 14.00 | −6.50 | 1.00 | <0.001 |
| 4 | 14.14 | −5.24 | 0.843 | 14.00 | −6.50 | 1.00 | <0.001 |
| 5 | 14.13 | −5.25 | 0.820 | 14.00 | −6.50 | 1.00 | <0.001 |
| 6 | 14.10 | −5.28 | 1.078 | 14.00 | −6.50 | 2.00 | <0.001 |
Abbreviations: SD, standard deviation; IQR, interquartile range.
For every time point, the corresponding P-values indicate that there were statistically significant differences. In addition, according to the table we can conclude that the main decrease in IOP after PGA treatment can be seen in the first two semesters, whereas from the third on it stabilizes. This can also be seen in Figures 1 and 2.
Figure 1.

Intraocular pressure (IOP) values during the study for the latanoprost group.
Abbreviation: GAT, goldmann applanation tonometry.
Figure 2.
Intraocular pressure (IOP) values during the study for the latanoprost and timolol group.
Abbreviation: GAT, goldmann applanation tonometry.
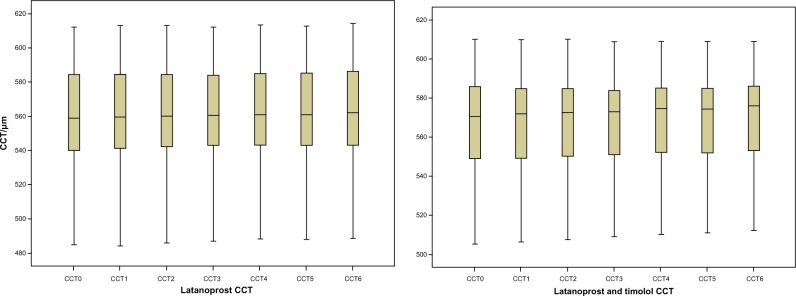
We then followed CCT evolution during the study, sorted by treatment to identify changes after PGA treatment. For the latanoprost study group, CCT was slightly but significantly increased at all time points of the study. An increase was also found in the latanoprost and timolol group. However, it was significant only from the second semester onwards, while the P-value for the change observed in the first semester (0.122) is well above the 5% significance level (Table 3 and Figure 3).
Table 3.
Central corneal thickness evolution during the study, sorted by treatment
| Time | Mean | Mean difference | SD | Median | Median difference | IQR | P-value |
|---|---|---|---|---|---|---|---|
| Latanoprost | |||||||
| 0 | 558.50 | – | 32.652 | 559.00 | – | 44.75 | – |
| 1 | 558.89 | 0.390 | 32.437 | 559.50 | 0.50 | 43.75 | <0.001 |
| 2 | 559.48 | 0.980 | 32.294 | 560.00 | 1.00 | 42.75 | <0.001 |
| 3 | 560.20 | 1.700 | 32.099 | 560.50 | 1.50 | 42.25 | <0.001 |
| 4 | 560.58 | 2.080 | 32.138 | 561.00 | 2.00 | 43.25 | <0.001 |
| 5 | 560.70 | 2.200 | 32.124 | 561.00 | 2.00 | 43.25 | <0.001 |
| 6 | 561.27 | 2.770 | 32.108 | 562.00 | 3.00 | 44.25 | <0.001 |
| Latanoprost and timolol | |||||||
| 0 | 564.67 | – | 28.268 | 570.50 | – | 38.50 | – |
| 1 | 564.88 | 0.21 | 28.017 | 572.00 | 1.50 | 37.00 | 0.122 |
| 2 | 565.67 | 1.00 | 27.764 | 572.50 | 2.00 | 36.75 | <0.001 |
| 3 | 566.31 | 1.64 | 27.338 | 573.00 | 2.50 | 35.00 | <0.001 |
| 4 | 567.07 | 2.40 | 27.318 | 574.50 | 4.00 | 35.25 | <0.001 |
| 5 | 567.29 | 2.62 | 27.147 | 574.50 | 4.00 | 35.00 | <0.001 |
| 6 | 568.07 | 3.40 | 27.165 | 576.00 | 5.50 | 35.25 | <0.001 |
Abbreviations: SD, standard deviation; IQR, interquartile range.
Figure 3.

Central corneal thickness (CCT) evolution during the study, sorted by treatment.
Over the duration of the study, mean CH increased significantly (0.4–0.7 and 0.65–0.95 mmHg), presenting null P-values for every time point in both treatment groups, as we can see in Table 4 and Figure 4. As we can observe, there was an increasing trend at the beginning, especially for the lower levels of CH, whereas it stabilized from the third semester onwards. This was more pronounced in the latanoprost study group.
Table 4.
Corneal hysteresis evolution during the study sorted by treatment
| Time | Mean | Mean difference | SD | Median | Median difference | IQR | P-value |
|---|---|---|---|---|---|---|---|
| Latanoprost | |||||||
| 0 | 9.2242 | – | 0.7586 | 9.3000 | – | 1.6000 | – |
| 1 | 9.5742 | 0.350 | 0.5749 | 9.7000 | 0.4000 | 0.8500 | <0.001 |
| 2 | 9.6955 | 0.471 | 0.5911 | 9.8000 | 0.5000 | 0.7250 | <0.001 |
| 3 | 9.8288 | 0.605 | 0.4771 | 9.9000 | 0.6000 | 0.5250 | <0.001 |
| 4 | 9.8591 | 0.635 | 0.4638 | 9.9000 | 0.6000 | 0.5000 | <0.001 |
| 5 | 9.8909 | 0.667 | 0.4597 | 10.0000 | 0.7000 | 0.4250 | <0.001 |
| 6 | 9.9773 | 0.753 | 0.4650 | 10.0000 | 0.7000 | 0.4250 | <0.001 |
| Latanoprost and timolol | |||||||
| 0 | 9.171 | – | 0.816 | 9.150 | – | 1.55 | – |
| 1 | 9.710 | 0.539 | 0.745 | 9.800 | 0.650 | 1.30 | <0.001 |
| 2 | 9.940 | 0.769 | 0.702 | 10.000 | 0.850 | 1.03 | <0.001 |
| 3 | 10.002 | 0.831 | 0.677 | 10.000 | 0.850 | 0.85 | <0.001 |
| 4 | 10.069 | 0.898 | 0.622 | 10.050 | 0.900 | 0.73 | <0.001 |
| 5 | 10.112 | 0.941 | 0.611 | 10.100 | 0.950 | 0.73 | <0.001 |
| 6 | 10.179 | 1.008 | 0.602 | 10.100 | 0.950 | 0.73 | <0.001 |
Abbreviations: SD, standard deviation; IQR, interquartile range.
Figure 4.

Corneal hysteresis (CH) evolution during the study, sorted by treatment.
Abbreviation: CCT, central corneal thickness.
In both study groups, CRF did not significantly change. The corresponding P-values were well above the significance level at all time points of the study, and CRF remained in the median value of 0.050–0.150 for the latanoprost group and 0–0.150 for the latanoprost and timolol group, as shown in Table 5.
Table 5.
Corneal resistance-factor evolution during the study sorted by treatment
| Time | Mean | SD | Median | IQR | P-value |
|---|---|---|---|---|---|
| Latanoprost | |||||
| 0 | 10.111 | 1.3455 | 10.450 | 1.350 | – |
| 1 | 10.118 | 1.2661 | 10.400 | 1.325 | 0.854 |
| 2 | 10.123 | 1.2261 | 10.400 | 1.350 | 0.868 |
| 3 | 10.100 | 1.1830 | 10.300 | 1.350 | 0.451 |
| 4 | 10.095 | 1.1666 | 10.300 | 1.325 | 0.398 |
| 5 | 10.094 | 1.2123 | 10.300 | 1.425 | 0.301 |
| 6 | 10.152 | 1.2706 | 10.300 | 1.350 | 0.69 |
| Latanoprost and timolol | |||||
| 0 | 10.562 | 1.3565 | 10.800 | 1.200 | – |
| 1 | 10.579 | 1.3110 | 10.800 | 1.000 | 0.399 |
| 2 | 10.562 | 1.2632 | 10.750 | 0.975 | 0.819 |
| 3 | 10.569 | 1.2573 | 10.750 | 0.925 | 0.77 |
| 4 | 10.550 | 1.2268 | 10.700 | 1.125 | 0.652 |
| 5 | 10.555 | 1.2343 | 10.600 | 1.125 | 0.653 |
| 6 | 10.540 | 1.2208 | 10.650 | 1.050 | 0.463 |
Abbreviations: SD, standard deviation; IQR, interquartile range.
As for the changes in the IOP values measured with GAT, we found statistically significant correlations with the values of CCT and CH. According to Table 6, we can see that for CCT in both groups there was a positive statistically significant correlation at the beginning of the treatment and for the first two semesters. For CH, there was a negative statistically significant correlation in the first semester in both study groups.
Table 6.
Correlations in changes in intraocular pressure with values of central corneal thickness (CCT) and corneal hysteresis (CH) for the two study groups
| Regression coefficient (CCT) | P-value | Confidence interval (95%) | ||
|---|---|---|---|---|
| Latanoprost | ||||
| 0 | 0.024 | 0.049 | 0.00011 | 0.047 |
| 1 | 0.016 | 0.024 | 0.002 | 0.029 |
| 2 | 0.011 | 0.034 | 0.01 | 0.02 |
| 3 | 0.009 | 0.079 | −0.001 | 0.018 |
| 4 | 0.003 | 0.545 | −0.007 | 0.012 |
| 5 | 0.002 | 0.604 | −0.007 | 0.001 |
| 6 | −0.002 | 0.756 | −0.013 | 0.009 |
| Regression coefficient (CH) | P-value | Confidence interval (95%) | ||
|
| ||||
| Latanoprost | ||||
| 0 | −3.401 | <0.001 | −4.464 | −2.337 |
| 1 | −0.630 | 0.2 | −1.603 | 0.343 |
| 2 | −0.119 | 0.774 | −0.942 | 0.705 |
| 3 | 0.076 | 0.884 | −0.969 | 1.122 |
| 4 | −0.230 | 0.678 | −1.335 | 0.875 |
| 5 | −0.349 | 0.535 | −1.470 | 0.772 |
| 6 | −0.919 | 0.150 | −2.180 | 0.343 |
| Regression coefficient (CCT) | P-value | Confidence interval (95%) | ||
|
| ||||
| Latanoprost and timolol | ||||
| 0 | 0.085 | <0.001 | 0.054 | 0.116 |
| 1 | 0.022 | 0.003 | 0.008 | 0.035 |
| 2 | 0.017 | 0.012 | 0.004 | 0.029 |
| 3 | 0.010 | 0.074 | −0.001 | −0.022 |
| 4 | 0.002 | 0.781 | −0.010 | 0.013 |
| 5 | 0.002 | 0.792 | −0.010 | 0.013 |
| 6 | −0.008 | 0.285 | −0.022 | 0.007 |
| Regression coefficient (CH) | P-value | Confidence interval (95%) | ||
|
| ||||
| Latanoprost and timolol | ||||
| 0 | −0.460 | 0.389 | −1.529 | 0.608 |
| 1 | −0.558 | 0.034 | −1.072 | −0.044 |
| 2 | −0.478 | 0.061 | −0.979 | 0.024 |
| 3 | −0.121 | 0.600 | −0.582 | 0.341 |
| 4 | 0.073 | 0.768 | −0.426 | 0.572 |
| 5 | 0.080 | 0.753 | 0.430 | 0.590 |
| 6 | 0.532 | 0.109 | −0.124 | 1.188 |
Discussion
According to the results in both study groups in the 3-year period, IOP statistically decreased, with main changes occurring in the first two semesters. PGAs act by increasing the uveoscleral outflow.11 One of the mechanisms considered responsible is the biochemical change between the corneal fibroblasts by increasing matrix metalloproteinases MMP-1 and MMP and reducing different collagen types (I, II, IV, VI).12–16
Given that topical application of latanoprost stimulates collagen gel contraction, CCT might be affected by changes in corneal shape.17 This study showed a statistically significant increase in CCT after 3 years of treatment with PGAs, with higher values in the latanoprost group. According to studies, CCT may identify patients at high risk for glaucoma progression, and should be measured often.7,18
The median increase of CCT in both groups reached a significant value of 0.50–3.00 μm for the latanoprost group and 1.50–5.50 μm for the latanoprost and timolol group. In clinical practice, this corneal thickening could result in overestimation of GAT-measured IOP levels, since CCT in both groups was positively statistically correlated with IOP at the beginning of the treatment and for the first two semesters. In our study, as well as in other studies like the Ocular Hypertension Treatment Study, we found that the magnitude of changes in GAT IOP was correlated with the changes in CCT. Since decreased CCT could predict the development of OAG, it should be measured regularly, and GAT IOP should be properly adjusted to correct for CCT measurements higher or lower than the mean.
Besides CCT, recent studies on CRF and especially CH suggest that these biomechanical properties of the cornea may also provide unique information in glaucoma progression, such as increased deformation of the optic nerve surface.8,19–21 CH is considered to be a direct measurement of cornea biomechanics, whereas CCT one of the factors affecting them. Although in past years it was believed that glaucoma prognosis was associated with CCT, it has been found in many studies that lower CH values are a risk factor in progression of glaucoma and visual field loss independent of CCT.6,21–23
In our prospective study, it was observed that the magnitude of IOP reduction with PGA treatment was significantly associated with CH, and there was a negative statistically significant correlation in the first semester in both study groups. The median CH increase obtained in the first semester of treatment was 0.4 mmHg for latanoprost and 0.65 mmHg for latanoprost and timolol. Considering that low CH and a weaker cornea may lead to underestimation of IOP, ORA could be used, and not just GAT, to obtain more accurate and reliable IOP values and have a better treatment outcome.24,25
It is believed that CRF is also a useful tool in predicting progression to glaucoma and may be correlated with CCT.22,26 In our study, in both groups CRF did not significantly change, and remained in the median range of 0.050–0.150 for the latanoprost group and 0–0.150 for the latanoprost and timolol group at all time points.
The results suggest that the effect of PGA treatment on CCT and CH and their potential impact on the measurement of IOP should be considered carefully in treatment decision-making, especially when they are administered over an extended period of time.
The aim of our study was to determine the effect of PGA treatment on CCT, CH, and CRF at various time points. Further research would be useful with larger numbers of patients, and longer follow-ups are required to confirm these findings and improve patient care.
Footnotes
Disclosure
The authors report no conflicts of interest in this work.
References
- 1.Quigley HA, Broman AT. The number of people with glaucoma worldwide in 2010 and 2020. Br J Ophthalmol. 2006;90:262–267. doi: 10.1136/bjo.2005.081224. [DOI] [PMC free article] [PubMed] [Google Scholar]
- 2.Ang GS, Bochmann F, Townend J, Azuara-Blanco A. Corneal biomechanical properties in primary open angle glaucoma and normal tension glaucoma. J Glaucoma. 2008;17:259–262. doi: 10.1097/IJG.0b013e31815c3a93. [DOI] [PubMed] [Google Scholar]
- 3.Mangouritsas G, Mourtzoukos S, Mantzounis A, Alexopoulos L. Comparison of Goldmann and Pascal tonometry in relation to corneal hysteresis and central corneal thickness in non-glaucomatous eyes. Clin Ophthalmol. 2011;5:1071–1077. doi: 10.2147/OPTH.S23086. [DOI] [PMC free article] [PubMed] [Google Scholar]
- 4.Kohlhaas M, Boehm AG, Spoerl E, Pürsten A, Grein HJ, Pillunat LE. Effect of central corneal thickness, corneal curvature, and axial length on applanation tonometry. Arch Ophthalmol. 2006;124:471–476. doi: 10.1001/archopht.124.4.471. [DOI] [PubMed] [Google Scholar]
- 5.Argus WA. Ocular hypertension and central corneal thickness. Ophthalmology. 1995;102:1810–1812. doi: 10.1016/s0161-6420(95)30790-7. [DOI] [PubMed] [Google Scholar]
- 6.Congdon NG, Broman AT, Bandeen-Roche K, Grover D, Quigley HA. Central corneal thickness and corneal hysteresis associated with glaucoma damage. Am J Ophthalmol. 2006;141:868–875. doi: 10.1016/j.ajo.2005.12.007. [DOI] [PubMed] [Google Scholar]
- 7.Herndon L, Weizer J, Stinnett S. Central corneal thickness as a risk factor for advanced glaucoma damage. Arch Ophthalmol. 2004;122:17–21. doi: 10.1001/archopht.122.1.17. [DOI] [PubMed] [Google Scholar]
- 8.Leske MC, Heijl A, Hyman L, Bengtsson B, Dong L, Yang Z. Predictors of long-term progression in the early manifest glaucoma trial. Ophthalmology. 2007;114:1965–1972. doi: 10.1016/j.ophtha.2007.03.016. [DOI] [PubMed] [Google Scholar]
- 9.Lass JH, Eriksson GL, Osterling L, Simpson CV. Comparison of the corneal effects of latanoprost, fixed combination latanoprost-timolol, and timolol: a double-masked, randomized, one-year study. Ophthalmology. 2001;108:264–271. doi: 10.1016/s0161-6420(00)00531-5. [DOI] [PubMed] [Google Scholar]
- 10.Wu KY, Wang HZ, Hong SJ. Effect of latanoprost on cultured porcine stromal cells. Curr Eye Res. 2005;30:871–879. doi: 10.1080/02713680591006237. [DOI] [PubMed] [Google Scholar]
- 11.Schachtschabel U, Lindsey JD, Weinreb RN. The mechanism of action of prostaglandins on uveoscleral outflow. Curr Opin Ophthalmol. 2000;11:112–115. doi: 10.1097/00055735-200004000-00008. [DOI] [PubMed] [Google Scholar]
- 12.Honda N, Miyai T, Nejima R, et al. Effect of latanoprost on the expression of matrix metalloproteinases and tissue inhibitor of metalloproteinase 1 on the ocular surface. Arch Ophthalmol. 2010;128:466–471. doi: 10.1001/archophthalmol.2010.40. [DOI] [PubMed] [Google Scholar]
- 13.Mietz H, Esser JM, Welsandt G, et al. Latanoprost stimulates secretion of matrix metalloproteinases in tenon fibroblasts both in vitro and in vivo. Invest Ophthalmol Vis Sci. 2003;44:5182–5188. doi: 10.1167/iovs.02-0462. [DOI] [PubMed] [Google Scholar]
- 14.Ocklind A. Effect of latanoprost on the extracellular matrix of the ciliary muscle. A study on cultured cells and tissue sections. 1998;67:179–191. doi: 10.1006/exer.1998.0508. [DOI] [PubMed] [Google Scholar]
- 15.Sagara T, Gaton D, Lindsey J, Gabelt B, Kaufman P, Weinberg R. Topical prostaglandin F2a treatment reduces collagen types I, III and IV in the monkey uveoscleral outflow pathway. Arch Ophthalmol. 1999;117:798–801. doi: 10.1001/archopht.117.6.794. [DOI] [PubMed] [Google Scholar]
- 16.Wang N, Lindsey JD, Angert M, Weinreb RN. Latanoprost and matrix metalloproteinase-1 in human choroid organ cultures. Curr Eye Res. 2001;22:198–207. doi: 10.1076/ceyr.22.3.198.5515. [DOI] [PubMed] [Google Scholar]
- 17.Liu Y, Yanai R, Lu Y, Hirano S, Sagara T, Nishida T. Effects of antiglaucoma drugs on collagen gel contraction mediated by human corneal fibroblasts. J Glaucoma. 2006;15:255–259. doi: 10.1097/01.ijg.0000212210.33265.24. [DOI] [PubMed] [Google Scholar]
- 18.Shih CY, Graff Zivin JS, Trokel SL, Tsai JC. Clinical significance of central corneal thickness in the management of glaucoma. Arch Ophthalmol. 2004;122:1270–1275. doi: 10.1001/archopht.122.9.1270. [DOI] [PubMed] [Google Scholar]
- 19.Avetisov SE, Bubnova IA, Antonov AA. [Investigation of the biomechanical properties of the cornea in patients with normotensive and primary open-angle glaucoma.] Vestn Oftalmol. 2008;124:14–16. Russian. [PubMed] [Google Scholar]
- 20.Schroeder B, Hager A, Kutschan A, Wiegand W. [Measurement of viscoelastic corneal parameters (corneal hysteresis) in patients with primary open angle glaucoma.] Ophthalmologe. 2008;105:916–920. doi: 10.1007/s00347-008-1690-6. German. [DOI] [PubMed] [Google Scholar]
- 21.Wells AP, Garway-Heath DF, Poostchi A, Wong T, Chan KC, Sachdev N. Corneal hysteresis but not corneal thickness correlates with optic nerve surface compliance in glaucoma patients. Invest Ophthalmol Vis Sci. 2008;49:3262–3268. doi: 10.1167/iovs.07-1556. [DOI] [PubMed] [Google Scholar]
- 22.Gordon MO, Beiser JA, Brandt JD, et al. The Ocular Hypertension Treatment Study: baseline factors that predict the onset of primary open-angle glaucoma. Arch Ophthalmol. 2002;120:714–720. doi: 10.1001/archopht.120.6.714. [DOI] [PubMed] [Google Scholar]
- 23.Bochmann F, Ang GS, Azuara-Blanco A. Lower corneal hysteresis in glaucoma patients with acquired pit of the optic nerve (APON) Graefes Arch Clin Exp Ophthalmol. 2008;246:735–738. doi: 10.1007/s00417-007-0756-5. [DOI] [PubMed] [Google Scholar]
- 24.Luce DA. Determining in vivo biomechanical properties of the cornea with an ocular response analyzer. J Cataract Refract Surg. 2005;31:156–162. doi: 10.1016/j.jcrs.2004.10.044. [DOI] [PubMed] [Google Scholar]
- 25.Touboul D, Roberts C, Kérautret J, et al. Correlations between corneal hysteresis, intraocular pressure, and corneal central pachymetry. J Cataract Refract Surg. 2008;34:616–622. doi: 10.1016/j.jcrs.2007.11.051. [DOI] [PubMed] [Google Scholar]
- 26.Brandt JD, Beiser JA, Gordon MO, Kass MA. Central corneal thickness and measured IOP response to topical ocular hypotensive medication in the Ocular Hypertension Treatment Study. Am J Ophthalmol. 2004;138:717–722. doi: 10.1016/j.ajo.2004.07.036. [DOI] [PubMed] [Google Scholar]