Abstract
Infections share with atherosclerosis similar lipid alterations, with accumulation of cholesteryl esters (CEs) in activated macrophages and concomitant decrease of cholesterol-HDL (C-HDL). Yet the precise role of HDL during microbial infection has not been fully elucidated. Activation of P388D1 by lipopolysaccharide (LPS) triggered an increase of CEs and neutral lipid contents, along with a remarkable enhancement in 1,1′-dioctadecyl-3,3,3′,3′-tetramethylindocarbocyanine perchlorate-HDL uptake. Similar results were found in human monocyte-derived macrophages and monocytes cocultured with phytohemagglutinin-activated lymphocytes. Inhibition of cholesterol esterification with Sandoz-58035 resulted in 80% suppression of CE biosynthesis in P388D1. However, only a 35% decrease of CE content, together with increased scavenger receptor class B member 1 (SR-B1) protein expression, was found after 72 h and thereafter up to 16 passages of continuous ACAT suppression. Chronic inhibition blunted the effect of LPS treatment on cholesterol metabolism, increased the ratio of free cholesterol/CE content and enhanced interleukin 6 secretion.These results imply that, besides de novo biosynthesis and acquisition by LDL, HDL contributes probably through SR-B1 to the increased CE content in macrophages, partly explaining the low levels of C-HDL during their activation. Our data suggest that in those conditions where more CEs are required, HDL rather than removing, may supply CEs to the cells.
Keywords: microbial stimulus, immune cells, inflammation
Cholesteryl esters (CEs) overload in macrophages (1) and low levels of cholesterol-HDLs (C-HDLs) (2, 3) are a hallmark of atherosclerosis. Similar changes are present in chronic metabolic diseases (hypercholesterolemia, insulin resistance, diabetes, etc.) (4), and have been described in other disorders such as cancer (5–9) and infections (10). Probably, accumulation of CEs serves as a reservoir of cholesterol for an enhanced membrane biogenesis during sustained proliferation.
During acute infections the body undergoes several metabolic changes (11, 12), among which plasma lipid alterations are prominent and related to a shift in energetic requirements (increased triglycerides and fatty acids) (13, 14) or to structural modification of LDLs (15) and HDLs (16, 17). The infection-related decrease in C-HDLs observed in all species is ascribed to a reduction of proteins involved in reverse cholesterol transport (18, 19), supposedly induced by inflammatory molecules secreted from immune cells activated by the microbial stimulus (16). Thus, during infection, an inefficient removal of cholesterol from the arteries may contribute toward eliciting a lipid overload of macrophages and transformation of the former into foam cells (19). For this reason, infections have been considered as a serious risk factor for the development or worsening of atherosclerosis (20–22). Epidemiological findings support this correlation, with acute vascular accidents (myocardial infarction, ictus, etc.) being described during acute and chronic infections. Carotid plaques have been observed in patients with periodontal diseases (23, 24) and other chronic infections (25, 26). Macrophages are the major players of innate immunity, possessing a number of receptors that enable them to recognize both microbial infections, i.e., toll-like receptor (TLR)-2 and TLR-4 (27), and metabolic antigens such as modified LDL, i.e., scavenger receptors A and B (28, 29). Although different pathways are activated following recognition of antigens, microbial infections and metabolic diseases manifest similar lipid alterations in serum and macrophages, leading to CE enrichment of the latter.
Nascent HDLs are formed due to coalescence of phosphoslipids-apoA1 complexes, which are synthesized by the liver and the intestine (30). Nascent HDLs are converted into mature CE-rich HDLs in the blood by removing free cholesterol (FC), mainly from the CE-macrophage pool (31). It can be hypothesized that the immune response, underlying remarkable changes in CE metabolism, may be directly responsible for low plasma C-HDLs. To add further insight into this aspect, we investigated the way by which microbial macrophage response leads to CE content increase in a macrophage-like cell line P388D1, in human monocyte-derived macrophages activated with the microbial stimulus lipopolysaccharide (LPS) (Escherichia coli 026:B26), and in monocytes cocultured in presence of phytohemagglutinin (PHA)-activated lymphocytes.
METHODS
Cells
P388D1 cells.
The murine P388D1 macrophage-like cell line, a well-studied model for investigating human atherogenesis (32, 33), was obtained from the American Type Culture Collection (Rockville, MD). Cultures were maintained in exponential growth (between 2 × 10⁵ cells/ml and 1.5 × 10⁶ cells/ml) at 37°C, 5% CO2 in T-25 cm2 tissue culture flasks (Falcon, M19, Milan, Italy) containing RPMI 1640 medium supplemented with 10% bovine calf serum (BCS) (Bioquote Ltd., York, UK), streptomycin (100 μg/ml), l-glutamine (2 mM), and penicillin (100 U/ml). Stock cultures were diluted and seeded at a density of ∼2 × 10⁵ cells/ml in growth medium twice a week. According to other authors (34, 35), to achieve the best immune activation, cells at a density of 2.5 × 10⁵ cells/ml were given the microbial stimulus LPS, serotype 026:B26, at 100 ng/ml for 72 h. To inhibit cholesteryl esterification, cells were treated with the ACAT inhibitor Sandoz-58035 (Sz-58035) (4 μM; Sigma-Aldrich, Milan, Italy) for 72 h [acute Sz-58035 treatment (ACS) ]. To investigate the effect of continuous inhibition of CE synthesis, cells were cultured for at least 16 passages (about 50 cell cycles) with the drug [chronic Sz-58035 treatment (CRS)]. To investigate the effect of lipoprotein deficiency, in some experiments cells were cultured in medium containing 10% BCS or 10% lipoprotein-deprived bovine calf serum (LDBCS). In order to investigate the contribution of lipoproteins, CE metabolism and cytokine secretion were evaluated in cells cultured in the presence of LDLs (100 μg/ml) and HDLs (250 μg/ml) (Biochemical Technology Inc., Stoughton, MA) given singularly.
Human peripheral mononuclear cells.
In this study whole heparinized blood samples from healthy volunteers (n = 6) were drawn after the subjects gave their written informed consent, approved by the Institutional Review Boards. Peripheral blood mononuclear cells (PBMCs) were separated by Lymphoprep (Nycomed Pharma AS, Oslo, Norway) density gradient centrifugation, as previously described (36). Cells were cultured at a density of 3.0 × 10⁶ cells/ml in RPMI 1640 supplemented with 10% fetal calf serum, penicillin (100 U/ml), streptomycin (100 mg/ml), and 2 mM l-glutamine at 37°C in a 5% CO2 humidified atmosphere. A 99% pure monocyte cell suspension was obtained from isolated PBMCs using the positive magnetic labeling protocol by BD IMag™ anti-human CD14 magnetic particles DM, according to the manufacturer's guidelines (BD Biosciences). Briefly, monocytes were seeded at a density of 2.0 × 10⁵ cells/ml, fresh medium was supplied every three days and macrophage differentiation was obtained between days 7 and 9. Thereafter, macrophages were incubated with LPS (20 ng/ml) and harvested at the indicated times. Before carrying out the experiments, we performed a dose-response curve of LPS treatment of human monocyte-derived macrophages. The LPS dose range that produced the best inflammatory response, evaluated by measuring interleukin (IL)-1β, tumor necrosis factor α (TNF-α), and IL-6 secretion, albeit not significantly toxic to cells, were established ranging from 20 to 50 ng/ml (data not shown), which also corresponds to that reported in the literature (36–39). In some experiments, PBMCs were cultured for 48 h with PHA (10 μg/ml). At the end of experiments, the suspended cells (mostly clustered activated lymphocytes) were removed and adherent cells (mostly monocytes) were examined.
Determination of cholesterol esterification from [14C]oleate
Cells were incubated for 4 h in medium containing [14C]oleate bound to BSA. To prepare the oleate-BSA complex, 3.7 MBq of [14C]oleic acid in ethanol (specific activity 2.035 GBq/mmol) was mixed with 1.4 mg KOH and the ethanol evaporated. PBS (1.5 ml) without Ca2+ and Mg2+, containing 4.24 mg BSA (fatty acid-free) was added and the mixture shaken vigorously. This solution was added to each well for a final concentration of 74 KBq/ml. After incubation, cells were washed with ice-cold PBS and lipids extracted with acetone. Neutral lipids were separated by TLC, and incorporation of [14C]oleate into CEs was measured (40). An aliquot of cell lysate was processed for protein content (41).
Analysis of FC and CEs in media and cells
Total lipids were extracted from the cells and media using the method described by Folch, Lees, and Stanley (40). Aliquots from chloroform phase were dried down under vacuum and dissolved in methanol for HPLC analysis. Separation of CEs was carried out as described (42–44) using an Agilent 1100 HPLC system (Agilent, Palo Alto, CA) equipped with a diode array detector and mass spectrometer in line. Ultraviolet and mass spectra were recorded to confirm the identification of HPLC peaks. In these experiments, to evaluate the exogenous CE source, we used as a marker (42) the content of conjugated linoleic acid 18:2 (CLA) in cellular CEs. In fact such a fatty acid is biosynthesized exclusively in the rumen and characteristic of the tissues and milk of ruminants. Although P388D1 cells are unable to synthesize it by themselves, they can obtain CLA from lipoproteins of culture medium enriched with a 10% BCS. The fact that ACAT-inhibited cells are unable to synthetize CEs endogenously (from either LDL hydrolysis or new cholesterol synthesis), supports the hypothesis that CE-HDLs represent the only possible source. With our detection method, CLA has a very different chromatographic retention time than hydroperoxyoctadecadienoic acid and hydroxyoctadecanoic acid (45), these latter molecules likely formed in the pro-oxidant environment created by LPS activation. As expected, cholesteryl CLA was present in BCS. In addition, prior to use, we assessed the integrity of the commercially purchased lipoproteins by evaluating the CE oxidation state (Table 1).
TABLE 1.
CE profile of ac-LDLs, LDLs, and HDLs added to the delipidated medium and of BCS
| Ox-CE | C16:0 CE | C18:0 CE | C16:1 CE | C18:1 CE | C18:2 CE | C20:3 CE | C20:4 CE | C 22:6 CE | |
| ac-LDLs (mol%) | 0.37 | 28.32 | 12.70 | 5.32 | 31.21 | 21.36 | n.d. | 0.71 | n.d. |
| LDLs (mol%) | 0.12 | 16.21 | 13.74 | 1.54 | 16.51 | 42.74 | 1.42 | 5.80 | 0.83 |
| HDLs (mol%) | 0.01 | 18.70 | 17.62 | n.d. | 14.79 | 34.03 | 1.70 | 9.82 | 2.19 |
| BCS (mol%) | 0.08 | 15.95 | 11.32 | 1.22 | 13.36 | 50.98 | 0.88 | 2.46 | 0.19 |
Ox-CE, oxidized CEs; C16:0 CE, cholesteryl palmitate; C18:0 CE, cholesteryl stearate; C16:1 CE, cholesteryl palmitoleate; C18:1 CE, cholesteryl oleate; C18:2 CE, cholesteryl linoleate; C20:3 CE, cholesteryl eicosatrienoate; C20:4 CE, cholesteryl arachidonate; C22:6 CE, cholesteryl docosahexanoate; n.d., not detected.
Neutral lipids stored in the droplets: imaging and measurements
To visualize neutral lipids in situ, cells were cultured in 35 mm glass-bottomed dishes (MatTek, Ashland, MA). After fixation for at least 30 min with a proportional amount of paraformaldehyde (PFA) from a 16% stock solution to the growth medium to obtain a final concentration of 4% PFA, cells were washed in PBS and stained with 300 nM Nile red (9-diethylamino-5H-benzo[α]phenoxazine-5-one; Fluka, Buchs, SG, Switzerland) in PBS (46, 47). Nile red is a fluorescent dye that stains differentially polar lipids (i.e., phospholipids) and neutral lipids (i.e., CEs and triglycerides). Polar lipids display a red emission, while neutral lipids a green emission. Red emission was observed with 540 ± 12.5 nm excitation and 590 LP nm emission filters. Green emission was observed with 460 ± 25 nm excitation and 535 ± 20 nm emission filters.
Dil-HDL uptake, Dil-ac-LDL and Dil-LDL binding
To evaluate the binding of LDLs and acetylated LDLs (ac-LDLs) and the uptake of CE-HDLs, we utilized lipoprotein bound with 1,1′-dioctadecyl-3,3,3′,3′-tetramethylindocarbocyanine perchlorate (Dil) (Bioquote Ltd.). Dil is a fluorescent dye which, when excited with 514 nm light, shows an emission peak at 550 nm, suitable for viewing with a common filter for rhodamine. In the experiments carried out in the context of the present study, a modified protocol of Stephan and Yurachek (48) was applied. In particular, cells were seeded at a concentration of 2.0 × 10⁵ cells/ml and incubated at 37°C and 5% CO2 for 72 h with various experimental treatments as needed. Subsequently, cells were washed twice with PBS and once with medium 199 supplemented with 10 mM HEPES, pH 7.3. On the basis of preliminary experiments (see supplementary data), all lipoprotein incubations were carried out for 1 h at 4°C; at this temperature LDLs and ac-LDLs bind to their receptor but internationalization is avoided giving the peculiar crown shape; on the contrary, HDLs do not bind to any receptor and only the CE component is internalized (49). Following incubation and subsequent to two washes with PBS, cells were incubated for 10 min with Hanks’ balanced salt solution. After an additional washing in PBS, cells were fixed with 4% PFA for 10 min at 22°C, and once more washed with PBS.
Microscopy and imaging
Microscope observations were performed with an Olympus IX71 inverted microscope (Olympus, Tokyo, Japan) fitted with a 20×/0.7 plan apochromatic objective. Twelve-bit images were captured using a cooled CCD camera (PCO Sensicam, Kelheim, Germany), electronically coupled to a mechanical shutter interposed between the 100 W Hg lamp and the microscope to limit photo bleaching. Excitation light was attenuated with a 6% density neutral density filter. The nominal resolution of images was 0.3 μm/pixel. Quantitative analysis of images was performed with the Image Pro Plus package (Media Cybernetics, Silver Springs, MD). At least 400 cells were measured individually for each experimental group.
Western blotting analysis
The cells were lysed at 4°C in a PBS buffer containing 10% SDS, 50 μg Tris, 1 μM EDTA (pH 7.5), 50 μM DTT, and a protease inhibitor cocktail, homogenized by a UP100H compact ultrasonic laboratory device (Hielscher Ultrasonics GmbH, Teltow Germany). Protein content of each sample was determined by bicinchoninic acid (Sigma-Aldrich) assay (50) and processed as previously described (51). In particular, protein samples (30 μg/lane) were separated by electrophoresis (12% SDS acrylamide gel) and transferred to nitrocellulose, 0.45 μm pore size (Invitrogen, Milan, Italy) by standard electro-blotting procedure. The blots were pretreated with a solution containing 5% nonfat dried milk, at room temperature in TBST (50 μM Tris-HCl, pH 7.6; 0.15 M NaCl; and 0.05% Tween-20) for at least 1 h before the addition of the primary antibodies (dilution range varying from 1:200 to 1:1,000) for mouse scavenger receptor class B member 1 (SR-B1), TLR-4, and nuclear factor kappa-light-chain-enhancer of activated B (NFkB) cells (Santa Cruz Biotechnology, Santa Cruz, CA). After an overnight incubation, the primary antibodies were removed and appropriate horseradish peroxidase-conjugated secondary antibodies (Santa Cruz Biotechnology) were added in a dilution range of 1:3,000 to 1:5,000 for at least 1 h at room temperature. Proteins were detected by enhanced chemiluminescence (Amersham-Pharmacia Biotech, Milan, Italy) and by exposure to X-ray film (Sigma-Aldrich) for various times. Quantification of the protein bands was then accomplished by densitometry (Image J software; National Institutes of Health, Bethesda, MD).
Cytokine assay
Cells were removed by 400 g centrifugation for 10 min and supernatants frozen at −80°C for subsequent determination of IL-1β, IL-6, and TNF-α. Cytokines were assessed with a sandwich ELISA test (Abcam, Cambridge, UK) as reported previously (52). Absorbance at 450 nm for all cytokines was measured with a microplate reader, model 680 (Bio-Rad, Hercules, CA). A standard curve was prepared by plotting absorbance value of the standard cytokine versus the corresponding concentration (pg/ml or ng/ml). The range of assay for cytokines: 7.8–1,000 pg/ml for IL-1β and IL-6 and 31.2–2,000 pg/ml for TNF-α. Cell protein content was measured by the Lowry method (41).
Statistical analysis
Data from all experiments were analyzed with GraphPad Prism software version 5.00 for Windows (GraphPad, San Diego CA) and Statistica (StatSoft, Tulsa, OK). All data were expressed as the mean ± SE of experiments in triplicate and analyzed by one- or two-way ANOVA, post hoc tests (Newman-Keuls, LSD-Fisher, or Bonferroni test) when required. Data were considered significant when P was <0.05.
RESULTS
CE profile and oxidized CEs in lipoproteins and BCS
Table 1 shows the CE profile and the percentage of oxidized CEs of ac-LDLs, LDLs, HDLs, and BCS, commercially obtained. Normal HDLs and LDLs showed similar content as BCS, whereas ac-LDLs showed a 4-fold increase.
CE content increases in LPS-activated P388D1 cells
As shown in Table 2, at 72 h, LPS-activated macrophages [control (CTR)+LPS] showed a significantly higher content of CEs when compared with nonactivated cells (CTR). No significant difference was observed between the two groups with regard to FC.
TABLE 2.
FC, CLA-CE, and CE content in activated P388D1 macrophages
| Treatments | FC (nmol/107 cells) | CLA-CE (nmol/107 cells) | CE (nmol/107 cells) | CLA/CE (%) | FC/CE |
| CTR | 187.92 ± 10.68 | 5.86 ± 0.56 | 78.60 ± 3.15 | 7.44 | 2.39 |
| CTR+LPS | 200.98 ± 0.67 | 5.48 ± 1.03 | 92.99 ± 8.08a | 5.86 | 2.17 |
| ACS | 203.56 ± 17.97 | 6.13 ± 1.60 | 50.72 ± 9.17c | 12.47 | 4.10c |
| ACS+LPS | 206.75 ± 5.81 | 6.19 ± 0.98 | 47.85 ± 0.76c | 12.96b | 4.32c |
| CRS | 222.66 ± 21.06c | 6.69 ± 1.05 | 43.82 ± 3.07c | 15.33b | 5.10c |
| CRS+LPS | 229.37 ± 2.41c | 6.76 ± 1.65 | 39.27 ± 3.54c | 17.06b | 5.87c |
FC, CLA-CE, total CE, and FC/CE were evaluated in P388D1 cells with/without LPS activation and in the absence (CTR) and presence of Sz-58035 (4 μM) for a period of 72 h (ACS) or 2 months (CRS).
P < 0.05 versus CTR without LPS.
P < 0.01 versus CTR and ACS without LPS.
P < 0.001 versus CTR ± LPS.
Cells growing in acute (ACS) and chronic (CRS) presence of the ACAT inhibitor Sz-58035 displayed a significant and consistent decrease of CEs, whereas FC significantly increased only in CRS cells. LPS activation failed to raise CE content in both acute and chronically treated cells, although the FC/CE ratio was maintained at a higher level than in CTR cells. CLA percentage in CEs was significantly increased in all Sz-58035-treated cells; this strongly suggests an exogenous uptake of cholesteryl-CLA from the medium.
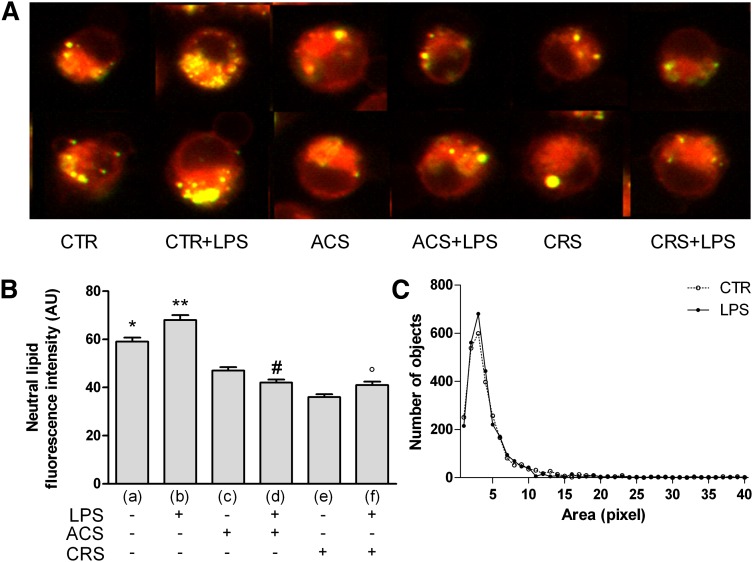
CTR+LPS cells (Fig. 1A) showed increased Nile red fluorescence, indicating a higher content of neutral lipids in organelles of activated cells. Conversely, ACAT inhibition was accompanied by a significant decrease of Nile red fluorescence compared with both LPS-treated and -untreated cells. These results were confirmed by densitometric analysis (Fig. 1B). The count of number of droplets showed a peak significantly higher in CTR+LPS cells, although the size was similar to that of CTR macrophages (Fig. 1C).
Fig. 1.
Neutral lipids in LPS-activated cells and effect of ACAT inhibition. P388D1 (CTR), and chronically inhibited cells (CRS) were activated for 72 h with LPS; simultaneously, one group of LPS-stimulated cells was treated with 4 μM Sz-58035 (ACS). At the end of incubation cells were washed, fixed in 4% PFA, resuspended in 300 nM Nile red and observed using an Olympus IX 71 inverted microscope fitted with a 20×/0.7 plan apochromatic objective. Twelve-bit images were captured using a cooled CCD camera (for details see Methods). Polar lipids display a red emission, while neutral lipids a green emission. Quantitative analysis of images was performed using the ImagePro Plus package. At least 400 cells were individually measured for each experimental group. A: Neutral lipids, stained with Nile red in the different experimental groups, are identified as yellow spots as result of the merger of the red and green channels in the imaging process. B: Quantitative analysis of Nile red green emission. C: Lipid droplet distribution profiled by number and size. Data were reported as mean ± SE. *P < 0.05; **P < 0.05 versus all; #P < 0.05 versus (c); and °P < 0.05 versus (e) (Fisher's LSD as post hoc test).
Origin of CEs in LPS-activated P388D1 cells
P388D1 macrophages synthesize a very small quantity of cholesterol also during proliferation. On the contrary, cholesterol esterification is active throughout cell proliferation, indicating that FC originates mainly from LDL hydrolysis (see supplementary data).
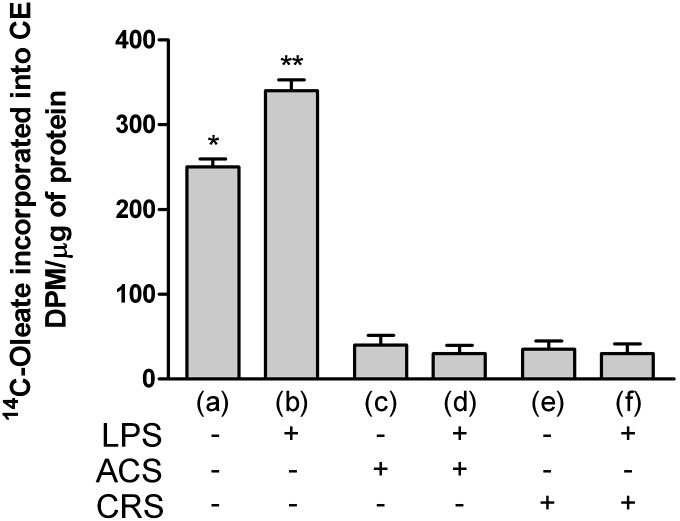
As shown in Fig. 2, cholesterol esterification was significantly higher in CTR+LPS cells (Fig. 2B). In agreement with other studies (53), the increase of cholesterol ester synthesis was remarkably higher when ac-LDLs were added simultaneously with LPS (data not shown). Inhibition of ACAT activity almost completely inhibited CE synthesis both in cells receiving the drug for 72 h (ACS) and those inhibited for 2 months (CRS), even in the presence of the microbial stimulus.
Fig. 2.
ACAT inhibition prevents the increase of CE synthesis in LPS-activated cells. Experimental conditions were as described in Fig. 1. Cells were seeded at a density of 2 × 10⁵ cells/ml in tissue culture plates and grown in RPMI 1640 medium supplemented with 10% BCS. Four hours before the end of incubation cells were labeled with 37 KBq of [14C]oleic acid and the amount of [14C]oleate incorporated into CEs was determined as described in Methods . Data were reported as mean ± SD. *P < 0.05; **P < 0.05 versus all (Bonferroni as post hoc test).
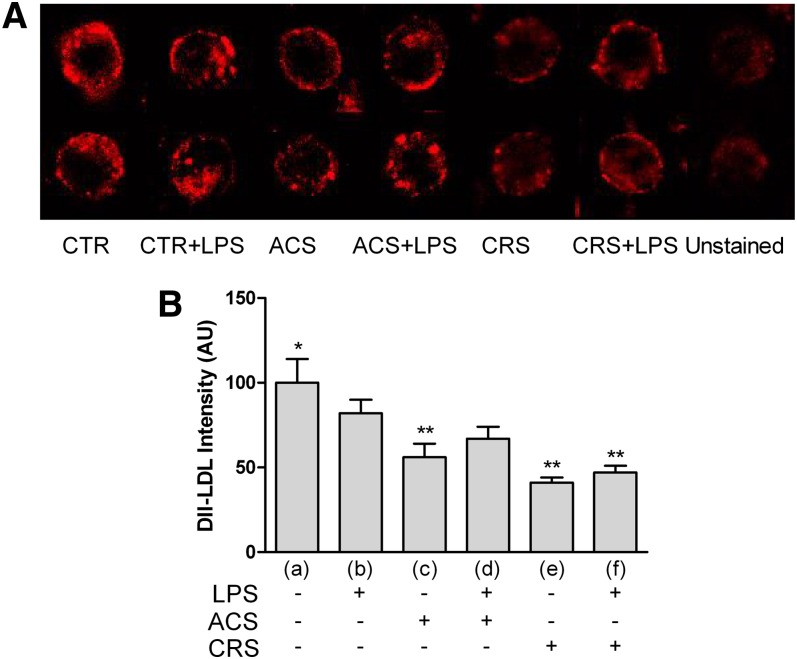
Dil-LDL binding in LPS-activated cells with or without the inhibitor is reported in Fig. 3A. The picture shows a lower fluorescence in CTR+LPS cells compared with CTR; fluorescence decreases further in presence of the ACAT inhibitor. The data obtained were supported by analytical analysis of the images (Fig. 3B).
Fig. 3.
LDL binding in activated P388D1 cells and during acute or chronic ACAT inhibition. Experimental conditions were as described in Fig. 1. To evaluate binding of LDLs, the fluorescent dye Dil (Bioquote Ltd.) was used. Cells were seeded at a concentration of 2.0 × 10⁵ cells/ml and incubated at 4°C for 2 h with 10 μg/ml of Dil-LDLs (for details see Methods). At least 400 cells were measured individually for each experimental group. A: LDL binding visualized as Dil fluorescence in the different experimental groups. B: Quantitative analysis of fluorescence emission. Data were reported as mean ± SE. *P < 0.05 versus all; **P < 0.05 versus (b) (Newman-Keuls as post hoc test).
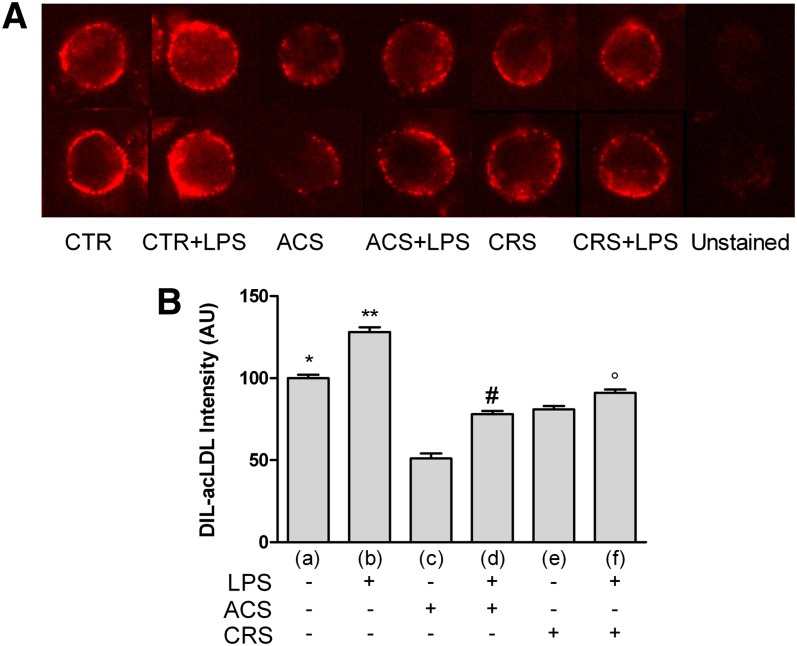
Figure 4A shows Dil-ac-LDL binding in LPS-activated cells with or without Sz-58035. At variance with normal Dil-LDLs, CTR+LPS cells showed a remarkable increase of fluorescence. Although never exceeding that of unstimulated cells, fluorescence increased in LPS-treated macrophages also in the presence of Sz-58035; this effect was more evident in ACS cells. The data obtained were supported by analytical analysis of the images (Fig. 4B).
Fig. 4.
ac-LDL binding in activated P388D1 cells and during acute or chronic ACAT inhibition. Experimental conditions were as described in Fig. 1. To evaluate binding of ac-LDLs, cells were seeded at a concentration of 2.0 × 10⁵ cells/ml and incubated at 4°C for 30 min with 10 μg/ml of Dil-ac-LDLs (for details see Methods). At least 400 cells were measured individually for each experimental group. A: ac-LDL binding visualized as Dil fluorescence in the different experimental groups. B: Quantitative analysis of fluorescence emission. Data were reported as mean ± SE. *P < 0.05; **P < 0.05 versus all; #P < 0.05 versus (c); and °P < 0.05 versus (e) (Newman-Keuls as post hoc test).
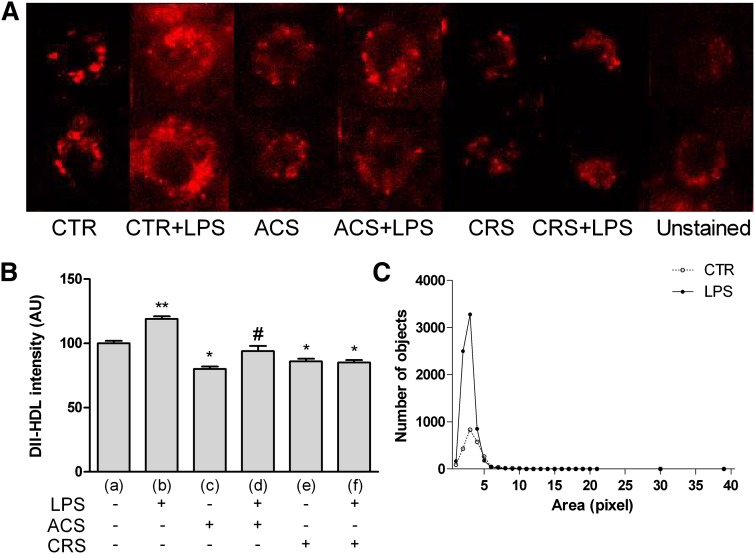
Dil-HDL fluorescence increased remarkably in CTR+LPS cells, indicating active CE-HDL uptake (Fig. 5A) in the presence of microbial stimulus; their uptake decreased in cells treated with Sz-58035, also in the presence of microbial stimulus. These findings were confirmed by analytical analysis of the data (Fig. 5B). As pictured in Fig. 5C, CE spots in LPS cells incubated with Dil-HDLs were definitely more abundant and smaller than those observed in CTR cells.
Fig. 5.
CE-HDLs in activated P388D1 cells and during acute or chronic ACAT inhibition. Experimental conditions were as described in Fig. 1. To evaluate binding of Dil-HDLs, cells were seeded at a concentration of 2.0 × 10⁵ cells/ml and incubated at 4°C for 1 h with 10 μg/ml of Dil-HDLs (for details see Methods). At least 400 cells were measured individually for each experimental group. A: Dil-HDL uptake visualized as Dil fluorescence in the different experimental groups. B: Quantitative analysis of fluorescence emission. C: Lipid droplet distribution profiled by number and size. Data were reported as mean ± SE. *P < 0.05 versus (a); **P < 0.05 versus all; and #P < 0.05 versus (c) (Newman-Keuls as post hoc test).
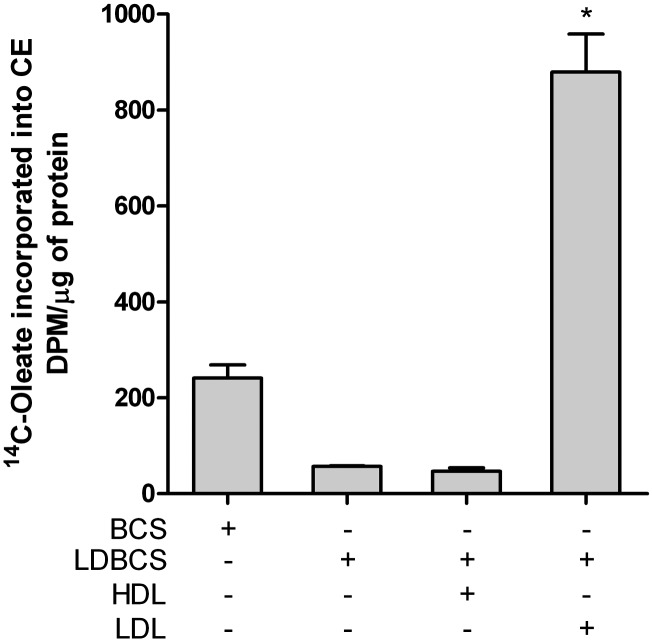
The rate of cholesterol esterification in P388D1 macrophages was modulated by the supply of LDLs and HDLs. As shown in Fig. 6, cholesterol esterification is absent in LDL-deprived medium, while it increased almost 5-fold in the absence of HDLs. Given the low endogenous production of cholesterol, it is highly likely that esterification originates from LDL hydrolysis, mainly modified LDLs.
Fig. 6.
Cholesterol esterification is dependent on lipoprotein availability. Cells were seeded at a concentration of 2.0 × 10⁵ cells/ml and grown for 72 h in medium constituted respectively of BCS, LDBCS, LDBCS+HDL (250 μg/ml), and LDBCS+LDL (100 μg/ml). Four hours before the end of incubation cells were labeled with 37 KBq of [14C]oleic acid and the amount of [14C]oleate incorporated into CEs was determined as described in the Methods. Data were reported as mean ± SD. *P < 0.0001 versus all (Newman-Keuls as post hoc test).
TLR-4, NFkB, and SR-B1 protein expression in activated P388D1 cells with and without ACAT inhibitor
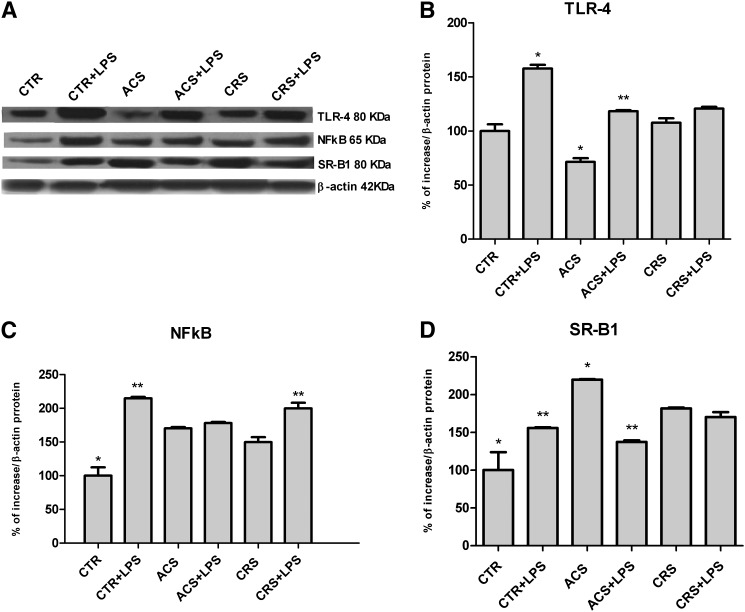
As shown in Fig. 7A, B, LPS activation was accompanied by a significant increase of TRL-4 protein expression in control cells (CTR+LPS). LPS exerted a similar effect also in ACAT-inhibited cells, however ACS cells showed a significantly lower expression of the protein that was remarkably increased in presence of LPS. On the contrary, the chronic action of the inhibitor did not result in any reduction of the protein. Similarly, NFkB showed a greater expression in CTR+LPS (Fig. 7A, C). NFkB expression was higher in all ACAT-inhibited cells, also in presence of the microbial stimulus, although they never reached the expression level observed in CTR+LPS cells (Fig. 7A, C). Furthermore, SR-B1 expression increased significantly in CTR+LPS cells when compared with CTR cells, whereas high levels were observed in all ACAT-inhibited cells, even in the absence of microbial stimulus (Fig. 7A, D).
Fig. 7.
TLR-4, NFkB, and SR-B1 protein expression in activated P388D1 cells with and without ACAT inhibitor. Experimental conditions were as described in Fig. 1. At the end of incubation, cells were harvested and stored in RIPA buffer at −20°C until protein assay was performed. Western blotting analysis was performed using specific antibodies for TLR-4, NFkB, and SR-B1 as described in Methods. The blots were visualized using enhanced chemiluminescence reagents and autoradiography (A). The antibody quantitative relative expression was calculated by comparison with β-actin (ImageJ software). Data for protein levels of TRL-4 (B), NFkB (C), and SR-B1 (D) were expressed as mean ± SD of three different experiments. *P < 0.05 versus all; **P < 0.05 versus the respective ±LPS (Newman-Keuls as post hoc test).
ACAT inhibition and lipoprotein supply modulate cytokine production
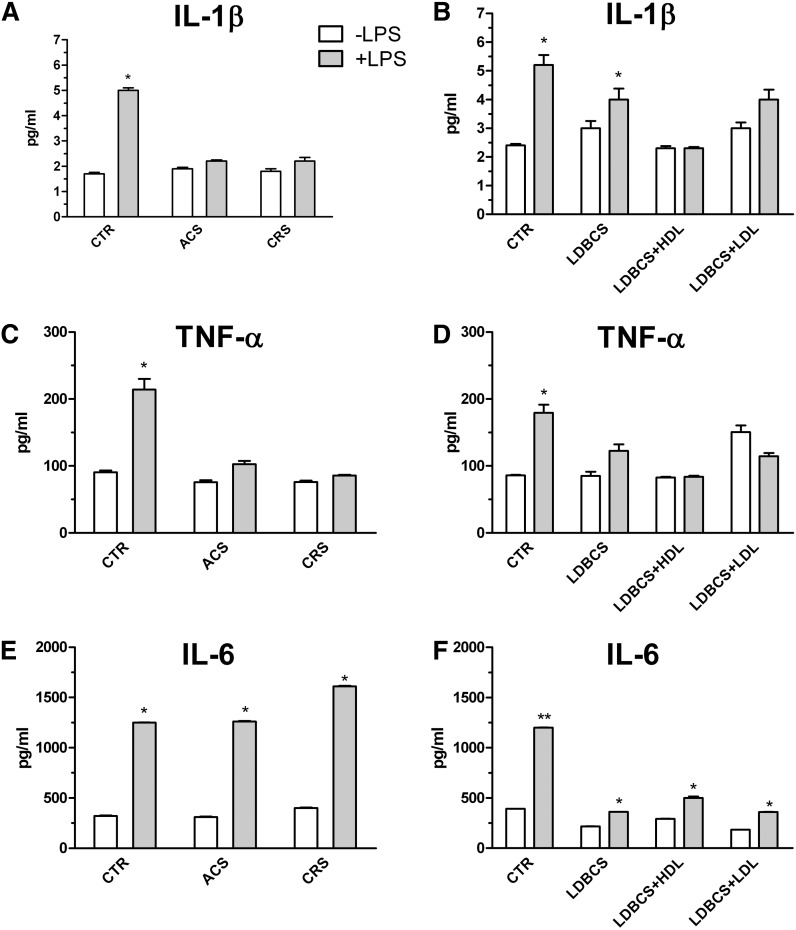
As shown in Fig. 8, the inhibition of cholesterol esterification produces a range of effects on cytokine secretion: IL-1β and TNF-α (Fig. 8A and C, respectively) were suppressed in both treatments when compared with CTR+LPS. IL-6 (Fig. 8E) production in ACS cells was as efficient as in cells treated with CTR+LPS, and an overproduction was seen in chronically inhibited (CRS) cells.
Fig. 8.
Effect of ACAT inhibition and lipoprotein depletion on cytokine secretion. Experimental conditions were as described in Fig. 1. At the end of incubations, cells were harvested and media collected and processed as described in Methods. IL1β (A), TNF-α (C), and IL-6 (E) secretion from cells cultured in the acute (ACS) and chronic (CRS) presence of Sz-58035. IL1β (B), TNF-α (D), and IL-6 (F) secretion from cultured cells in LDBCS alone or plus HDLs or LDLs. Data were reported as mean ± SD. *P < 0.001 versus the respective control group; **P < 0.0001 versus all (Bonferroni as post hoc test).
TNF-α and IL-6 production (Fig. 8B and D, respectively), but not IL-1β (Fig. 8F), were lower in activated cells cultured in LDBCS. The addition of LDLs and HDLs singularly did not restore the inhibition of cytokine secretion in LDBCS-activated macrophages.
Neutral lipids and HDL uptake in 48 h LPS-activated human monocyte-derived macrophages
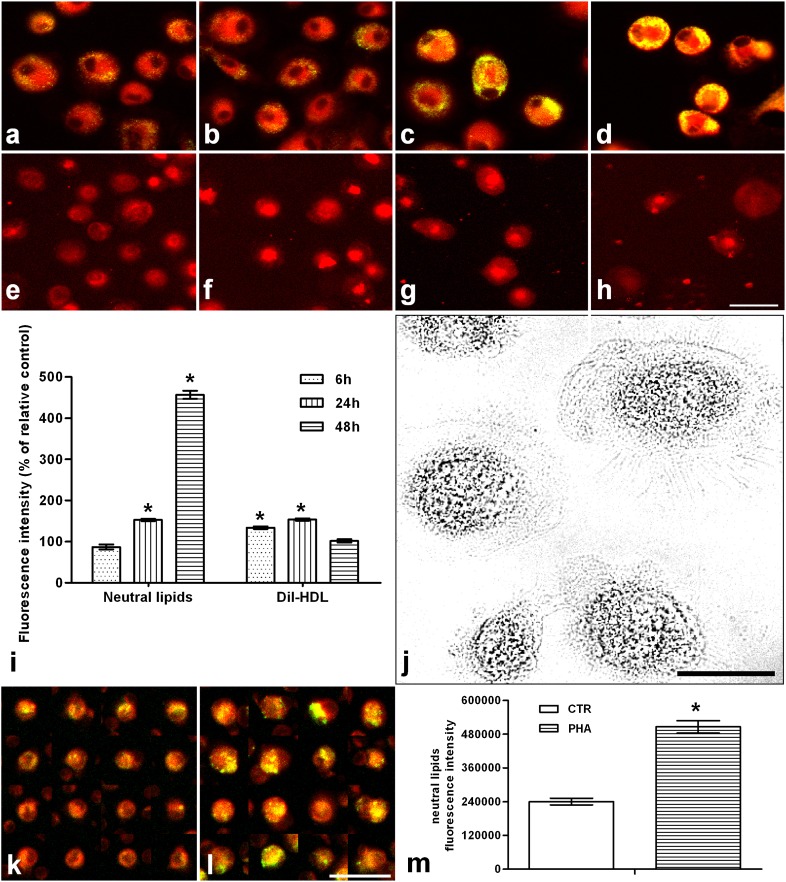
As shown in Fig. 9, lipid droplet content (Fig. 9a–d) was significantly increased after 24 h (Fig. 9c) of activation, being about four times higher after 48 h (Fig. 9d). Dil-HDL uptake (Fig. 9e–h) was already evident at 6 h (Fig. 9f) and further increased at 24 h (Fig. 9g), recovering the same pattern of unstimulated ones after 48 h (Fig. 9h). These findings were confirmed by imaging analysis (Fig. 9i). Nile red fluorescence (Fig. 9k, l) was also increased in monocytes cocultured in presence of 48 h PHA-activated lymphocytes, as further confirmed by analysis of the data (Fig. 9m).
Fig. 9.
Neutral lipids and HDL uptake in 48 h LPS-activated human monocyte-derived macrophages and in monocytes cocultured with PHA-stimulated lymphocytes. a–d: Show neutral lipids stained with 300 nM Nile red (yellow/green emission) in situ, in unstimulated cells and LPS-stimulated cells for 6, 24, and 48 h, respectively. e–h: Show C-HDL uptake, visualized as Dil fluorescence, in unstimulated cells and LPS-stimulated cells for 6, 24, and 48 h, respectively (for details see Methods). Images were obtained using an Olympus IX 71 inverted microscope fitted with a 20×/0.7 plan apochromatic objective. Twelve-bit images were captured using a cooled CCD camera (for details see Methods). Quantitative analysis of images was performed using the ImagePro Plus package. At least 400 cells were individually measured for each experimental group. i: Nile red and Dil-HDL fluorescence quantitative analysis by imaging of human macrophages. j: Representative optical microscopic field of human monocyte-derived macrophages. The bottom of the figure shows Nile red fluorescence in monocytes cocultured without (k) and with (l) 48 h PHA-stimulated lymphocytes and the relative quantitative analysis (m). Bars within the images represent 30 μm. Data were reported as mean ± SD. *P < 0.001 versus relative controls (Fisher's LSD as post hoc test).
DISCUSSION
Infections lead to consistent changes in CE content both in activated macrophages and in serum lipoproteins of affected organisms. The former effect has been ascribed to a decrease in the efficacy of proteins mediating cholesterol efflux (ABCA1 and ABCG1) (19), and to an increase of CEs in activated cells leading, in a similar way as atherosclerosis, to an overloading of lipid droplets in immune cells. The observed lipoprotein changes include the finding of low levels of HDL cholesterol, likely representing a secondary effect elicited by cytokines produced from immune cells (16). The extraordinary amount of epidemiological data available describing the development or worsening of atherosclerosis during infections (10–15) attests to its importance as a major risk factor for the disease. The data obtained here demonstrate that following microbial stimulus, FC synthesis and content did not change significantly, whereas CE synthesis, content, and storage in lipid droplets were considerably higher. Moreover, the data obtained in this study demonstrate how activated macrophages increase CE levels by two means: i) higher cholesterol esterification through enhanced binding of ac-LDLs, and ii) uptake of CEs via HDLs; this latter effect being further supported by the increase of SR-B1 protein expression. Because P388D1 macrophages synthesize extremely low levels of cholesterol, all esterified sterols must necessarily originate from LDL hydrolysis. Interestingly, the normal LDL-r pathway seems to be less efficient in our activated cells, whereas the higher binding of ac-LDLs suggests that a more functional scavenger receptor pathway supplies intracellular FC. As this in vitro model is independent of systemic perturbations leading to LDL oxidation described in vivo (15, 54, 55), we suggest this increased efficacy on removing modified lipoproteins to be a peculiarity of microbial-activated macrophages. Accordingly, the increase of neutral lipids and HDL uptake was found in LPS-activated human monocyte-derived macrophages as well. These data suggest that, also in humans, HDLs contribute to neutral lipid enrichment in macrophages. Indeed, we have previously demonstrated that LPS scarcely affects cholesterol esterification in human primary monocytes and macrophages (36, 38), suggesting the exogenous source of CEs during infections.
Interestingly, we observed an increase of neutral lipids even in human monocytes cocultured with lectin-activated lymphocytes. It is well known that CEs, in specialized tissues such as the adrenal cortex and liver (56), are taken up directly from HDLs (57) by a plasma-membrane scavenger receptor protein (SR-B1) in rodents (49), and CLA-1 in humans (58). Furthermore, a selective uptake of CE-HDLs by SR-B1 has been described in rapidly proliferating tumor cells (50, 58, 59).
The present results strongly suggest that a relevant part of CEs in microbial-activated P388D1 cells derives from the uptake of CE-HDLs via SR-B1. The increase of this protein can also account for the presence of CEs in cells unable to synthesize it in up to 50 cell cycles. Esterification does not occur in cells cultured in serum deprived of endogenous cholesterol from LDLs. This indicates that CEs from HDLs are neither hydrolyzed nor reesterified, as instead often described (58, 59), but rather results in a direct increase of the cellular pool of CEs as a preformed molecule. CEs in ACAT-inhibited macrophages showed a higher content of CLA, a fatty acid present in CE lipoproteins from bovine serum of culture medium. The fact that ACAT-inhibited cells were unable to synthesize CEs endogenously, further supports the hypothesis that CE-HDLs represent the source. Thus, we hypothesize that the increased uptake of CEs from HDLs represents an additional pathway, which leads to CE enrichment in macrophages and, at least in part, underlies the reduction of CE-HDL plasma levels often found in humans and animals during infections.
Accordingly, in all species investigated, during infections, HDL molecules are structurally different from normal (17, 60), being mainly characterized by a lower CE content; to date this common alteration has been considered merely as an indicator of inefficient peripheral cholesterol removal. Yet, an earlier CE impoverishment of HDLs has previously been described by Li et al. (53) during infections.
The findings of the present study suggest that the macrophage CE pool derives from both LDLs and HDLs, selecting their use in line with the requirement for CEs and availability. This is demonstrated by the fact that, in the absence of HDLs, cholesterol esterification increases approximately 4-fold with respect to that detected when both lipoproteins are present. A similar regulation has been described in a leukemia cell line characterized by high CE content (51).
To evaluate the role of endogenous and exogenous sources of CEs for inflammatory response, cells were incubated in lipoprotein-deprived serum, and in the presence of HDLs and LDLs added separately. Moreover, the effect of the inhibition of endogenously-produced CEs was evaluated by blocking ACAT activity. Interestingly, the effect of Sz-58035 on Dil-ac-LDLs, Dil-HDL binding, and TLR-4 and NFkB expression was more evident after acute inhibition than that observed after chronic treatment. These results could be explained by a reduction in cell sensibility to the drug, although cholesterol esterification was still inhibited. P388D1 cells require the presence of both lipoproteins for efficient production of cytokines, although inhibition of cholesterol esterification did not prevent the increase of TLR-4 protein expression induced by LPS. However, the transcription factor NFkB, which increased in CTR+LPS cells, was consistently high in all inhibited cells, even in the absence of LPS. Moreover, ACAT inhibition differentially affected the secretion of cytokines undergoing investigation. Indeed, TNF-α and IL-1β were markedly decreased in the presence of the ACAT inhibitor, as well as in all conditions of impaired CE esterification or acquisition. Interestingly, an increase in IL-6 and TNF-α has been described by Li et al. (53), when inhibited cells were overloaded with ac-LDLs. They suggested that increased cytokine secretion was due to a higher content of FC in the above condition, particularly in view of the fact that the sterol is an acknowledged pro-inflammatory molecule (61). It is worthy of note that in activated cells the FC/CE ratio was unchanged in LPS-activated cells, whereas in ACAT-inhibited macrophages, a higher FC content, with a remarkable increase of FC/CE ratio, was observed. Unlike TNF-α and IL-1β, IL-6 secretion in acutely inhibited cells was as efficient as in activated control cells, even displaying an overproduction in chronically treated cells. This finding may account for the manifestation of acute vascular accidents in subjects treated with ACAT inhibitors as anti-atherosclerotic therapy (62), given that IL-6 has been implicated in dyslipidemia and in cardiovascular atherosclerotic risk (63, 64). Moreover, this cytokine has been described as a potent inducer of hepatic C-reactive protein, a molecule displaying increased levels in patients with severe atherosclerosis and following acute clinical events (myocardial infarction and cerebral ictus) (65). As previously demonstrated, an altered metabolic milieu may influence production of IL-6 in LPS-activated macrophages from polycystic ovary syndrome insulin-resistant girls (38). The authors have thus suggested that metabolic factors may elicit the over-production of IL-6 following microbial stimulus, concurring to determine a condition of low-grade inflammation. However, the results presented here suggest that the inflammatory response to microbial stimulus may in turn induce metabolic modifications, i.e., higher macrophage CE and CE-HDL uptake and low C-HDLs in the infected organism. Although we found similar changes in human primary macrophages, it cannot be ruled out that the alterations found in P388D1 cells may also be dependent on their high growth rate. On the other hand, the degree of lymphocyte proliferation is a very important part of an efficient immune response in humans, and that, even human macrophages residing in the atherosclerotic lesions proliferate (66).
The data obtained in this study lend further support to the fact that lipid metabolism and anti-microbial activities are closely linked, thereby accounting for their involvement in atherosclerosis. However, more sophisticated investigations should be undertaken in an attempt to unravel the underlying mechanisms, and provide a wider range of molecular targets toward which to direct anti-atherogenic therapy.
Supplementary Material
Acknowledgments
The authors thank Anne Farmer for editing of the English language and Mrs. Anna Saba for technical assistance.
Footnotes
Abbreviations:
- ac-LDL
- acetylated LDL
- ACS
- acute Sandoz-58035
- BCS
- bovine calf serum
- CE
- cholesteryl ester
- C-HDL
- cholesterol-HDL
- CLA
- conjugated linoleic acid 18:2
- CRS
- chronic Sandoz-58035
- CTR
- control
- Dil
- 1,1′-dioctadecyl-3,3,3′,3′-tetramethylindocarbocyanine perchlorate
- FC
- free cholesterol
- IL
- interleukin
- LDBCS
- lipoprotein-deprived bovine calf serum
- LPS
- lipopolysaccharide
- NFkB
- nuclear factor kappa-light-chain-enhancer of activated B cells
- PBMC
- peripheral blood mononuclear cell
- PFA
- paraformaldehyde
- PHA
- phytohemagglutinin
- SR-B1
- scavenger receptor class B member 1
- Sz-58035
- Sandoz-58035
- TLR
- toll-like receptor
- TNF-α
- tumor necrosis factor α
This work was partially funded by the Regione Sardegna L.R. 7/2007 in the context of the “Promotion of scientific research and technological innovation in Sardinia,” the Fondazione Banco di Sardegna, the Ministero della Pubblica Istruzione PRIN 2008, and by a fellowship from Regione Sardegna L.R. 7/2007 to S.U. The authors have no competing interests to declare.
The online version of this article (available at http://www.jlr.org) contains supplementary data in the form of two figures, supplementary methods and references.
REFERENCES
- 1.Schmitz G., Grandl M. 2008. Lipid homeostasis in macrophages - implications for atherosclerosis. Rev. Physiol. Biochem. Pharmacol. 160: 93–125 [DOI] [PubMed] [Google Scholar]
- 2.Fazio S., Linton M. F. 2010. High-density lipoprotein therapeutics and cardiovascular prevention. J. Clin. Lipidol. 4: 411–419 [DOI] [PubMed] [Google Scholar]
- 3.Säemann M. D., Poglitsch M., Kopecky C., Haidinger M., Horl W. H., Weichhart T. 2010. The versatility of HDL: a crucial anti-inflammatory regulator. Eur. J. Clin. Invest. 40: 1131–1143 [DOI] [PubMed] [Google Scholar]
- 4.Ghosh S. 2011. Macrophage cholesterol homeostasis and metabolic diseases: critical role of cholesteryl ester mobilization. Expert Rev. Cardiovasc. Ther. 9: 329–340 [DOI] [PMC free article] [PubMed] [Google Scholar]
- 5.Dessì S., Batetta B. 2003. Cholesterol metabolism in human tumors. In Cell Growth and Cholesterol Esters. Landes Bioscience, editor. Kluwer Academic/Plenum Publishers, New York. 34–47. [Google Scholar]
- 6.Dessì S., Batetta B., Pulisci D., Spano O., Anchisi C., Tessitore L., Costelli P., Baccino F. M., Aroasio E., Pani P. 1994. Cholesterol content in tumor tissues is inversely associated with high-density lipoprotein cholesterol in serum in patients with gastrointestinal cancer. Cancer. 73: 253–258 [DOI] [PubMed] [Google Scholar]
- 7.Dessì S., Batetta B., Spano O., Sanna F., Tonello M., Giacchino M., Tessitore L., Costelli P., Baccino F. M., Madon E., et al. 1995. Clinical remission is associated with restoration of normal high-density lipoprotein cholesterol levels in children with malignancies. Clin. Sci. (Lond.). 89: 505–510 [DOI] [PubMed] [Google Scholar]
- 8.Ginsberg H. N., Le N. A., Gilbert H. S. 1986. Altered high density lipoprotein metabolism in patients with myeloproliferative disorders and hypocholesterolemia. Metabolism. 35: 878–882 [DOI] [PubMed] [Google Scholar]
- 9.Tosi M. R., Tugnoli V. 2005. Cholesteryl esters in malignancy. Clin. Chim. Acta. 359: 27–45 [DOI] [PubMed] [Google Scholar]
- 10.Khovidhunkit W., Kim M. S., Memon R. A., Shigenaga J. K., Moser A. H., Feingold K. R., Grunfeld C. 2004. Effects of infection and inflammation on lipid and lipoprotein metabolism: mechanisms and consequences to the host. J. Lipid Res. 45: 1169–1196 [DOI] [PubMed] [Google Scholar]
- 11.Beisel W. R. 1975. Metabolic response to infection. Annu. Rev. Med. 26: 9–20 [DOI] [PubMed] [Google Scholar]
- 12.Straub R. H., Cutolo M., Buttgereit F., Pongratz G. 2010. Energy regulation and neuroendocrine-immune control in chronic inflammatory diseases. J. Intern. Med. 267: 543–560 [DOI] [PubMed] [Google Scholar]
- 13.Bentz M. H., Magnette J. 1998. Hypocholesterolemia during the acute phase of an inflammatory reaction of infectious origin. 120 cases. Rev. Med. Interne. 19: 168–172 [DOI] [PubMed] [Google Scholar]
- 14.Feingold K. R., Staprans I., Memon R. A., Moser A. H., Shigenaga J. K., Doerrler W., Dinarello C. A., Grunfeld C. 1992. Endotoxin rapidly induces changes in lipid metabolism that produce hypertriglyceridemia: low doses stimulate hepatic triglyceride production while high doses inhibit clearance. J. Lipid Res. 33: 1765–1776 [PubMed] [Google Scholar]
- 15.Memon R. A., Staprans I., Noor M., Holleran W. M., Uchida Y., Moser A. H., Feingold K. R., Grunfeld C. 2000. Infection and inflammation induce LDL oxidation in vivo. Arterioscler. Thromb. Vasc. Biol. 20: 1536–1542 [DOI] [PubMed] [Google Scholar]
- 16.Haas M. J., Mooradian A. D. 2010. Regulation of high-density lipoprotein by inflammatory cytokines: establishing links between immune dysfunction and cardiovascular disease. Diabetes Metab. Res. Rev. 26: 90–99 [DOI] [PubMed] [Google Scholar]
- 17.Pruzanski W., Stefanski E., de Beer F. C., de Beer M. C., Ravandi A., Kuksis A. 2000. Comparative analysis of lipid composition of normal and acute-phase high density lipoproteins. J. Lipid Res. 41: 1035–1047 [PubMed] [Google Scholar]
- 18.Clifton P. M., Mackinnon A. M., Barter P. J. 1985. Effects of serum amyloid A protein (SAA) on composition, size, and density of high density lipoproteins in subjects with myocardial infarction. J. Lipid Res. 26: 1389–1398 [PubMed] [Google Scholar]
- 19.McGillicuddy F. C., de la Llera Moya M., Hinkle C. C., Joshi M. R., Chiquoine E. H., Billheimer J. T., Rothblat G. H., Reilly M. P. 2009. Inflammation impairs reverse cholesterol transport in vivo. Circulation. 119: 1135–1145 [DOI] [PMC free article] [PubMed] [Google Scholar]
- 20.Lehr H. A., Sagban T. A., Ihling C., Zahringer U., Hungerer K. D., Blumrich M., Reifenberg K., Bhakdi S. 2001. Immunopathogenesis of atherosclerosis: endotoxin accelerates atherosclerosis in rabbits on hypercholesterolemic diet. Circulation. 104: 914–920 [DOI] [PubMed] [Google Scholar]
- 21.Rupprecht H. J., Blankenberg S., Bickel C., Rippin G., Hafner G., Prellwitz W., Schlumberger W., Meyer J. 2001. Impact of viral and bacterial infectious burden on long-term prognosis in patients with coronary artery disease. Circulation. 104: 25–31 [DOI] [PubMed] [Google Scholar]
- 22.Stoll L. L., Denning G. M., Weintraub N. L. 2004. Potential role of endotoxin as a proinflammatory mediator of atherosclerosis. Arterioscler. Thromb. Vasc. Biol. 24: 2227–2236 [DOI] [PubMed] [Google Scholar]
- 23.Beck J., Garcia R., Heiss G., Vokonas P. S., Offenbacher S. 1996. Periodontal disease and cardiovascular disease. J. Periodontol. 67: 1123–1137 [DOI] [PubMed] [Google Scholar]
- 24.Söder P. O., Söder B., Nowak J., Jogestrand T. 2005. Early carotid atherosclerosis in subjects with periodontal diseases. Stroke. 36: 1195–1200 [DOI] [PubMed] [Google Scholar]
- 25.Blankenberg S., Rupprecht H. J., Bickel C., Espinola-Klein C., Rippin G., Hafner G., Ossendorf M., Steinhagen K., Meyer J. 2001. Cytomegalovirus infection with interleukin-6 response predicts cardiac mortality in patients with coronary artery disease. Circulation. 103: 2915–2921 [DOI] [PubMed] [Google Scholar]
- 26.Corrado E., Rizzo M., Tantillo R., Muratori I., Bonura F., Vitale G., Novo S. 2006. Markers of inflammation and infection influence the outcome of patients with baseline asymptomatic carotid lesions: a 5-year follow-up study. Stroke. 37: 482–486 [DOI] [PubMed] [Google Scholar]
- 27.Imler J. L., Zheng L. 2004. Biology of Toll receptors: lessons from insects and mammals. J. Leukoc. Biol. 75: 18–26 [DOI] [PubMed] [Google Scholar]
- 28.Matsumoto A., Naito M., Itakura H., Ikemoto S., Asaoka H., Hayakawa I., Kanamori H., Aburatani H., Takaku F., Suzuki H., et al. 1990. Human macrophage scavenger receptors: primary structure, expression, and localization in atherosclerotic lesions. Proc. Natl. Acad. Sci. USA. 87: 9133–9137 [DOI] [PMC free article] [PubMed] [Google Scholar]
- 29.Murphy J. E., Tedbury P. R., Homer-Vanniasinkam S., Walker J. H., Ponnambalam S. 2005. Biochemistry and cell biology of mammalian scavenger receptors. Atherosclerosis. 182: 1–15 [DOI] [PubMed] [Google Scholar]
- 30.Eisenberg S. 1984. High density lipoprotein metabolism. J. Lipid Res. 25: 1017–1058 [PubMed] [Google Scholar]
- 31.Fielding C. J., Fielding P. E. 1995. Molecular physiology of reverse cholesterol transport. J. Lipid Res. 36: 211–228 [PubMed] [Google Scholar]
- 32.Li L., Pownall H. J. 2001. Effects of high-density lipoprotein (2) on cholesterol transport and acyl-coenzyme A:cholesterol acyltransferase activity in P388D1 macrophages. Biochim. Biophys. Acta. 1530: 111–122 [DOI] [PubMed] [Google Scholar]
- 33.Millican S. A., Bagga M., Eddy R., Mitchinson M. J., Hunt J. V. 1997. Effect of glucose-mediated LDL oxidation on the P388D1 macrophage-like cell line. Atherosclerosis. 129: 17–25 [DOI] [PubMed] [Google Scholar]
- 34.Glaser K. B., Asmis R., Dennis E. A. 1990. Bacterial lipopolysaccharide priming of P388D1 macrophage-like cells for enhanced arachidonic acid metabolism. Platelet-activating factor receptor activation and regulation of phospholipase A2. J. Biol. Chem. 265: 8658–8664 [PubMed] [Google Scholar]
- 35.Li J., Ye L., Cook D. R., Wang X., Liu J., Kolson D. L., Persidsky Y., Ho W. Z. 2011. Soybean-derived Bowman-Birk inhibitor inhibits neurotoxicity of LPS-activated macrophages. J. Neuroinflammation. 8: 15. [DOI] [PMC free article] [PubMed] [Google Scholar]
- 36.Conti M., Sanna F., Farci G. A., Uda S., Porcu G., Collu M., Bonatesta R. R., Batetta B. 2010. Abnormal macrophage response to microbial stimulus in a 43-year-old man with a severe form of atherosclerosis: a case report. J. Med. Case Rep. 4: 183. [DOI] [PMC free article] [PubMed] [Google Scholar]
- 37.Caroleo M. C., Costa N., Bracci-Laudiero L., Aloe L. 2001. Human monocyte/macrophages activate by exposure to LPS overexpress NGF and NGF receptors. J. Neuroimmunol. 113: 193–201 [DOI] [PubMed] [Google Scholar]
- 38.Fulghesu A. M., Sanna F., Uda S., Magnini R., Portoghese E., Batetta B. 2011. IL-6 serum levels and production is related to an altered immune response in polycystic ovary syndrome girls with insulin resistance. Mediators Inflamm. 2011: 389317. [DOI] [PMC free article] [PubMed] [Google Scholar]
- 39.Schildberger A., Rossmanith E., Eichhorn T., Strassl K., Weber V. 2013. Monocytes, peripheral blood mononuclear cells, and THP-1 cells exhibit different cytokine expression patterns following stimulation with lipopolysaccharide. Mediators Inflamm. 2013: 697972. [DOI] [PMC free article] [PubMed] [Google Scholar]
- 40.Folch J., Lees M., Sloane Stanley G. H. 1957. A simple method for the isolation and purification of total lipides from animal tissues. J. Biol. Chem. 226: 497–509 [PubMed] [Google Scholar]
- 41.Lowry O. H., Rosebrough N. J., Farr A. L., Randall R. J. 1951. Protein measurement with the Folin phenol reagent. J. Biol. Chem. 193: 265–275 [PubMed] [Google Scholar]
- 42.Angioni E., Lercker G., Frega N. G., Carta G., Melis M. P., Murru E., Spada S., Banni S. 2002. UV spectral properties of lipids as a tool for their identification. Eur. J. Lipid Sci. Technol. 104: 59–64 [Google Scholar]
- 43.Banni S., Carta G., Contini M. S., Angioni E., Deiana M., Dessì M. A., Melis M. P., Corongiu F. P. 1996. Characterization of conjugated diene fatty acids in milk, dairy products, and lamb tissues. J. Nutr. Biochem. 7: 150–155 [Google Scholar]
- 44.Cullen P., Fobker M., Tegelkamp K., Meyer K., Kannenberg F., Cignarella A., Benninghoven A., Assmann G. 1997. An improved method for quantification of cholesterol and cholesteryl esters in human monocyte-derived macrophages by high performance liquid chromatography with identification of unassigned cholesteryl ester species by means of secondary ion mass spectrometry. J. Lipid Res. 38: 401–409 [PubMed] [Google Scholar]
- 45.Banni S., Angioni E., Contini M. S., Carta G., Casu V., Iengo G. A., Melis M. P., Deiana M., Dessì M. A., Corongiu F. P. 1998. Conjugated linoleic acid and oxidative stress. J. Am. Oil Chem. Soc. 75: 261–267 [Google Scholar]
- 46.Diaz G., Batetta B., Sanna F., Uda S., Reali C., Angius F., Melis M., Falchi A. M. 2008. Lipid droplet changes in proliferating and quiescent 3T3 fibroblasts. Histochem. Cell Biol. 129: 611–621 [DOI] [PubMed] [Google Scholar]
- 47.Greenspan P., Fowler S. D. 1985. Spectrofluorometric studies of the lipid probe, nile red. J. Lipid Res. 26: 781–789 [PubMed] [Google Scholar]
- 48.Stephan Z. F., Yurachek E. C. 1993. Rapid fluorometric assay of LDL receptor activity by DiI-labeled LDL. J. Lipid Res. 34: 325–330 [PubMed] [Google Scholar]
- 49.Pagler T. A., Golsabahi S., Doringer M., Rhode S., Schutz G. J., Pavelka M., Wadsack C., Gauster M., Lohninger A., Laggner H., et al. 2006. A Chinese hamster ovarian cell line imports cholesterol by high density lipoprotein degradation. J. Biol. Chem. 281: 38159–38171 [DOI] [PubMed] [Google Scholar]
- 50.Smith P. K., Krohn R. I., Hermanson G. T., Mallia A. K., Gartner F. H., Provenzano M. D., Fujimoto E. K., Goeke N. M., Olson B. J., Klenk D. C. 1985. Measurement of protein using bicinchoninic acid. Anal. Biochem. 150: 76–85 [DOI] [PubMed] [Google Scholar]
- 51.Uda S., Accossu S., Spolitu S., Collu M., Angius F., Sanna F., Banni S., Vacca C., Murru E., Mulas C., et al. 2012. A lipoprotein source of cholesteryl esters is essential for proliferation of CEM-CCRF lymphoblastic cell line. Tumour Biol. 33: 443–453 [DOI] [PubMed] [Google Scholar]
- 52.Sanna F., Bonatesta R. R., Frongia B., Uda S., Banni S., Melis M. P., Collu M., Madeddu C., Serpe R., Puddu S., et al. 2007. Production of inflammatory molecules in peripheral blood mononuclear cells from severely glucose-6-phosphate dehydrogenase-deficient subjects. J. Vasc. Res. 44: 253–263 [DOI] [PubMed] [Google Scholar]
- 53.Li Y., Schwabe R. F., DeVries-Seimon T., Yao P. M., Gerbod-Giannone M. C., Tall A. R., Davis R. J., Flavell R., Brenner D. A., Tabas I. 2005. Free cholesterol-loaded macrophages are an abundant source of tumor necrosis factor-alpha and interleukin-6: model of NF-kappaB- and map kinase-dependent inflammation in advanced atherosclerosis. J. Biol. Chem. 280: 21763–21772 [DOI] [PubMed] [Google Scholar]
- 54.Duong M., Petit J. M., Martha B., Galland F., Piroth L., Walldner A., Grappin M., Buisson M., Duvillard L., Chavanet P., et al. 2006. Concentration of circulating oxidized LDL in HIV-infected patients treated with antiretroviral agents: relation to HIV-related lipodystrophy. HIV Clin. Trials. 7: 41–47 [DOI] [PubMed] [Google Scholar]
- 55.Liuba P., Persson J., Luoma J., Yla-Herttuala S., Pesonen E. 2003. Acute infections in children are accompanied by oxidative modification of LDL and decrease of HDL cholesterol, and are followed by thickening of carotid intima-media. Eur. Heart J. 24: 515–521 [DOI] [PubMed] [Google Scholar]
- 56.Nakamura T., Shibata N., Nishimoto-Shibata T., Feng D., Ikemoto M., Motojima K., Iso O. N., Tsukamoto K., Tsujimoto M., Arai H. 2005. Regulation of SR-BI protein levels by phosphorylation of its associated protein, PDZK1. Proc. Natl. Acad. Sci. USA. 102: 13404–13409 [DOI] [PMC free article] [PubMed] [Google Scholar]
- 57.Murao K., Imachi H., Cao W., Yu X., Li J., Yoshida K., Ahmed R. A., Matsumoto K., Nishiuchi T., Wong N. C., et al. 2006. High-density lipoprotein is a potential growth factor for adrenocortical cells. Biochem. Biophys. Res. Commun. 344: 226–232 [DOI] [PubMed] [Google Scholar]
- 58.Pussinen P. J., Karten B., Wintersperger A., Reicher H., McLean M., Malle E., Sattler W. 2000. The human breast carcinoma cell line HBL-100 acquires exogenous cholesterol from high-density lipoprotein via CLA-1 (CD-36 and LIMPII analogous 1)-mediated selective cholesteryl ester uptake. Biochem. J. 349: 559–566 [DOI] [PMC free article] [PubMed] [Google Scholar]
- 59.Wadsack C., Hirschmugl B., Hammer A., Levak-Frank S., Kozarsky K. F., Sattler W., Malle E. 2003. Scavenger receptor class B, type I on non-malignant and malignant human epithelial cells mediates cholesteryl ester-uptake from high density lipoproteins. Int. J. Biochem. Cell Biol. 35: 441–454 [DOI] [PubMed] [Google Scholar]
- 60.Smith J. D. 2010. Myeloperoxidase, inflammation, and dysfunctional high-density lipoprotein. J. Clin. Lipidol. 4: 382–388 [DOI] [PMC free article] [PubMed] [Google Scholar]
- 61.Tabas I. 2002. Consequences of cellular cholesterol accumulation: basic concepts and physiological implications. J. Clin. Invest. 110: 905–911 [DOI] [PMC free article] [PubMed] [Google Scholar]
- 62.Meuwese M. C., de Groot E., Duivenvoorden R., Trip M. D., Ose L., Maritz F. J., Basart D. C., Kastelein J. J., Habib R., Davidson M. H., et al. 2009. ACAT inhibition and progression of carotid atherosclerosis in patients with familial hypercholesterolemia: the CAPTIVATE randomized trial. JAMA. 301: 1131–1139 [DOI] [PubMed] [Google Scholar]
- 63.Abeywardena M. Y., Leifert W. R., Warnes K. E., Varghese J. N., Head R. J. 2009. Cardiovascular biology of interleukin-6. Curr. Pharm. Des. 15: 1809–1821 [DOI] [PubMed] [Google Scholar]
- 64.Brasier A. R. 2010. The nuclear factor-kappaB-interleukin-6 signalling pathway mediating vascular inflammation. Cardiovasc. Res. 86: 211–218 [DOI] [PMC free article] [PubMed] [Google Scholar]
- 65.Casas J. P., Shah T., Hingorani A. D., Danesh J., Pepys M. B. 2008. C-reactive protein and coronary heart disease: a critical review. J. Intern. Med. 264: 295–314 [DOI] [PubMed] [Google Scholar]
- 66.Andrés V., Pello O. M., Silvestre-Roig C. 2012. Macrophage proliferation and apoptosis in atherosclerosis. Curr. Opin. Lipidol. 23: 429–438 [DOI] [PubMed] [Google Scholar]
Associated Data
This section collects any data citations, data availability statements, or supplementary materials included in this article.


