

Abstract
Indole is a bacterial signalling molecule that blocks E. coli cell division at concentrations of 3–5 mM. We have shown that indole is a proton ionophore and that this activity is key to the inhibition of division. By reducing the electrochemical potential across the cytoplasmic membrane of E. coli, indole deactivates MinCD oscillation and prevents formation of the FtsZ ring that is a prerequisite for division. This is the first example of a natural ionophore regulating a key biological process. Our findings have implications for our understanding of membrane biology, bacterial cell cycle control and potentially for the design of antibiotics that target the cell membrane.
Keywords: Membrane potential, Proton ionophore, Indole, Bacteria, Cell division, Escherichia coli
Highlights
► Indole induces charge transport across reconstituted lipid membranes. ► Indole reduces the E. coli membrane potential. ► Membrane potential is required for the formation of the macromolecular divisome. ► Indole blocks the formation of the macromolecular divisome. ► Indole reversibly blocks Escherichia coli cell division.
1. Introduction
Indole is an aromatic heterocycle produced by over 85 species of Gram-positive and Gram-negative bacteria with multiple and diverse roles in bacterial signalling [1]. In addition to regulating the transition from exponential to stationary phase [2], biofilm formation [3] and responses to virulence and stress [4], it has also been shown to mediate signalling between enteric bacteria and their mammalian host [5]. Recently indole has been found to inhibit Escherichia coli cell division as part of a cell cycle checkpoint triggered by the accumulation of plasmid dimers [6,7]. Plasmid dimers produce a regulatory RNA (Rcd) that stimulates indole synthesis by the enzyme tryptophanase, but the mechanism by which indole prevents cell division was unknown. A link between membrane potential and cell division has been reported previously [8] and ionophores such as carbonyl cyanide m-chloro phenyl hydrazine (CCCP) block cell division by dissipating the proton motive force (PMF) [9]. Here we show that a previously unrecognised property of indole, its action as an ionophore, decreases the PMF across the E. coli cytoplasmic membrane and hence inhibits cell division.
2. Materials and methods
2.1. The expression of fluorescent proteins
E. coli BW25113ΔtnaA was obtained from the Keio collection [10] and E. coli W3110ΔtnaA [7] was derived from this strain by P1 transduction. Cells were cultured in Luria Bertani (LB) liquid medium at 37 °C. Kanamycin (30 μg ml− 1) was added to overnight cultures. Overnight cultures were diluted for use to OD600 = 0.03 (approx.) in 20 ml of LB. When required, indole (in ethanol) or CCCP (in DMSO) were added when the culture reached OD600 = 0.1–0.2. The final concentration of ethanol in the samples containing indole, and in the indole-free control, was 1.0% (v/v). The maximum final concentration of DMSO was 0.1% (v/v). Plasmids used for the expression of fluorescent proteins were: pCP8 (also known as pWX3∆; PftsKi-ftsZ-cfp [11]), pHJS101 (Para-sf-gfp-ftsA [8]) and pFX9 (Plac-gfp-minD minE [12]).
2.2. Fluorescence microscopy
For microscopy, cells were immobilised on a thin film of 1% agarose in phosphate buffered saline (Fig. 2) or minimal salts with 1% glucose (Fig. 1), containing indole (5 mM) when required. A Nikon Eclipse 80i microscope equipped with a 100× CFI Plan Fluor objective was used for phase contrast visualisation. NIS-elements F 3.0 software (Nikon) was used for image acquisition.
Fig. 2.

Indole-dependent delocalisation of FtsZ, FtsA and MinD. Panel (a) shows paired images (phase contrast and fluorescence) in the presence and absence of indole (5 mM). Panel (b) shows enlargements of representative cells (fluorescence only). Fluorescent proteins were expressed from plasmids pCP8 (PftsKi-FtsZ-CFP), pHJS101 (Para-sfGFP-FtsA) and pFX9 (Plac-GFP-MinD MinE). Size bar represents 5 μm.
Fig. 1.

Indole reversibly inhibits growth and division of E. coli. E. coli BW25113 ΔtnaA growing in LB at 37 °C was incubated with 5 mM indole for 2 h. Culture samples were immobilised at room temperature on agarose-coated slides without indole (panel a) or containing 5 mM indole (panel b). Cells were observed by phase contrast microscopy over the next 4 h. Size bar represents 10 μM.
2.3. Electrophysiology
Artificial lipid bilayers made of E. coli total lipid extract (Avanti Polar Lipid) were reconstituted in the round aperture (90 μm diameter) of a Teflon foil, using the Montal–Mueller technique [13,14]. A 1% (v/v) hexadecane solution was used to paint the Teflon foil before bilayer formation. The chambers encompassing the Teflon foil were first filled with aqueous solution (100 mM KCl, pH 7) then 5 μl E. coli total lipid extract (5 mg ml− 1 in pentane) was spread on the surface of the water in the compartments to allow the lipid bilayer to form. The pH of the solutions was controlled using 15 mM potassium phosphate (PB) in acidic or basic form (KH2PO4/K2HPO4, respectively). To establish a pH gradient, the pH was adjusted using 10% HCl or KOH. The current–voltage (IV) characteristics of the lipid bilayer were measured in the range ± 50 mV. The applied voltage was varied in steps of 10 mV and the current was recorded for 10 s. A Gaussian fit was made to the histogram of the current trace and the average value of the current determined. A linear fit was applied to the IV curve and the ionic conductance through each bilayer is given by the gradient of the linear fit. The capacitance of the lipid bilayer was determined prior to the measurement of the IV characteristic. By convention the chamber of the lipid bilayer where the ground electrode of the amplifier is located was denoted as cis and the one containing the live electrode was denoted as trans.
2.4. Flow cytometry
For in vivo measurement of membrane polarity W3110ΔtnaA cells were grown in broth culture to OD600 = 0.2 (approx.). When required, indole (in ethanol) or CCCP (in DMSO) were added to samples before the addition of 10 μM oxonol VI (in ethanol). The final concentration of ethanol in the samples containing indole, and in the indole-free control, was 1.5% (v/v). The maximum final concentration of DMSO was 0.1% (v/v). Samples were incubated for 10 min before the addition of formaldehyde (1% w/v). Flow cytometry was performed on a Cytek DxP8 FACScan (Cytek). Fluorescence was excited by a 100 mW laser at 561 nm and measured through a 615 nm emission filter of 25 nm width. For each sample, 50,000 events were collected at a rate between 1000 and 2000 events per second. Data were collected and analysed using FlowJo 7.6.4 (Tree Star Inc.). Each sample was first gated by front and side-scatter values to exclude the 3–5% of cells furthest from the median. The remainder were gated by fluorescence value to remove the 1–2% of the population that were obviously undyed (identifiable by their negative fluorescence value). In the data presented, a further 1–2% of cells are likely to be undyed but show a low positive fluorescence due to instrument noise.
3. Results
When 5 mM indole is added to a broth culture of E. coli, cell division is abolished immediately. The non-dividing cells continue to grow slowly for up to 2 h, approximately doubling in size [7]. To investigate whether indole inhibition of cell division is reversible, 5 mM indole was added to E. coli BW25113 ΔtnaA growing exponentially at 37 °C (extra-cellular and intra-cellular indole concentrations equilibrate rapidly in this strain [7]). After a further 2 h incubation, culture samples were transferred to agarose-coated slides, with or without indole (5 mM), for microscopic observation. Cells on indole-free agarose (Fig. 1a) resumed growth and division after a lag of approximately 1 h, while on indole-containing agarose (Fig. 1b) cells neither grew nor divided for at least 4 h.
Bacterial cell division begins with the assembly of the macromolecular divisome complex. In E. coli the tubulin homologue FtsZ [15], assisted by FtsA [16], polymerises into a ring structure at mid-cell, defining the eventual site of division. We investigated the effect of indole on the localisation of fluorescently-tagged FtsZ and FtsA in E. coli BW25113 ΔtnaA. Indole (5 mM) was added to a culture of exponentially-growing cells and incubation was continued at 37 °C for 2 h before culture samples were immobilised on agarose-coated slides (5 mM indole) for observation. Parallel observations were made of a control culture without indole. In the absence of indole FtsZ localised at the mid-point of cells as the cell cycle progressed. However, in cells that had been exposed to indole, FtsZ fluorescence was distributed uniformly throughout the cytoplasm (Fig. 2; Supplementary Fig. 1). The septum-associated protein, FtsA, normally localises to the mid-cell in an FtsZ-dependent manner [17]. In the presence of indole FtsA became delocalised from the mid-point and was present in foci distributed throughout the cell (Fig. 2; Supplementary Fig. 2).
The Min site-selection system is a primary determinant of FtsZ spatial distribution [18]. We therefore explored the effect of indole on the localisation of GFP-MinD. Samples from a culture of E. coli BW25113 ΔtnaA growing exponentially at 37 °C were immobilised on agarose-coated slides, with or without indole (5 mM). In the absence of indole, MinD oscillated between the cell poles with a period of approximately 20 s. On indole-containing slides MinD no longer oscillated but was localised in foci distributed throughout the cell (Fig. 2, Supplementary Fig. 3, Supplementary movies 1–3). The response of MinD to indole was complete within the 2 min required to immobilise cells for observation.
While speculating on the mechanism by which indole inhibits E. coli cell division, we were intrigued by a report that division of both E. coli and B. subtilis requires the maintenance of an electrical potential difference across the cytoplasmic membrane [8]. Dissipation of the electrical potential by the proton ionophore CCCP [19] stops MinD oscillation, disrupting FtsZ ring formation at mid-cell and preventing division. It has been shown that maintenance of the electrical potential is required for efficient binding of the C-terminal amphipathic helix of MinD to the lipid membrane [8]. We also noted that 30 years ago indole had been found to uncouple mitochondrial oxidative phosphorylation [20]. Both mitochondrial uncoupling and the E. coli cell division block could be explained if indole acts as an ionophore, conducting ions across a lipid membrane.
A standard electrophysiology approach was used to investigate the effect of indole on a bilayer reconstituted from E. coli total lipid extract. The apparatus consisted of two chambers (cis and trans) each containing buffer (pH 7.0) and an electrode. The chambers were connected by an aperture (diameter 90 μm), across which the lipid bilayer was established. The ionic conductance of the bilayer, determined from the slope of the current–voltage (IV) curves, was plotted against the indole concentration (Fig. 3a, b; Supplementary Fig. 4). Increasing the indole concentration over the range 0–5 mM changed the bilayer conductance from ~ 2 pS to ~ 18 pS. CCCP was used as a positive control and, over the range 0–250 nM, it increased conductance from ~ 2 pS to ~ 27 pS. As a negative control, ionic conductance was measured in the presence of indole-3-acetic acid (IAA). IAA had no effect on conductance over the range 0–5 mM. The effect of indole on bilayer conductance was reversible, confirming that membrane integrity was not affected by indole treatment (Supplementary Fig. 5).
Fig. 3.
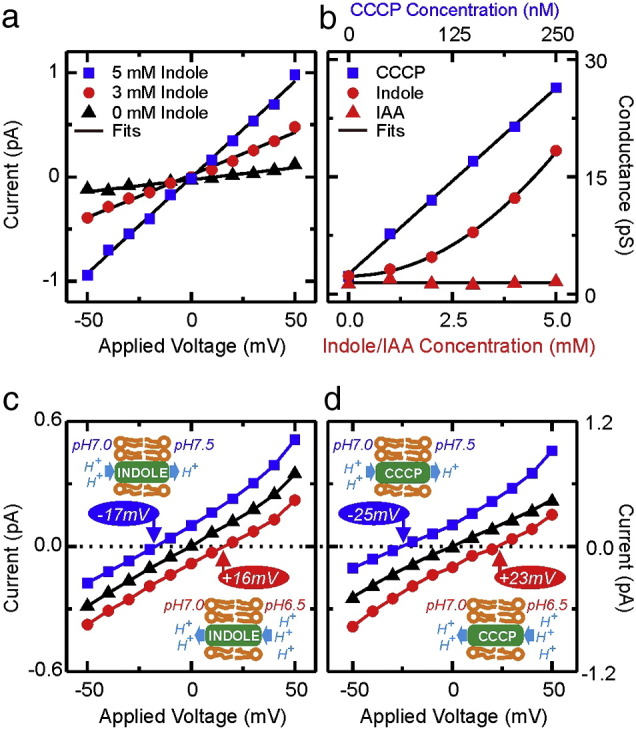
Indole facilitates the transport of ions across artificially reconstituted lipid membranes. Panel a: The IV characteristics of an E. coli lipid membrane (100 mM KCl, pH 7.0 in PB) in the presence of indole (cis and trans chambers). Lines represent linear fits to the data. Panel b: The ionic conductance, calculated from the slope of the IV characteristic, as a function of the concentration of cyanide-m-chlorophenylhydrazone (CCCP), indole and indole 3-acetic acid (IAA). Representative titration experiments for CCCP, indole and IAA are shown. A linear fit is shown for the CCCP and IAA data while a quadratic fit (Eq. (1)) is shown for indole. Each experiment was repeated at least 4 times (Supplementary Fig. 4). Panels c and d: The effect of a pH gradient on the IV characteristics of an E. coli lipid membrane in the presence of 2.5 mM indole (panel c) or 50 nM CCCP (panel d). The trans chamber is held at pH 7.0 while the pH in the cis chamber is varied. Symbols denote the pH on either side of the membrane (− −) 7.0-7.0, (−
 −) 7.0-6.5, (−
 −) 7.0–7.5. Experiments were conducted at room temperature (21 °C).
Curve fitting to the conductance–concentration plots (Fig. 3b) showed that while membrane conductance increased linearly with the CCCP concentration [21,22], the dependence on the indole concentration was quadratic. This type of dependence has been discussed previously [23–26] and is explained by a model in which shuttling of the charged species depends upon the formation of a carrier dimer. Here the carrier is indole, denoted as [IH], and we speculate that the dimer shuttling charge across the lipid membrane might be [I2H]-. The ionic conductance of the lipid bilayer as function of indole concentration is then predicted by:
| (1) |
where c is the indole concentration, K(c) is the ionic conductance through the lipid bilayer as a function of indole concentration, K0 is the leakage conductance through the lipid bilayer in the absence of indole and α is a proportionality constant independent of the indole concentration. When the dependence of conductance on the indole concentration (Fig. 3b) is fitted with Eq. (1), an experimental fitting parameter of R2 = 0.99904 is obtained.
In the initial experiments (Fig. 3a, b) the pH of both chambers was 7.0. In subsequent experiments the pH of the trans chamber was retained at 7.0 while the pH in the cis chamber was either increased to 7.5 by addition of KOH or reduced to 6.5 by the addition of HCl. The membrane IV characteristic was determined in the presence of CCCP (50 nM) or indole (2.5 mM) (Fig. 3c, d). In both cases when a pH gradient existed across the membrane a current was detected in the absence of an applied voltage. Formally this could be due to positive charges moving from low pH to the high pH, or to negative charges moving in the opposite direction. A voltage (− 50 mV to + 50 mV) was applied across the lipid bilayer and the value required to reduce the current to zero was noted. In the presence of indole an applied voltage of 33 mV per pH unit was required, while in the presence of CCCP the average voltage was 48 mV per pH unit (Fig. 3c, d).
The theoretical model that predicts the quadratic dependence of the lipid bilayer conductance on the indole concentration [23–26] gives the following relationship between the pH gradient and the voltage required to abolish current flow:
| (2) |
where V is the trans-membrane voltage due to the pH gradient, R is the gas constant, T is absolute temperature, F is the Faraday constant and [H+]1, [H+]2 are the proton concentrations on the cis and trans sides of the electrophysiology chamber.
Eq. (2) predicts a trans-membrane voltage of 58.4 mV per pH unit at 21 °C, irrespective of the ionophore. There is a significant difference between the theoretical prediction and the measured values for indole and CCCP (33 and 48 mV per pH unit, respectively). This is because, in the presence of 2.5 mM indole or 50 nM CCCP the leakage ionic conductance of the lipid bilayer, representing the ions that pass the lipid bilayer not being carried by the ionophore, is not negligible compared to the ionophore induced conductance [19]. In brief, the leakage conductance creates a voltage divider and thus reduces the measured trans-membrane voltage (Vm) as given by [19]:
| (3) |
Here the terms of the equation are the same as previously defined in Eq. (1) and Eq. (2).
In the presence of 2.5 mM indole (Fig. 3c, d) the lipid bilayer conductance is 6.0 pS while the leakage conductance in the absence of the ionophore is 2.1 pS. Thus Eq. (3) predicts a measured trans-membrane potential of 38 mV per pH unit that is close to the measured experimental value of 33 mV per pH unit. In the case of 50 nM CCCP, the membrane conductance is 9.0 pS while the leakage conductance 1.6 pS. Thus Eq. (3) predicts a trans-membrane voltage of 48 mV per pH unit in very good agreement with the experimentally measured value.
To ascertain whether indole acts as an ionophore in vivo, we used flow cytometry to observe the effect of indole on binding of the fluorescent dye oxonol VI to E. coli cells. Oxonol VI is an anionic dye that binds lipid membranes, with a greater affinity for depolarised membranes [27]. Thus permeabilisation of the cytoplasmic membrane by an ionophore should increase oxonol VI binding and cell fluorescence. The fluorescence intensity increased noticeably at 3 mM indole and above (Fig. 4a and Supplementary Fig. 6). Cells treated with 5 mM indole showed a 2.5-fold increase in median fluorescence intensity, compared with untreated cells. This was similar to the effect of CCCP (10–50 μM) that was used as a positive control (Fig. 4b).
Fig. 4.

Indole depolarises the E. coli membrane in a concentration-dependent manner. E. coli W3110ΔtnaA was treated with the lipophilic dye Oxonol VI in the presence of indole (0–5 mM). Cells were observed for fluorescence by flow cytometry (panel a) and the median value of each sample plotted against indole concentration (panel b). Data presented are from a single representative experiment (see Supplementary Material Fig. 6 for biological repeats).
4. Discussion
In summary, our data suggest that the action of indole as an ionophore is responsible for its inhibition of cell division. Depolarisation of the cytoplasmic membrane inactivates the Min site selection system, preventing the localisation of FtsZ and the formation of the divisome complex. We have noted previously [6] that although indole has little effect on E. coli up to 2–3 mM, severe inhibition of growth and cell division appears suddenly over the 3–5 mM range. The non-linearity of this response may be explained by the quadratic dependence of membrane conductance on the indole concentration.
It is known that indole is capable of diffusing through a lipid membrane [7] but here we show that the membrane itself is a target of indole action. Biological ionophores are well known but they are normally toxic to cells. Thus the plasmid-encoded colicins A, E1, Ia, Ib, and K form ion-permeable channels in the bacterial cytoplasmic membrane leading to cell death [28]. Similarly the antibiotics nigericin [29] and valinomycin [30], produced by Streptomyces species, facilitate ion transport across the cytoplasmic membrane, dissipating the pH and electrical potentials, respectively. The novelty of indole as an ionophore is that it directly benefits the producer cell.
Cell cycle arrest is a common response of eukaryotic [31] and prokaryotic [32] cells to DNA damage. Circular DNA molecules, common in bacteria, suffer a unique form of recombinational damage to which their linear counterparts are immune. While the recombination between linear replicons does not compromise their independence, recombination between DNA circles forms a dimer in which they are joined covalently. One response to recombinational damage of circular plasmids in E. coli is the arrest of cell division [33] and this has been shown to correlate with the up-regulation of indole production [6].
Indole increases the survival of bacteria under antibiotic stress, and indole production is stimulated by exposure to antibiotics, including ampicillin and kanamycin [34]. It is generally accepted that indole protects bacteria against antibiotics by inducing multidrug exporter genes [35]. However, the ionophore property of indole may provide an additional protection mechanism. The uptake of aminoglycoside antibiotics (e.g. tetracycline) is energised by the PMF across the cytoplasmic membrane [36,37]. Reduction of the PMF by indole should prevent, or at least reduce, the uptake of antibiotics that use this mechanism. It is also possible that intracellular indole concentrations of several millimolars have biologically significant effects on enzyme activity and protein–protein interactions. This possibility is under active investigation in the authors' laboratories.
A clear distinction between indole and CCCP is that the latter is effective as an ionophore at a 104-fold lower concentration than indole. One millimolar indole was required to increase membrane conductance by an average of 47% (Supplementary Fig. 4). Typical supernatant concentrations of indole in stationary phase culture of E. coli are only 0.3–0.7 mM [6,38] but there is reason to believe that millimolar concentrations of indole may be a reality in the natural environment, especially under stress conditions. It has been reported that E. coli in broth culture produces elevated levels of indole in response to antibiotic or heat stress [34] and an intracellular indole concentration of 1.7 mM has been reported in a strain where plasmid multimerisation is up-regulated [6]. Typically experiments measuring indole production are performed in broth culture when secreted indole is rapidly dispersed and diluted. In diffusion-limited environments such as the mammalian gut [5], or where bacteria grow as colonies or as biofilms on a solid substrate, secreted indole will remain associated with the producer cells giving higher local concentrations. Furthermore, we would expect quantitative variation in the effect of indole on membranes with differing lipid composition and it is interesting to note that while more than 3 mM indole is required to inhibit growth and division of laboratory strains of E. coli, as little as 0.5 mM has been shown to uncouple oxidative phosphorylation in rat liver mitochondria [20] and 1 mM indole induces potentially beneficial changes in human intestinal epithelial cells in vitro [5].
Finally, one of the most remarkable aspects of indole signalling is its universality. Bacteria use indole to signal to themselves, to other bacterial species and even to their mammalian host [1]. Our discovery that indole is an ionophore provides a signalling mechanism that is applicable to all living cells.
Acknowledgments
We thank H. Strahl and W. Hamoen for supplying plasmids and D. Sherratt for assisting with fluorescence microscopy. SP, DS and CF were supported by a research grant from the BBSRC (UK). C.C. and U.F.K. were supported by an Emmy Noether grant of the Deutsche Forschungsgemeinschaft and an ERC starting grant, respectively.
Footnotes
Supplementary data to this article can be found online at doi:10.1016/j.bbamem.2012.02.022.
Appendix A. Supplementary data
Supplementary materials
The movie shows the oscillation of MinD between the poles of E. coli in the absence of indole. Fluorescent protein was expressed from plasmid pFX9 (Plac-GFP-MinD MinE) in all three supplementary movies. The movie represents 261.2 s (real time) and is composed of 76 frames. The scale bar represents 5 μm.
The movie shows the absence of MinD oscillation between the poles of the E. coli in the presence of 5 mM indole. The movie represents 130.5 s (real time) and is composed of 34 frames. The scale bar represents 5 μm.
The movie, like supplementary movie 2, shows the absence of MinD oscillation between the poles of the E. coli in the presence of 5 mM indole. The movie represents 87 s (real time) and is composed of 23 frames. The scale bar represents 5 μm.
References
- 1.Lee J.-H., Lee J. Indole as an intercellular signal in microbial communities. FEMS Microbiol. Rev. 2010;34:426–444. doi: 10.1111/j.1574-6976.2009.00204.x. [DOI] [PubMed] [Google Scholar]
- 2.Lelong C., Aguiluz K., Luche S., Kuhn L., Garin J., Rabilloud T., Geiselmann J. The Crl-RpoS regulon of Escherichia coli. Mol. Cell. Proteomics. 2007;6:648–659. doi: 10.1074/mcp.M600191-MCP200. [DOI] [PubMed] [Google Scholar]
- 3.Di Martino P., Fursy R., Bret L., Sundararaju B., Phillips R.S. Indole can act as an extracellular signal to regulate biofilm formation of Escherichia coli and other indole-producing bacteria. Can. J. Microbiol. 2003;49:443–449. doi: 10.1139/w03-056. [DOI] [PubMed] [Google Scholar]
- 4.Hirakawa H., Kodama T., Takumi-Kobayashi A., Honda T., Yamaguchi A. Secreted indole serves as a signal for expression of type III secretion system translocators in enterohaemorrhagic Escherichia coli O157: H7. Microbiology. 2009;155:541–550. doi: 10.1099/mic.0.020420-0. [DOI] [PubMed] [Google Scholar]
- 5.Bansal T., Alaniz R.C., Wood T.K., Jayaraman A. The bacterial signal indole increases epithelial-cell tight-junction resistance and attenuates indicators of inflammation. Proc. Natl. Acad. Sci. U. S. A. 2010;107:228–233. doi: 10.1073/pnas.0906112107. [DOI] [PMC free article] [PubMed] [Google Scholar]
- 6.Chant E.L., Summers D.K. Indole signalling contributes to the stable maintenance of Escherichia coli multicopy plasmids. Mol. Microbiol. 2007;63:35–43. doi: 10.1111/j.1365-2958.2006.05481.x. [DOI] [PubMed] [Google Scholar]
- 7.Pinero-Fernandez S., Chimerel C., Keyser U.F., Summers D.K. Indole transport across Escherichia coli membranes. J. Bacteriol. 2011;193:1793–1798. doi: 10.1128/JB.01477-10. [DOI] [PMC free article] [PubMed] [Google Scholar]
- 8.Strahl H., Hamoen L.W. Membrane potential is important for bacterial cell division. Proc. Natl. Acad. Sci. U. S. A. 2010;107:12281–12286. doi: 10.1073/pnas.1005485107. [DOI] [PMC free article] [PubMed] [Google Scholar]
- 9.Kralj J.M., Hochbaum D.R., Douglass A.D., Cohen A.E. Electrical spiking in Escherichia coli probed with a fluorescent voltage-indicating protein. Science. 2011;333:345–348. doi: 10.1126/science.1204763. [DOI] [PubMed] [Google Scholar]
- 10.Baba T., Ara T., Hasegawa M., Takai Y., Okumura Y., Baba M., Datsenko K.A., Tomita M., Wanner B.L., Mori H. Construction of Escherichia coli K-12 in-frame, single-gene knockout mutants: the Keio collection. Mol. Syst. Biol. 2006;2 doi: 10.1038/msb4100050. Article number: 2006.0008. [DOI] [PMC free article] [PubMed] [Google Scholar]
- 11.Wang X., Possoz C., Sherratt D.J. Dancing around the divisome: asymmetric chromosome segregation in Escherichia coli. Genes Dev. 2005;19:2367–2377. doi: 10.1101/gad.345305. [DOI] [PMC free article] [PubMed] [Google Scholar]
- 12.Shih Y.L., Le T., Rothfield L. Division site selection in Escherichia coli involves dynamic redistribution of min proteins within coiled structures that extend between the two cell poles. Proc. Natl. Acad. Sci. U. S. A. 2003;100:7865–7870. doi: 10.1073/pnas.1232225100. [DOI] [PMC free article] [PubMed] [Google Scholar]
- 13.Montal M., Mueller P. Formation of bimolecular membranes from lipid monolayers and a study of their electrical properties. Proc. Natl. Acad. Sci. U. S. A. 1972;69:3561–3566. doi: 10.1073/pnas.69.12.3561. [DOI] [PMC free article] [PubMed] [Google Scholar]
- 14.Danelon C., Lindemann M., Borin C., Fournier D., Winterhalter M. Channel-forming membrane proteins as molecular sensors. IEEE Trans. Nanobioscience. 2004;3:46–48. doi: 10.1109/tnb.2004.824271. [DOI] [PubMed] [Google Scholar]
- 15.Bi E., Lutkenhaus J. FtsZ ring structure associated with division in Escherichia coli. Nature. 1991;354:161–164. doi: 10.1038/354161a0. [DOI] [PubMed] [Google Scholar]
- 16.Pichoff S., Lutkenhaus J. Unique and overlapping roles for ZipA and FtsA in septal ring assembly in Escherichia coli. EMBO J. 2002;21:685–693. doi: 10.1093/emboj/21.4.685. [DOI] [PMC free article] [PubMed] [Google Scholar]
- 17.Addinall S.G., Lutkenhaus J. FtsA is localized to the septum in an FtsZ-dependent manner. J. Bacteriol. 1996;178:7167–7172. doi: 10.1128/jb.178.24.7167-7172.1996. [DOI] [PMC free article] [PubMed] [Google Scholar]
- 18.Rothfield L., Taghbalout A., Shih Y.-L. Spatial control of bacterial division-site placement. Nat. Rev. Microbiol. 2005;3:959–968. doi: 10.1038/nrmicro1290. [DOI] [PubMed] [Google Scholar]
- 19.LeBlanc O.H., Jr. The effect of uncouplers of oxidative phosphorylation on lipid bilayer membranes: carbonylcyanide m-chlorophenylhydrazone. J. Membr. Biol. 1971;4:227–251. doi: 10.1007/BF02431973. [DOI] [PubMed] [Google Scholar]
- 20.Sakai M., Tohyama K., Mutai M. Effect of indole on adenylate energy charge and mitochondrial phosphorylative activity of rat liver. Int. J. Biochem. 1982;14:569–572. doi: 10.1016/0020-711x(82)90037-4. [DOI] [PubMed] [Google Scholar]
- 21.Kasianowicz J., Benz R., McLaughlin S. The kinetic mechanism by which CCCP (carbonyl cyanide m-chlorophenylhydrazone) transports protons across membranes. J. Membr. Biol. 1984;82:179–190. doi: 10.1007/BF01868942. [DOI] [PubMed] [Google Scholar]
- 22.Hopfer U., Lehninger A.L., Thompson T.E. Protonic conductance across phospholipid bilayer membranes induced by uncoupling agents for oxidative phosphorylation. Proc. Natl. Acad. Sci. U. S. A. 1968;59:484–490. doi: 10.1073/pnas.59.2.484. [DOI] [PMC free article] [PubMed] [Google Scholar]
- 23.Finkelstein A. Weak-acid uncouplers of oxidative phosphorylation. Mechanism of action on thin lipid membranes. Biochim. Biophys. Acta. 1970;205:1–6. doi: 10.1016/0005-2728(70)90055-1. [DOI] [PubMed] [Google Scholar]
- 24.Lea E.J.A., Croghan P.C. The effect of 2,4-dinitrophenol on the properties of thin phospholipid films. J. Membr. Biol. 1969;1:225–237. doi: 10.1007/BF01869783. [DOI] [PubMed] [Google Scholar]
- 25.Borisova M.P., Ermishkin L.N., Liberman E.A. Mechanism of conductivity of bimolecular lipid membranes in the presence of tetrachlorotrifluoromethylbenzimidazole. J. Membr. Biol. 1974;18:243–261. doi: 10.1007/BF01870115. [DOI] [PubMed] [Google Scholar]
- 26.Foster M., McLaughlin S. Complexes between uncouplers of oxidative phosphorylation. J. Membr. Biol. 1974;17:155–180. doi: 10.1007/BF01870177. [DOI] [PubMed] [Google Scholar]
- 27.Lopez-Amoros R., Mason D.J., Lloyd D. Use of two oxonols and a fluorescent tetrazolium dye to monitor starvation of Escherichia coli in seawater by flow cytometry. J. Microbiol. Methods. 1995;22:165–176. [Google Scholar]
- 28.Koninsky J. Colicins and other bacteriocins with established modes of action. Annu. Rev. Microbiol. 1982;36:125–144. doi: 10.1146/annurev.mi.36.100182.001013. [DOI] [PubMed] [Google Scholar]
- 29.Harold F.M. Antimicrobial agents and membrane function. Adv. Microb. Physiol. 1970;4:45–104. [Google Scholar]
- 30.Shapiro H.M. Cell membrane potential analysis. Methods Cell Biol. 1994;41:121–133. doi: 10.1016/s0091-679x(08)61713-6. [DOI] [PubMed] [Google Scholar]
- 31.Bartek J., Lukas J. DNA damage checkpoints: from initiation to recovery or adaptation. Curr. Opin. Cell Biol. 2007;19:238–245. doi: 10.1016/j.ceb.2007.02.009. [DOI] [PubMed] [Google Scholar]
- 32.Bi E., Lutkenhaus J. Cell division inhibitors SulA and MinCD prevent formation of the FtsZ ring. J. Bacteriol. 1993;175:1118–1125. doi: 10.1128/jb.175.4.1118-1125.1993. [DOI] [PMC free article] [PubMed] [Google Scholar]
- 33.Patient M.E., Summers D.K. ColE1 multimer formation triggers inhibition of E. coli cell division. Mol. Microbiol. 1993;8:1089–1095. doi: 10.1111/j.1365-2958.1993.tb01238.x. [DOI] [PubMed] [Google Scholar]
- 34.Han T.H., Lee J.-H., Cho M.H., Wood T.K., Lee J. Environmental factors affecting indole production in Escherichia coli. Res. Microbiol. 2011;162:108–116. doi: 10.1016/j.resmic.2010.11.005. [DOI] [PMC free article] [PubMed] [Google Scholar]
- 35.Hirakawa H., Inazumi Y., Masaki T., Hirata T., Yamaguchi A. Indole induces the expression of multidrug exporter genes in Escherichia coli. Mol. Microbiol. 2005;55:1113–1126. doi: 10.1111/j.1365-2958.2004.04449.x. [DOI] [PubMed] [Google Scholar]
- 36.McMurry L.M., Cullinane J.C., Petrucci R.E., Jr., Levy S.B. Active uptake of tetracycline by membrane vesicles from susceptible Escherichia coli. Antimicrob. Agents Chemother. 1981;20:307–313. doi: 10.1128/aac.20.3.307. [DOI] [PMC free article] [PubMed] [Google Scholar]
- 37.Taber H.W., Mueller J.P., Miller P.F., Arrow A.S. Bacterial uptake of aminoglycoside antibiotics. Microbiol. Rev. 1987;51:439–457. doi: 10.1128/mr.51.4.439-457.1987. [DOI] [PMC free article] [PubMed] [Google Scholar]
- 38.Wang D., Ding X., Rather P.N. Indole can act as an extracellular signal in Escherichia coli. J. Bacteriol. 2001;183:4210–4216. doi: 10.1128/JB.183.14.4210-4216.2001. [DOI] [PMC free article] [PubMed] [Google Scholar]
Associated Data
This section collects any data citations, data availability statements, or supplementary materials included in this article.
Supplementary Materials
Supplementary materials
The movie shows the oscillation of MinD between the poles of E. coli in the absence of indole. Fluorescent protein was expressed from plasmid pFX9 (Plac-GFP-MinD MinE) in all three supplementary movies. The movie represents 261.2 s (real time) and is composed of 76 frames. The scale bar represents 5 μm.
The movie shows the absence of MinD oscillation between the poles of the E. coli in the presence of 5 mM indole. The movie represents 130.5 s (real time) and is composed of 34 frames. The scale bar represents 5 μm.
The movie, like supplementary movie 2, shows the absence of MinD oscillation between the poles of the E. coli in the presence of 5 mM indole. The movie represents 87 s (real time) and is composed of 23 frames. The scale bar represents 5 μm.