

Abstract
To evaluate the efficiency and feasibility of intermolecular multiple quantum coherence (iMQC) magnetic resonance (MR) imaging for single cell detection, we obtained intermolecular double quantum coherence (iDQC) and conventional gradient echo (GE) images of macrophage cells labeled by contrast agents in gel. The iDQC images obtained with echo-planar readout visualized the labeled cells effectively and with a higher contrast than seen in conventional GE images, especially at low planar resolutions and with thick slices. This implies that iDQC imaging with contrast agents could be a good alternative to conventional MR imaging for detecting labeled single cells or cell tracking under favorable conditions.
1. Introduction
Over the past decade, cellular and molecular imaging (including positron emission tomography (PET) [1], single-photon emission computed tomography (SPECT) [2], optical imaging with fluorescence or bioluminescence imaging [1, 3], and magnetic resonance imaging (MRI) [4]) has attracted attention owing to its ability to monitor biological processes in living organisms. This involves not only direct imaging of individual cells and molecules but also diagnosis and management of disease processes. MR applications include stem cell tracking [5–7], gene expression [8, 9], and cancer detection [10]. Conventional MRI techniques enable in vivo long-term investigation at relatively high resolution, but they are limited by their low sensitivity in the detection of a specific cell and/or molecule.
One major class of modern MR contrast agents uses iron oxide particles, either by themselves [11, 12] or conjugated to attach to specific receptors [13–15]. Thus, many groups have been developing methods to improve the cellular uptake of iron oxide particles [16, 17] or have been using micron-sized iron oxide particles to increase the cell labeling efficiency [18]. Many studies have visualized iron-labeled single cells at a high planar resolution (≤100 μm) and thin slice thickness (≤200 μm) using 3D images or a strong gradient [19–22]. In general, MR detection of iron-labeled single cells requires a sensitive RF coil to achieve a high signal-to-noise ratio (SNR) and a strong gradient to achieve high resolution. In addition, various MRI techniques have been proposed to visualize the local dipolar field more effectively. For example, the 3D fully refocused (steady-state free precession) gradient-echo sequence (known as FIESTA on GE scanners) [20–22] can enhance the effects of the local dipoles and contrast between the local dipole and background. Positive contrast with iron oxide particles is possible by several approaches: spectrally selective RF pulses can excite and refocus the off-resonant water surrounding the labeled cells [23], a mismatched slice gradient [24] or a mismatched coherence-selection gradient pulse pair [25] can dephase the background signal, or an echo-dephased steady state free precession method can be used [26].
In this study, we used intermolecular multiple quantum coherences (iMQCs) to enhance the visibility of iron-labeled single cells at high field (14 T). Because of the intrinsic sensitivity to changes in magnetization and susceptibility structures, iMQC imaging signals provide a fundamentally different contrast mechanism from conventional MRI contrast [27–31], and are particularly well suited to imaging local anisotropy produced by magnetic nanoparticles [32, 33]. Our previous study showed that intermolecular double quantum coherence (iDQC) imaging produced unique contrast that reflected susceptibility structures of small (∼100 μm) air bubbles formed on the walls of capillary tubes [34]. This susceptibility variation can create resonance frequency differences between distant spins that are coupled by intermolecular dipolar interactions. The iMQC image intensity around the bubbles is then reduced by additional dephasing effects and phase distortions [25, 34, 35].
iMQC imaging has been demonstrated at field strengths from 0.016 T [36] to 17.6 T [37–40]. In the present study, we compared images of iron-labeled macrophage cells in gel obtained with iDQC with EPI detection (iDQC_EPI) with those obtained through gradient echo (GE) imaging, at different planar resolutions and slice thicknesses, to evaluate the efficiency and feasibility of iMQC imaging for single cell detection at 14 T. To reveal the effects of the excitation and readout methods, we also compared the iDQC_EPI image with the conventional EPI and iDQC images with spin-echo detection (iDQC_SE) at the spatial resolution of 100 μm × 100 μm × 1 mm.
2. Experimental methods
2.1. Cell sample preparation
Macrophage cells (Raw 264.7) with an average diameter of 11 μm were obtained from a mouse monocytic cell line. The cells were maintained at 37°C and 5% CO2 in Dulbecco's modified Eagle's medium (DMEM; Gibco BRL, Gaithersburg, MD, USA) supplemented with 1% fetal bovine serum (FBS; Gibco BRL). Cell labeling was accomplished by adding a ferumoxide injectable solution (Feridex IV; Advanced Magnetics, Inc., Cambridge, MA, USA) with an iron concentration of 400 μg Fe/mL to 106 cells in the culture medium. Labeled cells were incubated for 4 h, washed three times with PBS in an adherent state, and then detached. The cells were suspended in 25 mL of DMEM and centrifuged for 5 min at 1000 rpm. Cells were counted with a hemocytometer.
For MRI studies, labeled and unlabeled cells were suspended in agarose (1%, w/w) at cellular concentrations of 5000 cells/mL and placed in 5-mm NMR tubes. The cellular iron content was assessed by an inductively coupled plasma-atomic emission spectrometer (ICP-AES).
2.2. Magnetic resonance imaging
All experiments were performed on a 14.1 T Bruker Avance DMX600 NMR spectrometer equipped with a triple gradient system for microscopic imaging. The maximum gradient strength was 200 Gauss/cm, and a 5-mm saddle-type RF coil was used. Imaging data were obtained and analyzed using Bruker's ParaVision 3.0.2 imaging software.
The iDQC_EPI and iDQC_SE images were acquired with a CRAZED-type pulse sequence (90°-τ-gradient-120°-[double-area gradient]-2τ-TE/2-180°-TE/2) with EPI and SE readouts at the end of the sequence, respectively [34]. Four-step phase cycling (for the first RF pulse and the receiver phases) was introduced to suppress unwanted coherences such as single-quantum contaminations. To acquire the iDQC_EPI images, we set echo time (TE) = 90 ms, matrix size = 64 × 64, bandwidth (BW) = 50 kHz, τ = 10 ms, correlation distance (dc) = 100 μm, NS = 32, and scan time = 5 min (NS = 128 and scan time = 21 min for the images of the 0.1-mm-thick slice). We also set TR = 10 s to minimize contamination from stimulated or interscan-stimulated echoes. Slice thickness was also varied to study the resolution dependence of the cell detection. The iDQC_SE image with 1-mm slice thickness was also acquired with the same parameters, but the total scan time was 42 min due to the difference in readout technique. The GE images were acquired with TE = 90 ms, TR = 500 ms, and total scan time = 5 min (hence, NS = 10). In acquiring most of these images, we have fixed TE, the bandwidth, and the total scan time in order to facilitate comparisons. Conventional spin-echo images with EPI detection (SE_EPI) were also acquired to evaluate T2-contrast effects during TE under the same parameters as those in the iDQC experiments, except during multiple quantum excitation/selection.
The fractional signal loss (ΔS/S) was used to assess the amount of contrast, namely single cell detectability, for a given signal void generated by an iron-labeled cell in the images. In our experiments, ΔS/S was calculated by taking the difference (ΔS) between the signal from the central voxel of the cell region (Scell) and the signal from the background gel containing no labeled cells (S) and then dividing the difference by the background gel signal (S) [21, 22]. For each of the images, a mean ΔS/S value was calculated, averaging over six cells. To evaluate each performance, in addition to the overall data quality of the iDQC and GE images, we also calculated the contrast-to-noise ratio (CNR = (ΔS/S) · SNR) because it reflects both the contrast and the SNR [21, 22]. In general, the CNR indicates the detectability of individual cells and clinical lesions in real systems. However, when an image has a sufficient SNR value, the ΔS/S value of the image may better represent the single cell detectability than the CNR because the ΔS/S value is not significantly altered by the SNR [21], while the CNR takes considerable impact from the SNR.
3. Results and discussion
3.1. Detection of iron-labeled single cells with different spatial resolutions
For low-resolution images, a small inhomogeneity such as an iron-labeled cell (which is smaller than a voxel) is ordinarily blurred by averaging all the magnetizations in a voxel [18]. Therefore, spatial resolution comparable to the size of the cell, along with an acceptable SNR, is normally required for detecting single cells. However, as discussed elsewhere [34], iMQC MR imaging is known to be capable of magnifying small variations in a voxel.
To evaluate the feasibility and efficiency of iMQC MR imaging for single cell detection, the iDQC_EPI and GE images of the iron-labeled (∼20 pg Fe/cell) macrophage cells in gel were acquired at various spatial resolutions. As shown in Figs. 1 and 2, single cell detection was generally easier with thin slices or high planar resolution. At a slice thickness of 100 μm, the images showed distinct signal loss that contrasted against the high background signal produced by the agarose medium. The large magnetic susceptibility of the iron oxide particles affected a region 10 times larger than the actual size of a single cell (∼11 μm) in the iDQC_EPI and GE images. At a slice thickness of 0.1 mm or 0.5 mm with a planar resolution of 100 μm × 100 μm, the cells were easily detected in both the GE and iDQC_EPI images. However, at a slice thickness of 1 mm or thicker, the iDQC_EPI images provided higher cell contrast than did the GE images. In particular, at the 2-mm slice thickness in images with a planar resolution of 100 μm × 100 μm, some labeled single cells remained clearly distinguishable in the iDQC_EPI image.
Figure 1.
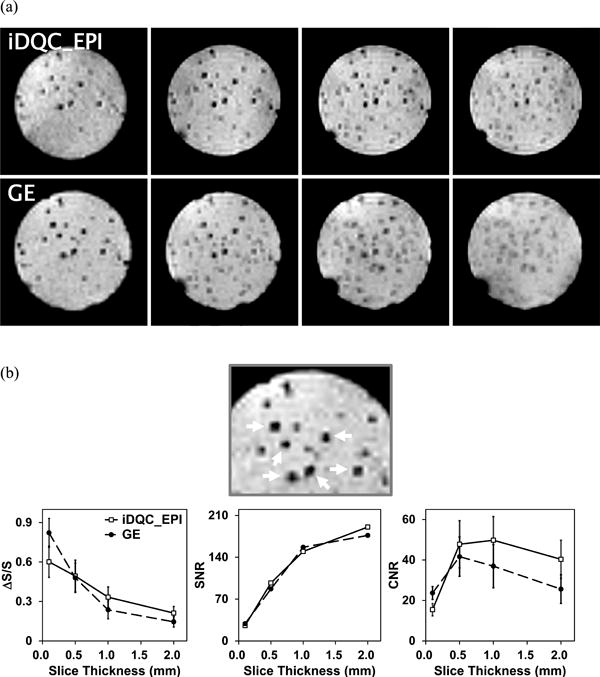
MR images of iron-labeled cell samples according to (a) slice thickness variations (0.1, 0.5, 1.0, and 2.0 mm from left to right) at 100 μm × 100 μm planar resolution. (b) A more magnified image (top) showing the cells selected for the calculation of the fractional signal loss (ΔS/S) value and the resulting mean ΔS/S, SNR, and mean CNR graphs (bottom). The error bars represent the standard deviation of the mean value from the six cells.
Figure 2.

(a) MR images of iron-labeled cell samples ordered by planar resolution variations (78 μm × 78 μm, 100 μm × 100 μm, and 150 μm × 150 μm from left to right) with 1-mm slice thickness and (b) graphs of calculated mean fractional signal loss (ΔS/S) SNR, and mean CNR values for the six cells in Fig. 1b. The error bars represent the standard deviation of the mean value from the six cells.
The ΔS/S and CNR values, representing averages over the six most distinct cells selected in the GE image with 0.1-mm slice thickness (see the magnified images and arrows in Fig. 1b), were measured to visualize the dependence of image contrast on the spatial resolution. As seen in Fig. 1, the ΔS/S values in the iDQC_EPI and GE images seemed to show a somewhat different tendency. At the 0.1-mm slice thickness, the iDQC_EPI image had a lower cell-contrast (ΔS/S) value than the GE image, but the ΔS/S value decreased with increasing slice thickness slower than that of the GE image. This could be explained by the intrinsic property of iMQCs that arise from long-range dipole-dipole couplings. Consequently, at a slice thickness of 1 mm or higher, the iDQC_EPI image had larger ΔS/S values than the GE images. This result implies that under certain favorable conditions, iDQC_EPI images may offer better contrast than GE images for iron-labeled single cell detection. The mean ΔS/S values in both the iDQC_EPI and GE images at the spatial resolution of 100μm × 100 μm ×500 μm were ∼0.5. This value was similar to the value (∼0.45) obtained from the 3D FIESTA pulse sequence at the spatial resolution of 100 μm × 100 μm × 200 μm at 1.5 T [22]. The CNR curve showed a different pattern from the ΔS/S curve because the CNR is the product of contrast (ΔS/S) and SNR. The SNR increases with the slice thickness, hence the CNR curve showed a maximum at the 1-mm (or 0.5-mm) slice thickness. Generally, compared with conventional MR images, the SNR of the iDQC image is expected to be low because of the nature of its signal source. However, since we have fixed TE (= 90 ms) and total scan time (= 5 min, except for the iDQC_EPI image at the 0.1-mm slice thickness) for image acquisition, the SNR values of the GE images became similar to those of the iDQC images. The long TE in the GE detection could cause enhanced image contrast but reduced SNR. The experimental results showed that the iDQC_EPI images at more than 0.5-mm slice thickness had sufficiently large SNR and high ΔS/S values to detect the iron-labeled single cells. Thus, when iDQC_EPI images include a sufficiently strong signal (for example, at low resolution, such as in clinical images), iDQC imaging could be a good alternative for cellular or molecular MR imaging experiments.
Figure 2a shows iDQC_EPI and GE images at the various planar resolutions with 1-mm slice thickness. At all resolutions, the iDQC_EPI images showed greater cell detectability than the GE images. In particular, at the planar resolution of 150 μm × 150 μm, some iron-labeled single cells were readily detected in the iDQC_EPI image but were somewhat indistinct in the GE image. A resolution of 150 μm × 150 μm has often been used to obtain GE images of the brains of small animals such as mice. With this planar resolution, a 3D GE image may be needed to detect labeled cells (<0.1 pixel) clearly, because the labeled cells are not easily detectable in a conventional 2D image with a slice thickness of 1 mm. As shown in Figs. 1 and 2, however, the iDQC_EPI image showed relatively good detectability for the labeled cells, even at the slice thickness of 1 mm or higher. The mean ΔS/S and CNR values for the same six labeled cells in the iDQC_EPI and GE images were also measured (see Fig. 2b). Both the mean ΔS/S and CNR values of the iDQC_EPI images were higher than those of the GE images. The higher CNR values were attributed to the good signal of the iDQC_EPI image with 1-mm slice thickness, as discussed earlier. These mean ΔS/S and CNR values further confirmed that labeled cells could be more detectable in the iDQC_EPI images than in the GE images under some favorable conditions. In particular, for a thick slice and/or a low planar resolution, the iDQC_EPI imaging method could be a more useful tool than the conventional GE imaging method for detecting single cells.
3.2. Comparison of images from the different imaging methods
We also acquired SE_EPI and iDQC_SE images to evaluate the contributions of excitation and readout methods in image contrast. Figure 3 shows the GE, iDQC_EPI, SE_EPI, and iDQC_SE images at the spatial resolution of 100 μm × 100 μm × 1 mm for the same sample. The mean ΔS/S and CNR values for the same six labeled cells of the four images were also measured, as well as the SNR of the images. The ΔS/S value of the iDQC_EPI image was the biggest, while those of the other images were similar to each other (60∼70 % of the iDQC_EPI).
Figure 3.

(a) Comparison of MR images from different imaging methods and (b) graphs of calculated mean fractional signal loss (ΔS/S), SNR, and mean CNR values for the six cells in Fig. 1b. The spatial resolution of the images was 100 μm × 100 μm× 1 mm. The error bars represent the standard deviation of the mean value from the six cells.
As would be expected, the conventional SE image (not shown) does not have enough contrast to detect iron-labeled single cells. However, the adoption of EPI readout (SE_EPI) significantly enhanced the cell detectability since the EPI readout includes additional T2*-weighted contrast as a result of the long readout window [41]. The iDQC_EPI and SE_EPI images were acquired using the same EPI acquisition method with the same readout parameters, except during the iDQC excitation. In principle, therefore, T2 contrast effects during the TE period should be the same in both experiments, but the iDQC_EPI image showed enhanced contrast because the signals intrinsically originated from the multispin coherences. Although both signals of iDQC_EPI and iDQC_SE images originated from intermolecular multispin coherences, they showed different cell contrast due to the additional T2* contrast effects as in the previous case of the conventional SE and SE_EPI images.
Consequently these experimental results show that the large enhancement of cell contrast in the iDQC_EPI image arises from both the intrinsic iMQC property and the EPI-readout method. It was reported that the iDQC images generally reflected their enhanced T2*-weighted sensitivity due to the particular iMQC properties [32, 34, 38, 39]. Rose defined a kind of threshold CNR that dictates the performance of human signal detection, and he determined that the threshold value was ∼5 [21, 42]. Based on this criterion, the CNR values of all images were sufficient to detect the iron-labeled cells. Hence, the relative cell detectability will depend mainly on the cell contrast (ΔS/S).
3.3. Contrast sources in iDQC MR images
To a greater or lesser extent, all four of the images in Fig. 3 reflect T2*-weighted contrasts. The GE images reflect mainly the T2*-weighted contrast, while the others reflect the T2-weighted contrast as a result of the long TE as well as some T2*-weighted contrast. The iDQC excitation with EPI detection seemed to be particularly suitable for detecting iron-labeled single cells.
In general, the combination of the iMQC MR imaging technique with contrast agents may offer two major benefits for enhancing the contrast for single cell detection. First, iDQC detections magnify the effects of the short relaxation time (mainly T2 in this experiment) because iDQCs arise from the two-spin correlations (exponentially decaying twice as fast as T2) over a correlation distance (depending on the correlation gradient), while the conventional GE and/or SE signals arise from the summation of the single spin magnetizations (exponentially decaying with T2*or T2) in a voxel. In addition, the iDQC signals of the iron-labeled cells and nearby coupled gel spins were significantly decreased owing to the additional dephasing effects induced by the chemical shift variations of these cells. These additional enhancements might facilitate reliable contrast in MR images even with relatively small amounts of contrast agents and low spatial resolutions. Figure 4 graphically presents the enhanced contrast of the iDQC image when coupled with contrast agents. As discussed in our previous study [34], the intervoxel effects in iMQC microscopic imaging could increase the detectability (by the signal loss around the labeled cells) of small-sized single cells. Combining the effects of the iDQC method and the EPI readout reflecting its T2*-weighted contrast might significantly enhance the detectability of iron-labeled single cells.
Figure 4.

Signal sources and corresponding pixel images of conventional single quantum coherence (SQC, a and b) and iDQC (c and d) imaging, considering effects of contrast agent (CA) and distant dipolar field (DDF; correlation distance of 100 μm). The pixel dimension and single cell size were set to 100 μm × 100 μm and 10 μm, respectively. Expansion of the effects to a 3D voxel could be straightforward.
4. Conclusion
We have demonstrated the feasibility of combining iDQC imaging with contrast agents for single cell detection. To enhance contrast and/or detectability, a combination of iDQC excitation and EPI readout was used. As compared to conventional GE imaging, contrast-enhanced images were obtained with iDQC_EPI imaging even at low spatial resolutions. Experimental results show that iDQC_EPI imaging could be an alternative (and possibly a better alternative under certain favorable conditions) to conventional GE imaging for cellular and molecular imaging of paramagnetic and ferromagnetic contrast agents.
> Feasibility verification of iDQC MR imaging method for single cell detection. > Comparison of iDQC and GE images at various experimental conditions. > iDQC images show higher cell detectability than GE images under some favorable conditions. > iDQC imaging could be an alternative to GE imaging for cellular/molecular imaging.
Acknowledgments
This work was supported by a Korea Basic Science Institute grant (T31404), NAP of the Korea Research Council of Fundamental Science & Technology (PGB042), a Korean Research Foundation Grant (KRF-2007-331-C00137), the Seoul R&BD program (10543), and an NIH grant (EB02122).
Footnotes
Publisher's Disclaimer: This is a PDF file of an unedited manuscript that has been accepted for publication. As a service to our customers we are providing this early version of the manuscript. The manuscript will undergo copyediting, typesetting, and review of the resulting proof before it is published in its final citable form. Please note that during the production process errors may be discovered which could affect the content, and all legal disclaimers that apply to the journal pertain.
Contributor Information
Sangdoo Ahn, Email: sangdoo@cau.ac.kr.
Chulhyun Lee, Email: chulhyun@kbsi.re.kr.
References
- 1.Wu JC, Chen IY, Sundaresan G, Min JJ, De A, Qiao JH, Fishbein MC, Gambhir SS. Molecular imaging of cardiac cell transplantation in living animals using optical bioluminescence and positron emission tomography. Circulation. 2003;108:1302–1305. doi: 10.1161/01.CIR.0000091252.20010.6E. [DOI] [PMC free article] [PubMed] [Google Scholar]
- 2.Barbash IM, Chouraqui P, Baron J, Feinberg MS, Etzion S, Tessone A, Miller L, Guetta E, Zipori D, Kedes LH, Kloner RA, Leor J. Systemic delivery of bone marrow- derived mesenchymal stem cells to the infarcted myocardium: feasibility, cell migration, and body distribution. Circulation. 2003;108:863–868. doi: 10.1161/01.CIR.0000084828.50310.6A. [DOI] [PubMed] [Google Scholar]
- 3.Wang X, Rosol M, Ge S, Peterson D, McNamara G, Pollack H, Kohn DB, Nelson MD, Crooks GM. Dynamic tracking of human hematopoietic stem cell engraftment using in vivo bioluminescence imaging. Blood. 2003;102:3478–3482. doi: 10.1182/blood-2003-05-1432. [DOI] [PubMed] [Google Scholar]
- 4.Lewin M, Carlesso N, Tung CH, Tang XW, Cory D, Scadden DT, Weissleder R. Tat peptide-derivatized magnetic nanoparticles allow in vivo tracking and recovery of progenitor cells. Nat Biotechnol. 2000;18:410–414. doi: 10.1038/74464. [DOI] [PubMed] [Google Scholar]
- 5.Bulte JW, Douglas T, Witwer B, Zhang SC, Strable E, Lewis BK, Zywicke H, Miller B, van Gelderen P, Moskowitz BM, Duncan ID, Frank JA. Magnetodendrimers allow endosomal magnetic labeling and in vivo tracking of stem cells. Nat Biotechnol. 2001;19:1141–1147. doi: 10.1038/nbt1201-1141. [DOI] [PubMed] [Google Scholar]
- 6.Hoehn M, Kustermann E, Blunk J, Wiedermann D, Trapp T, Wecker S, Focking M, Arnold H, Hescheler J, Fleischmann BK, Schwindt W, Buhrle C. Monitoring of implanted stem cell migration in vivo: a highly resolved in vivo magnetic resonance imaging investigation of experimental stroke in rat. Proc Natl Acad Sci USA. 2002;99:16267–16272. doi: 10.1073/pnas.242435499. [DOI] [PMC free article] [PubMed] [Google Scholar]
- 7.Kraitchman DL, Heldman AW, Atalar E, Amado LC, Martin BJ, Pittenger MF, Hare JM, Bulte JW. In vivo magnetic resonance imaging of mesenchymal stem cells in myocardial infarction. Circulation. 2003;107:2290–2293. doi: 10.1161/01.CIR.0000070931.62772.4E. [DOI] [PubMed] [Google Scholar]
- 8.Weissleder R, Moore A, Mahmood U, Bhorade R, Benveniste H, Chiocca EA, Basilion JP. In vivo magnetic resonance imaging of transgene expression. Nat Med. 2000;6:351–355. doi: 10.1038/73219. [DOI] [PubMed] [Google Scholar]
- 9.Moore A, Josephson L, Bhorade RM, Basilion JP, Weissleder R. Human transferrin receptor gene as a marker gene for MR imaging. Radiology. 2001;221:244–250. doi: 10.1148/radiol.2211001784. [DOI] [PubMed] [Google Scholar]
- 10.Harisinghani MG, Barentsz J, Hahn PF, Deserno WM, Tabatabaei S, van de Kaa CH, de la Rosette J, Weissleder R. Noninvasive detection of clinically occult lymph-node metastases in prostate cancer. N Engl J Med. 2003;348:2491–2499. doi: 10.1056/NEJMoa022749. [DOI] [PubMed] [Google Scholar]
- 11.Bulte JWM, Brooks RA, Moskowitz BM, Bryant LH, Frank JA. Relaxometry and magnetometry of the MR contrast agent MION-46L. Magn Reson Med. 1999;42:379–384. doi: 10.1002/(sici)1522-2594(199908)42:2<379::aid-mrm20>3.0.co;2-l. [DOI] [PubMed] [Google Scholar]
- 12.Dias MHM, Lauterbur PC. Ferromagnetic particles as contrast agents for magnetic resonance imaging of liver and spleen. Magn Reson Med. 1986;3:328–330. doi: 10.1002/mrm.1910030218. [DOI] [PubMed] [Google Scholar]
- 13.Branca RT, Cleveland ZI, Fubara B, Kumar CSSR, Maronpot RR, Leuschner C, Warren WS, Driehuys B. Molecular MRI for sensitive and specific detection of lung metastases. Proc Natl Acad Sci USA. 2010;107:3693–3697. doi: 10.1073/pnas.1000386107. [DOI] [PMC free article] [PubMed] [Google Scholar]
- 14.Gupta AK, Gupta M. Synthesis and surface engineering of iron oxide nanoparticles for biomedical applications. Biomaterials. 2005;26:3995–4021. doi: 10.1016/j.biomaterials.2004.10.012. [DOI] [PubMed] [Google Scholar]
- 15.Corot C, Robert P, Idee JM, Port M. Recent advances in iron oxide nanocrystal technology for medical imaging. Adv Drug Deliv Rev. 2006;58:1471–1504. doi: 10.1016/j.addr.2006.09.013. [DOI] [PubMed] [Google Scholar]
- 16.Kalish H, Arbab AS, Miller BR, Lewis BK, Zywicke HA, Bulte JW, Bryant LH, Jr, Frank JA. Combination of transfection agents and magnetic resonance contrast agents for cellular imaging: relationship between relaxivities, electrostatic forces, and chemical composition. Magn Reson Med. 2003;50:275–282. doi: 10.1002/mrm.10556. [DOI] [PubMed] [Google Scholar]
- 17.Wilhelm C, Billotey C, Roger J, Pons JN, Bacri JC, Gazeau F. Intracellular uptake of anionic superparamagnetic nanoparticles as a function of their surface coating. Biomaterials. 2003;24:1001–1011. doi: 10.1016/s0142-9612(02)00440-4. [DOI] [PubMed] [Google Scholar]
- 18.Shapiro EM, Skrtic S, Koretsky AP. Sizing it up: cellular MRI using micron-sized iron oxide particles. Magn Reson Med. 2005;53:329–338. doi: 10.1002/mrm.20342. [DOI] [PubMed] [Google Scholar]
- 19.Dodd SJ, Williams M, Suhan JP, Williams DS, Koretsky AP, Ho C. Detection of single mammalian cells by high-resolution magnetic resonance imaging. Biophys J. 1999;76:103–109. doi: 10.1016/S0006-3495(99)77182-1. [DOI] [PMC free article] [PubMed] [Google Scholar]
- 20.Foster-Gareau P, Heyn C, Alejski A, Rutt BK. Imaging single mammalian cells with a 1.5 T clinical MRI scanner. Magn Reson Med. 2003;49:968–971. doi: 10.1002/mrm.10417. [DOI] [PubMed] [Google Scholar]
- 21.Heyn C, Bowen CV, Rutt BK, Foster PJ. Detection threshold of single SPIO-labeled cells with FIESTA. Magn Reson Med. 2005;53:312–320. doi: 10.1002/mrm.20356. [DOI] [PubMed] [Google Scholar]
- 22.Heyn C, Ronald JA, Mackenzie LT, MacDonald IC, Chambers AF, Rutt BK, Foster PJ. In vivo magnetic resonance imaging of single cells in mouse brain with optical validation. Magn Reson Med. 2006;55:23–29. doi: 10.1002/mrm.20747. [DOI] [PubMed] [Google Scholar]
- 23.Cunningham CH, Arai T, Yang PC, McConnell MV, Pauly JM, Conolly SM. Positive contrast magnetic resonance imaging of cells labeled with magnetic nanoparticles. Magn Reson Med. 2005;53:999–1005. doi: 10.1002/mrm.20477. [DOI] [PubMed] [Google Scholar]
- 24.Seppenwoolde JH, Viergever MA, Bakker CJ. Passive tracking exploiting local signal conservation: the white marker phenomenon. Magn Reson Med. 2003;50:784–790. doi: 10.1002/mrm.10574. [DOI] [PubMed] [Google Scholar]
- 25.Faber C, Heil C, Zahneisen B, Balla DZ, Bowtell R. Sensitivity to local dipole fields in the CRAZED experiment: an approach to bright spot MRI. J Magn Reson. 2006;182:315–324. doi: 10.1016/j.jmr.2006.05.002. [DOI] [PubMed] [Google Scholar]
- 26.Patil S, Jirák D, Saudek F, Hájek M, Scheffler K. Positive contrast visualization of SPIO-labeled pancreatic islets using echo-dephased steady-state free precession. Eur Radiol. 2011;21:214–220. doi: 10.1007/s00330-010-1909-1. [DOI] [PubMed] [Google Scholar]
- 27.He QH, Richter W, Vathyam S, Warren WS. Intermolecular multiple-quantum coherences and cross correlations in solution nuclear magnetic resonance. J Chem Phys. 1993;98:6779–6800. [Google Scholar]
- 28.Warren WS, Richter W, Andreotti AH, Farmer BT., 2nd Generation of impossible cross-peaks between bulk water and biomolecules in solution NMR. Science. 1993;262:2005–2009. doi: 10.1126/science.8266096. [DOI] [PubMed] [Google Scholar]
- 29.Warren WS. Concentrated Solution Effects. Encyclopedia of Magnetic Resonance. 2011 in press. [Google Scholar]
- 30.Lin Y, Gu T, Chen Z, Kennedy S, Jacob M, Zhong J. High-Resolution MRS in the Presence of Field Inhomogeneity via Intermolecular Double-Quantum Coherences on a 3-T Whole-Body Scanner. Magn Reson Med. 2010;63:303–311. doi: 10.1002/mrm.22224. [DOI] [PubMed] [Google Scholar]
- 31.Zhang S, Zhu X, Chen Z, Cai C, Lin T, Zhong J. Improvement in the contrast of CEST MRI via intermolecular double quantum coherences. Phys Med Biol. 2008;53:N287–N296. doi: 10.1088/0031-9155/53/14/N03. [DOI] [PubMed] [Google Scholar]
- 32.Bouchard LS, Rizi RR, Warren WS. Magnetization structure contrast based on intermolecular multiple-quantum coherences. Magn Reson Med. 2002;48:973–979. doi: 10.1002/mrm.10293. [DOI] [PubMed] [Google Scholar]
- 33.Bouchard LS, Warren WS. Multiple-quantum vector field imaging by magnetic resonance. J Magn Reson. 2005;177:9–21. doi: 10.1016/j.jmr.2005.06.019. [DOI] [PubMed] [Google Scholar]
- 34.Cho JH, Ahn S, Lee C, Hong KS, Chung KC, Chang SK, Cheong C, Warren WS. Magnetic resonance microscopic imaging based on high-order intermolecular multiple-quantum coherences. Magn Reson Imaging. 2007;25:626–633. doi: 10.1016/j.mri.2006.09.005. [DOI] [PubMed] [Google Scholar]
- 35.Enss T, Ahn S, Warren WS. Visualizing the dipolar field in solution NMR and MR imaging: three-dimensional structure simulations. Chem Phys Lett. 1999;305:101–108. [Google Scholar]
- 36.Barros W, de Sousa PL, Engelsberg M. Low field intermolecular double-quantum coherence imaging via the Overhauser effect. J Magn Reson. 2003;165:175–179. doi: 10.1016/s1090-7807(03)00277-5. [DOI] [PubMed] [Google Scholar]
- 37.Warren WS, Ahn S, Mescher M, Garwood M, Ugurbil K, Richter W, Rizi RR, Hopkins J, Leigh JS. MR imaging contrast enhancement based on intermolecular zero quantum coherences. Science. 1998;281:247–251. doi: 10.1126/science.281.5374.247. [DOI] [PubMed] [Google Scholar]
- 38.Faber C, Zahneisen BB, Tippmann F, Schroeder A, Fahrenholz F. Gradient-Echo and CRAZED Imaging for Minute Detection of Alzheimer Plaques in an APPV717I × ADAM10-dn Mouse Model. Magn Reson Med. 2007;57:696–703. doi: 10.1002/mrm.21201. [DOI] [PubMed] [Google Scholar]
- 39.Johannes TS, Faber C. BOLD Imaging in the Mouse Brain Using a TurboCRAZED Sequence at High Magnetic Fields. Magn Reson Med. 2008;60:850–859. doi: 10.1002/mrm.21716. [DOI] [PubMed] [Google Scholar]
- 40.Panting JR, Taylor AM, Gatehouse PD, Keegan J, Yang GZ, McGill S, Francis JM, Burman ED, Firmin DN, Pennell DJ. First-pass myocardial perfusion imaging and equilibrium signal changes using the intravascular contrast agent NC100150 injection. J Magn Reson Imaging. 1999;10:404–410. doi: 10.1002/(sici)1522-2586(199909)10:3<404::aid-jmri23>3.0.co;2-v. [DOI] [PubMed] [Google Scholar]
- 41.Marques JP, Bowtell R. Optimizing the Sequence Parameters for Double-Quantum CRAZED Imaging. Magn Reson Med. 2004;51:148–157. doi: 10.1002/mrm.10700. [DOI] [PubMed] [Google Scholar]
- 42.Rose A. The sensitivity performance of the human eye on an absolute scale. J Opt Soc Am. 1948;38:196–208. doi: 10.1364/josa.38.000196. [DOI] [PubMed] [Google Scholar]