

Abstract
The serotonin 2C receptor (5-HT2CR) plays a significant role in psychiatric disorders (e.g., depression) and is a target for pharmacotherapy. The 5-HT2CR is widely expressed in brain and spinal cord and is the only G-protein coupled receptor currently known to undergo mRNA editing, a post-transcriptional modification that results in translation of distinct, though closely related, protein isoforms. The 5-HT2CR RNA can be edited at five sites to alter up to three amino acids resulting in modulation of receptor:G-protein coupling and constitutive activity. To rapidly quantify changes ex vivo in individual 5-HT2CR isoform levels in response to treatment, we adapted quantitative (real-time) reverse transcription polymerase chain reaction (qRT-PCR) utilizing TaqMan® probes modified with a minor groove binder (MGB). Probes were developed for four 5-HT2CR RNA isoforms and their sensitivity and specificity were validated systematically using standard templates. Relative expression of the four isoforms was measured in cDNAs from whole brain extracted from 129S6 and C57BL/6J mice. Rank order derived from this qRT-PCR analysis matched that derived from DNA sequencing. In mutant mice solely expressing either non-edited or fully edited 5-HT2CR transcripts, only expected transcripts were detected. These data suggest this qRT-PCR method is a precise and rapid means to detect closely related mRNA sequences ex vivo without the necessity of characterizing the entire 5-HT2CR profile. Implementation of this technique will expand and expedite studies of specific brain 5-HT2CR mRNA isoforms in response to pharmacological, behavioral and genetic manipulation, particularly in ex vivo studies which require rapid collection of data on large numbers of samples.
Keywords: RNA editing, 5-HT2C R, Post-transcriptional modification, qRT-PCR, Minor groove binders, Unlabeled competing probes
1. Introduction
The serotonin (5-HT) 2C receptor (5-HT2CR) is involved in normal physiology and behavior, as well as in mental health disorders, including addiction, depression, obsessive–compulsive disorder and schizophrenia (for reviews, Giorgetti and Tecott, 2004; Bubar and Cunningham, 2008). The 5-HT2CR is found in brain (Pasqualetti et al., 1999; Clemett et al., 2000) and is the only G-protein coupled receptor (GPCR) currently known to undergo mRNA editing (Burns et al., 1997; Sanders-Bush et al., 2003), a type of post-transcriptional modification that inserts, deletes (Benne et al., 1986; Cruz-Reyes et al., 1998; Igo et al., 2002) or modifies (Samuel, 2003) single or small numbers of ribonucleotides in pre-mRNA. These changes alter the coding properties and information content of mRNA molecules (Bass, 2002; Hoopengardner et al., 2003; Maydanovych and Beal, 2006).
The 5-HT2CR pre-mRNA is a substrate for base modification via hydrolytic deamination of five closely spaced adenosines (A) to yield inosines within a 13 base region of the RNA [(designated A, B, E, C, and D; Fig. 1) Burns et al., 1997; Niswender et al., 1998; Gurevich et al., 2002a]. In the course of translation, the ribosome recognizes the resultant inosine (I) as a guanosine (G), resulting in an A → G substitution. This leads to the formation of proteins that differ by up to three amino acids, thereby modulating receptor:G-protein coupling, constitutive activity and receptor trafficking (Marion et al., 2004; Berg et al., 2001; Herrick-Davis et al., 1999; Niswender et al., 1999). In theory, there are 32 possible nucleotide combinations of these editing sites, resulting in 24 possible protein isoforms. In practice, fewer isoforms are routinely detected and the pattern of expression varies by species and brain region (Niswender et al., 1999; Fitzgerald et al., 1999; Sanders-Bush et al., 2003).
Fig. 1.
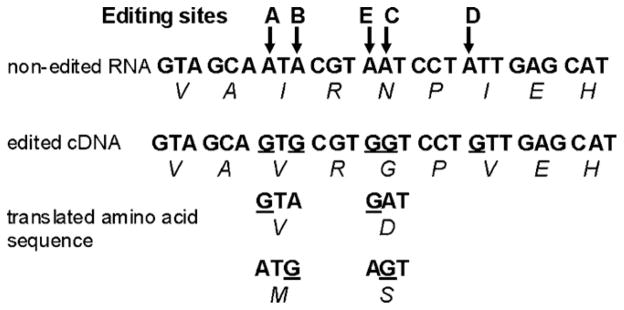
RNA editing sites of 5-HT2C R transcript. cDNA nucleotide and predicted amino-acid sequences for the non-edited and fully edited transcripts are shown with the editing sites indicated by arrows (↓). Picture adapted from Sanders-Bush et al. (2003).
The profile of edited 5-HT2CR isoforms is significantly modified following 5-HT depletion (Gurevich et al., 2002b; Englander et al., 2005; Yang et al., 1995) and drug exposure (Englander et al., 2005; Gurevich et al., 2002b) as well as in a rat model of depression (Iwamoto et al., 2005). In humans, changes in 5-HT2CR RNA editing profiles have been observed in the prefrontal cortex of depressed suicide victims (Dracheva et al., 2008, 2007; Gurevich et al., 2002a) and schizophrenics (Sodhi et al., 2001; Dracheva et al., 2003). Thus, basal patterns of 5-HT2CR isoform expression may play a role in vulnerability to and/or expression of various psychiatric disorders. Furthermore, it is conceivable that abnormal 5-HT2CR function based upon altered patterns of 5-HT2CR isoform expression may be normalized by therapeutic treatment with psychiatric medications (Niswender et al., 2001; Sanders-Bush et al., 2003).
The quantitative measurement of final protein products of edited 5-HT2CR transcripts is an important analytic endpoint for study; however, antibodies capable of discriminating among 5-HT2CR proteins with the minor sequence differences caused by RNA editing are not currently available. Until options are available to study isoform-specific proteins, there is obvious utility in accurately detecting and quantifying changes in the levels of mature mRNA isoforms in ex vivo samples. The two most commonly used methods to quantify edited RNA isoforms in ex vivo brain samples are direct sequencing (Burns et al., 1997; Gurevich et al., 2002a) and pyrosequencing (Iwamoto et al., 2005; Sodhi et al., 2005). These methods yield unambiguous results, but are labor intensive and involve multiple intermediate steps that can increase error and introduce sampling bias. In general, these methods involve an initial reverse transcription of isolated RNA, cloning of the cDNA, bacterial transformation and amplification, colony selection (both methods) followed by amplification and DNA isolation (direct sequencing only), then sequencing of the DNA from each colony. Because each colony analyzed represents a single RNA transcript (Sodhi et al., 2005), this sequencing process must be performed on numerous colonies for each individual subject in order to characterize the editing profile for that subject. To determine the percentage of the total population of the 5-HT2CR isoform of interest, it is necessary to measure the entire isoform profile for each test subject. As a result of the time and expense involved, the number of sequences characterized is often small compared to the actual number of mRNA molecules. For example, sequencing methods have been employed to characterize entire RNA editing profiles by analyzing 51–60 (Gurevich et al., 2002b) or more than 50 5-HT2CR cDNA sequences for each animal (Iwamoto et al., 2005). Thus, there is a pressing need for a precise, rapid assay that avoids sampling bias and extracts data from the entire 5-HT2CR mRNA population. In practice such an assay would be beneficial particularly in ex vivo analyses of changes in the RNA editing of the 5-HT2CR that occur after pharmacological, behavioral or genetic manipulation with a larger number of subjects.
We have adapted quantitative (real-time) reverse transcription polymerase chain reaction (qRT-PCR) as a method to detect and quantify changes in edited 5-HT2CR RNA isoforms by utilizing TaqMan® probes modified with a minor groove binder (MGB; Kutyavin et al., 2000). As a proof of concept, four TaqMan® MGB probes were designed for detection of four closely related 5-HT2CR edited transcripts (Table 1). The non-edited, fully edited (ABECD) and partially edited (AD) 5-HT2CR RNA isoforms were chosen as examples of low abundance isoforms relative to the partially edited ABD isoform which is the most abundant in the rodent brain (Burns et al., 1997). In addition, the AD isoform differs from the ABD isoform by only a single nucleotide while the fully edited ABECD isoform differs by two nucleotides. This set of probes was chosen to allow us to assess the ability of the TaqMan® MGB assay to detect both high and low abundance isoforms and to discriminate among closely related isoforms. The probes were tested against a complementary set of standard cDNA templates generated by PCR amplification from well-characterized plasmids expressing the respective 5-HT2CR isoforms to accurately control the amount of given cDNA template in the reaction (and thereby determine whether the results were as expected). We then analyzed RNA samples isolated from whole brains of wild-type mice and mutant mice limited in expression to a single isoform each. The findings strongly suggest that the TaqMan® MGB assay exhibits appropriate specificity and sensitivity to analyze changes in levels of specific edited 5-HT2CR mRNA isoforms in both in vitro and ex vivo systems.
Table 1.
Names and sequences of TaqMan® MGB probes for RNA isoforms of 5-HT2C R.
| TaqMan® MGB probe | 5-HT2c R RNA isoform detected | Edited sites | TaqMan® MGB probe sequence | Amino acid sequence |
|---|---|---|---|---|
| ABECD | ABECD | A, B, E, C and D | [FAM] TAGCAGTGCGTGGTCCTGTTGA [MGB/NFQ] | VGV |
| ABD | ABD | A, B, and D | [FAM] TAGCAGTGCGTAATCCTGTTGA [MGB/NFQ] | VNV |
| AD | AD | A and D | [FAM] TGTAGCAGTACGTAATCCTGTTGA [MGB/NFQ] | VNV |
| Non-edited | Non-edited | None | [FAM] TAGCAATACGTAATCCTATTG [MGB/NFQ] | INI |
2. Materials and methods
2.1. Animals
Eight-week-old naïve adult male C57BL/6J mice (n = 4; Harlan Sprague–Dawley, Inc., Indianapolis, IN, USA) weighing 15–20 g were used. The animals were housed four per cage in a temperature (21–23 °C) and humidity (40–50%) controlled environment and lighting was maintained under a 12-h light-dark cycle (lights on 7:00 a.m. to 7:00 p.m.). Mice were euthanized by cervical dislocation, their brains rapidly removed and placed in a cool tray (4 °C). Whole brains were cut into small pieces, stored in RNAlater (Ambion) and kept at −80°C until RNA extraction was performed. Total whole brain RNA also was obtained from 129S6 mice and genetically modified mice (n = 1 each) that solely express either the fully edited ABECD (VGV) or the non-edited (INI) isoform (129S6 genetic background). Mice solely expressing the VGV isoform were generated by mutating the five edited adenosine residues by homologous recombination to mimic RNA editing at all five sites. Mice solely expressing the INI isoform were generated by introducing 11 point mutations in the intron 5 portion of the 5-HT2CR pre-mRNA duplex opposite the five adenosine editing sites in order to disrupt RNA duplex formation and inhibit 5-HT2CR RNA editing. Confirmation that the introduced mutations resulted in the sole expression of RNA transcripts encoding VGV and INI isoforms was confirmed by sequence analysis of RT-PCR amplicons derived from whole brain RNA obtained from each mutant mouse strain (poster# 465.9/H21, 2007 Society for Neuroscience (SFN) Scientific Meeting; manuscript submitted).
2.2. Materials
6-Carboxyfluorescein (FAM)-labeled TaqMan® MGB probes were custom synthesized by Applied Biosystems. Primers and unlabeled competing probes were synthesized by SigmaGenosys (Sigma–Aldrich, St. Louis, MO). We designed a TaqMan® assay for the housekeeping gene cyclophilin (accession number M 19533; bases 224–293); primer and probe sequences were: SN primer = 5′-TGT GCC AGG GTG GTG ACT T-3′; ASN primer = 5′-TCA AAT TTC TCT CCG TAG ATG GAC TT-3′; probe = [FAM] ACA CGC CAT AAT GGC ACT GGT GG [TAMRA]. TaqMan® Universal PCR Master Mix, TaqMan® Reverse Transcription Kit and Gene Amp XL PCR kit were purchased from Applied Biosystems.
2.3. Preparation of standard templates
Sense (SN) and antisense (ASN) primer sequences flanking the 5-HT2CR editing region (accession number M21410; bases 1014–1192) were designed using Primer3 Software (Whitehead Institute, Cambridge, MA) with stringent parameters to reduce primer dimerization and to minimize the difference between primer melting temperatures (Tms within 2 °C). SN and ASN sequences were 5′-CCT GTC TCT GCT TGC AAT TCT-3′ and 5′-GCG AAT TGA ACC GGC TAT G-3′, respectively.
A plasmid containing cDNA for the complete non-edited 5-HT2CR was kindly provided by Drs. William Clarke and Kelly Berg (University of Texas Health Science Center at San Antonio). A standard template for the non-edited isoform was produced using conventional PCR with Taq DNA polymerase (Fisher Scientific, Houston, TX) and the primers described above. Plasmids containing cDNA for the A, B, D, AD, ABD, ABCD and ABECD edited isoforms were developed by RT-PCR amplification of total RNA from adult mouse brain using oligonucleotide primers in exon 5 (5′-ATT AGA ATT CTA TTT GTG CCC CGT CTG G-3′) and intron 5 (5′-GGG CAA ATA TTC TGA AAA GAT GTT-3′) that flanked the edited region of the 5-HT2CR pre-mRNA. The 376 bp PCR amplicon was subcloned into the pBlueScript II KS (−) plasmid (Stratagene, La Jolla, CA) between the EcoR I and Hind III sites and individual cDNA isolates were subjected to DNA sequence analysis to identify clones containing the required patterns of editing. Because the cDNA fragments in these clones did not extend upstream to the primers selected for this study, we utilized an extra long SN primer (60 bases) to extend the sequences during amplification. The SN primer was 5′-CCT GTC CCT GCT TGC TAT TCT TTA TGA TTA TTT ACC TAG ATA TTT GTG CCC CGT CTG GAT-3′; the ASN primer was as described above. The underlined nucleotides correspond to the region of hybridization of the sense primer to the clone DNA. Because of the length of this sense primer, the PCR reaction was carried out with the Gene Amp XL PCR kit (Applied Biosystems) according to manufacturer’s directions.
Following PCR, all amplimers were characterized by agarose gel electrophoresis for the correct size (180 bp), then excised, gel purified and sequenced by the Sealy Center for Molecular Science (UTMB) to confirm the identities of the 5-HT2CR isoforms. The DNA concentrations of standard template stock solutions were estimated by absorbance at 260 nm, then by comparison to quantitative DNA standards in polyacrylamide gel electrophoresis (Recombinant DNA Lab, UTMB). The concentrations of the standard stock solutions were as follows: non-edited (30 ng/μL), A (30 ng/μL), B (30 ng/μL), D (30 ng/μL), AD (100 ng/μL), ABD (100 ng/μL), ABCD (60 ng/μL), and ABECD (100 ng/μL). Stocks were aliquoted and frozen at −20 °C. These amplimers were used as templates to standardize reaction conditions and to test the sensitivity and discriminative ability of the TaqMan® MGB probes.
2.4. RNA extraction and reverse transcription
Tissue was homogenized in 500 μL of TRI Reagent® (Applied Biosystems), using a Tissue-Tearor™ homogenizer. RNA was then isolated using the RiboPure kit (Applied Biosystems) according to the manufacturer’s directions. Any residual genomic DNA was removed by treatment with TURBO DNA-free™ (Applied Biosystems); a final incubation step of 70 °C for 10 min was used to inactivate the DNAse. The final RNA concentration was determined by absorbance at 260 nm. The reverse transcription reaction was performed on 0.25–0.5 μg of RNA using the TaqMan® Reverse Transcription Kit (Applied Biosystems) with random hexamer primers according to the manufacturer’s directions. The reverse transcription program consisted of an annealing step (25 °C, 10 min) followed by elongation (48 °C, 30 min) and a final enzyme inactivation step (95 °C, 5 min).
2.5. TaqMan® MGB assay
TaqMan® MGB probes for four 5-HT2CR mRNA isoforms (ABECD, ABD, AD and non-edited; Table 1) were designed with the assistance of Dr. Joy Sheng of Applied Biosystems Technical Support. The SN and ASN primers flanking the editing region (described above) were used in qRT-PCR assays with each TaqMan® MGB probe to assess the different 5-HT2CR mRNA edited isoform levels. Initial qRT-PCR reactions were comprised of 10 μL of Universal TaqMan Master Mix, 125 nM sense and antisense primers, 150 nM probe and 6 μL of sample containing target template in a final reaction volume of 20 μL. Assays were performed in a 7500 Fast Real-Time PCR System (Applied Biosystems). The initial TaqMan® assay amplification program (according to manufacturer’s directions) consisted of an activation step (95 °C, 10 min) followed by 40 cycles of denaturation (95 °C, 15 s), annealing and elongation (60 °C, 1 min). Conditions for the assay were varied during the optimization process and are described in Section 3. All data were analyzed using the 7500 Fast System Detection Software (SDS) version 1.3.1 (Applied Biosystems).
The relative quantitation method was used to compare differences between samples (Schefe et al., 2006; Livak and Schmittgen, 2001; Wong and Medrano, 2005). Results are expressed in terms of crossing threshold (Ct), which is defined as the PCR cycle at which sample fluorescence crosses a threshold set above baseline fluctuations (background noise) and within the logarithmic portion of the amplification plot. The difference in crossing thresholds (ΔCt) was calculated for each cDNA being studied: ΔCt = Ct (5-HT2CR isoform of interest) − Ct (cyclophilin). Mean ± SEM was determined for each group. The magnitude of the differences between groups was calculated as: ΔΔCt = ΔCt (5-HT2CR isoform of interest) − ΔCt (5-HT2CR most abundant isoform); relative mRNA expression was estimated by 2−ΔΔCt.
2.6. Sensitivity of the TaqMan® MGB probes
Probe sensitivity was tested by performing qRT-PCR assays for each probe with matching standard template stock solutions serially diluted 106–1012-fold. Serial dilutions of target templates were tested until the resultant Ct value of the sample was not significantly different from that of no template controls (NTCs). Each sample (6.0 μL per reaction) was tested in triplicate against its respective TaqMan® MGB probe. The slope of the standard template dilution curve was determined by plotting Ct values measurements as a function of the log DNA concentration. Efficiency (E) of each assay was determined according to the equation (Wong and Medrano, 2005). An efficiency equal to 1.0 is the maximum possible and implies that the amount of PCR product doubles with every 1.0 cycles.
2.7. Specificity of TaqMan® MGB probes
Probe specificity was determined by performing a series of qRT-PCR assays using each probe with templates that differed by 1–5 nucleotides from the perfectly matched template. Standard templates were diluted 106-fold. [Initial concentrations were 15 ng/μL (D and non-edited) or 50 ng/μL (ABECD, ABCD, ABD, and AD)]. The qRT-PCR program was that recommended by Applied Biosystems (see above). The Ct values for mismatched templates were compared to those for perfectly matched templates. To simplify these comparisons, we have defined the following term:
The percentage of cross-hybridization was calculated by:
By using these equations, a Ct Difference of 5 cycles correlates to 3.125% cross-hybridization. This should provide a sufficient level of discrimination between closely related isoforms and we have adopted this criterion as our minimum acceptable value for probe specificity.
2.8. Optimization of reaction conditions
Parameters that were varied from the standard conditions included: (1) annealing temperature (60.0, 60.5, 61.0 and 62.0 °C); (2) probe concentration (25, 50, 100, 125 and 150 nM final concentration); (3) addition of PCR enhancers: ammonium chloride [5, 10 and 20 mM (Decker et al., 2002)]; tetra-methyl ammonium chloride [60 mM (Chevet et al., 1995)]; formamide [1, 2.5 and 5% (Varadaraj and Skinner, 1994)]; and DMSO [1, 2.5 and 5% (Varadaraj and Skinner, 1994)]; (4) addition of competitors (see below).
2.9. Effects of unlabeled competing probes (“Competitors”)
Unlabeled competing probes (competitors) are oligonucleotides that differ from the complementary target sequence for each respective TaqMan® MGB probe at a single (editing site) nucleotide. [We have used the same nomenclature (Table 1) regarding editing sites for competitor probes as for the TaqMan® MGB probes.] A fixed concentration of each TaqMan® MGB probe was tested against various concentrations of competitor (ranging from 0.0125 to 1 μM final concentration). The D, ABD, ABCD, and ABCD standard templates were used as mismatched templates for the TaqMan® MGB non-edited, AD, ABD and ABECD probes, respectively. Each qRT-PCR reaction consisted of: 10 μL of Universal TaqMan® Master Mix, 125 nM SN and ASN primers, 100 nM TaqMan® MGB probe, 6 μL of standard templates (106-fold dilution of standard stocks) and 2 μL 0.125–10 μM of 10× stock solution of competitors in a final reaction volume of 20 μL. These concentrations of standard templates yielded Ct values of 18–22, which are lower (indicating higher template concentrations) than those we have found in brain samples, thus representing a more stringent test of specificity. Assays were performed according to the manufacturer’s directions (Applied Biosystems).
2.10. Effects of mixed templates on TaqMan® MGB probe assays
In order to simulate conditions expected for ex vivo experiments, we tested the non-edited probe against various standard template mixtures. In these experiments, the qRT-PCR reaction mix consisted of: 10 μL of Universal TaqMan® Master Mix, 125 nM sense and anti-sense primers, 100 nM TaqMan® MGB non-edited probe and 6 μL of standard template mixture [1.5 μL each of A, B, D and non-edited standard templates (108-fold dilution)] in a final reaction volume of 20 μL. Assays were performed according to manufacturer’s directions (Applied Biosystems).
2.11. Effects of competitors on assays with mixed templates
Extensive tests on the non-edited probe, which has five possible single-mismatch competitors, were performed. Equal concentrations of competitors for the A, B, C, D and E edited isoforms were combined to form a cocktail (0.25 μM final total concentration; 0.05 μM each). The final qRT-PCR reaction mix consisted of: 10 μL of Universal TaqMan® Master Mix, 125 nM sense and antisense primers, 100 nM TaqMan® MGB non-edited probe, 2 μL competitor cocktail mix and 6 μL template mixture [1.5 μL each of A, B, D and non-edited standard templates (108-fold dilution)] in a final reaction volume of 20 μL. Assays were performed as described above.
2.12. Validation of TaqMan® MGB probe assays using RNA from whole mouse brains
Following reverse transcription, samples were diluted in 4 volumes of nuclease-free water (Applied Biosystems). TaqMan® MGB probe assays were performed as described above on the resultant cDNA samples both in the presence and absence of competitors. The relative quantification method was used to analyze the data. Competitor cocktails were prepared for each probe in 20 μL final volumes from 15 μM stock solutions as follows: non-edited = 4 μL each of A, B, E, C and D; AD = 4 μL each of A, D, ABD and ACD; ABD = 4 μL each of AD, AB and ABCD; and ABECD = 4 μL each of ABCD and ABEC. Competitor cocktails were then diluted 8 or 16 times in nuclease-free water. The resultant final concentrations for each competitor in the respective dilutions were 0.375 and 0.188 μM. Two μL of the diluted competitor cocktails were used in the qRT-PCR reaction, producing final concentrations of each individual competitor of 37.5 and 18.8 nM, respectively.
2.13. Data analysis
All samples were run in triplicate and statistical analyses were performed on the Ct values using non-parametric one-way ANOVA (NPAIRWAY1 comparison with SAS System for Windows V.8.2 (SAS Institute Inc., Cary, NC)) with a Kruskal–Wallis test and Dunn’s post-test with an experimentwise error rate α = 0.05 (Yuan et al., 2006). When statistical analyses were performed on the Ct Differences, a one-way ANOVA (Instat for Win95/NT V.3.01; GraphPad Software, San Diego, CA) was used with a Dunnett post-test with an experimentwise error rate α = 0.05. The SEM for the Ct Difference was calculated by error propagation using the following equation: (Livak and Schmittgen, 2001).
3. Results
The five editing sites of the 5-HT2CR mRNA are illustrated in Fig. 1; the sequences and nomenclature of the TaqMan® MGB probes utilized in this study are outlined in Table 1. Our first task was to validate that each probe sensitively detects its target (complementary; matching) template and then to determine how well each discriminates templates that are not perfectly complementary (mismatched templates). The assay parameters were optimized on matched and mismatched templates under a variety of conditions to simulate expected ex vivo conditions and then were validated in RNA from mouse brain.
3.1. Validation of TaqMan® MGB probes: sensitivity and specificity
3.1.1. Sensitivity of the probes
As shown in Supplementary Material 1, there were strong correlations between the log [concentration] and resultant cycle threshold (Ct) values for each probe tested with its respective matching standard template. All correlation coefficients (r2 value) were ≥0.9999 (p ≤ 0.0001). Linearity was maintained even when standard templates were diluted between 106- and 1011-fold, demonstrating a wide dynamic range and yielding accurate Ct values until at least 34 cycles. Ct values > 35 approach those of non-template controls, and thus were considered non-specific. Efficiencies of the probes were as follows: EABECD = 0.988 (slope = −3.35); EABD = 0.879 (slope = −3.65); EAD = 0.813 (slope = −3.87); and Enon-edited = 0.926 (slope = −3.51). These values are well within or exceed the expected range of 0.65–0.9 for efficiencies of TaqMan® PCR assays (Wong and Medrano, 2005; Schefe et al., 2006; Yao et al., 2006). If the objective of an experiment is to compile quantitative isoform profiles, measurements of individual isoforms would need to be adjusted to account for differences in efficiencies of the TaqMan® 5-HT2CR MGB probes. However, when the experimental goal is to determine changes in a given isoform(s) in response to treatment, there would be no need to correct for efficiency differences. Such experiments are the ideal application of the proposed method.
3.1.2. Specificity of probes
Results of assays utilizing matched templates compared to those utilizing mismatched templates for all four probes are summarized in Table 2. Our results demonstrated that each probe unequivocally discriminated templates that differed by two or more nucleotides: the Ct Difference in most cases was >10 cycles. For example, the cross-hybridization observed for the AD probe with the ABD template (one mismatch) was 80–87% and for the D template (also one mismatch) was 32–45%. However, a cross-hybridization of <1.2% was observed for the same probe with the ABCD template (two mismatches) (Table 2). These results indicated an even greater discrimination between the probe and templates with two mismatches than that previously reported by Yao et al. (2006; 4 cycles, equivalent to 6.25% cross-hybridization). However, cross-hybridization with templates containing only a single mismatch was still considerable.
Table 2.
Specificity of 5-HT2C R TaqMan® MGB probes. Results obtained from qRT-PCR assays utilizing various mismatched standard templates (from 1 to 5 mismatches) are compared to those utilizing matched templates for all four probes. Ct Difference = Ct (mismatched template) − Ct (matched template); cross-hybridization = [1/(2Ct Difference)] × 100%. Each Ct value is the average of three replicates (mean ± SEM).
| Standard template | No. of mismatches | Ct value | p-Values (vs. matched template) | Ct Difference | Cross-hybridization (%) |
|---|---|---|---|---|---|
| ABECD | 0 | 18.177 ± 0.060 | |||
| ABCD | 1 | 19.095 ± 0.050 | p > 0.05 | 0.918 ± 0.078 | 50.139–55.869 |
| ABD | 2 | 28.455 ± 1.320 | p > 0.05 | 10.278 ± 1.321 | 0.032–0.201 |
| AD | 3 | Undetected | >15.000 | <0.003 | |
| D | 4 | Undetected | >15.000 | <0.003 | |
| Non-edited | 5 | Undetected | >15.000 | <0.003 | |
| ABD | 0 | 18.442 ± 0.138 | |||
| AD | 1 | 19.405 ± 0.067 | p > 0.05 | 0.963 ± 0.153 | 46.137–57.038 |
| ABCD | 1 | 19.964 ± 0.221 | p > 0.05 | 1.522 ± 0.161 | 31.143–38.931 |
| ABECD | 2 | 24.039 ± 0.705 | p > 0.05 | 5.597 ± 0.718 | 1.256–3.398 |
| D | 2 | Undetected | >15.000 | <0.003 | |
| Non-edited | 3 | Undetected | >15.000 | <0.003 | |
| AD | 0 | 18.559 ± 0.080 | |||
| D | 1 | 19.936 ± 0.230 | p > 0.05 | 1.377 ± 0.244 | 32.311–45.597 |
| ABD | 1 | 18.765 ± 0.080 | p > 0.05 | 0.206 ± 0.113 | 80.163–87.478 |
| ABCD | 2 | 29.128 ± 0.830 | p > 0.05 | 10.569 ± 0.834 | 0.037–1.173 |
| Non-edited | 3 | 29.609 ± 2.410 | p > 0.05 | 11.050 ± 2.411 | 0.009–0.253 |
| ABECD | 3 | Undetected | >15.000 | <0.003 | |
| Non-edited | 0 | 20.005 ± 0.240 | |||
| D | 1 | 22.466 ± 0.190 | p > 0.05 | 2.461 ± 0.306 | 14.690–22.453 |
| AD | 2 | Undetected | >15.000 | <0.003 | |
| ABD | 3 | Undetected | >15.000 | <0.003 | |
| ABCD | 4 | Undetected | >15.000 | <0.003 | |
| ABECD | 5 | Undetected | >15.000 | <0.003 |
3.2. Optimization of assay conditions
In an attempt to determine whether discrimination of single mismatches could be improved, we measured the effects of several variations of the assay conditions on Ct Difference.
3.2.1. Annealing temperature and PCR enhancers
To test whether increased annealing temperature would differentially affect probe binding to matched versus mismatched templates, we tested 60–62 °C in increments of 0.5 °C. An annealing temperature of 60.5 °C achieved small, probe-dependent increases in Ct Difference; however, annealing temperatures >61.0 °C were deleterious (data not shown). Consequently, we continued to perform the assays at the original 60.0 °C annealing temperature.
We compared the effects of several PCR enhancers (small molecules used to destabilize non-specific base pairing) on discrimination of matched versus mismatched templates. Addition of ammonium ions (60 mM tetra-methyl ammonium chloride) to the reaction mix improved discrimination by approximately one cycle for the ABECD probe only (data not shown). Inclusion of formamide (1–5%) or DMSO (1–5%) dose-dependently disrupted interactions of probes with both matched and mismatched templates (data not shown). In summary, effects of PCR enhancers on Ct values were small, probe-dependent and did not improve the discrimination between matched and mismatched templates.
3.2.2. Probe concentration
Applied Biosystems (Foster City, CA) recommends a final probe concentration between 150 and 200 nM for TaqMan® assays. Since high concentrations would be expected to increase amounts of binding (by mass action), we tested several lower probe concentrations (25, 50, 100, 125 and 150 nM) to determine whether a decrease in the final concentration of the probe would reduce cross-hybridization with singly mismatched templates. Probes were tested against 106-fold dilutions of their respective standard template stocks (as stated in Section 2). Supplementary Material 2 shows that, for template concentrations resulting in Ct values between 18 and 22 cycles, lowering the probe concentration to 100 or 125 nM did not alter the discriminative ability of the assay: the lower probe concentrations increased the Ct values of both matched and singly mismatched templates only slightly. For example, in the case of the ABECD probe, decreasing probe concentration from 150 nM (Ct value = 18.217) to 100 nM (Ct value = 18.323) increased the Ct value for the matched template by 0.106 cycles. For the singly mismatched (ABCD) template the Ct values increased from 19.694 to 19.886 (0.242 cycles). Thus, lowering the probe concentration only increased the Ct Difference by 0.136 cycles.
There were no significant changes in Ct values at probe concentrations of 100 and 125 nM relative to the initial condition of 150 nM. Decreasing probe concentration below 100 nM resulted in significant increases in Ct values of both matched templates and mismatched templates, with no improvement in the Ct Difference. Even at concentration <100 nM there were only a few Ct Differences that were statistically different than those seen at 150 nM. [For the ABECD probe (F(4,14) = 2.029, p < 0.1660); for the ABD probe (F(4,14) = 13.892, p = 0.0004); for the AD probe (F(4,14) = 1.762, p = 0.2131); for the non-edited probe (F(4,14) = 5.122, p < 0.0166); Supplementary Material 2.]
It was anticipated that ex vivo samples would contain lower abundance 5-HT2CR isoforms (Ct values > 25 but <34; unpublished data); thus, a subset of the experiment using lower template concentrations was performed to determine the effect of decreased probe concentrations on template detection (Supplementary Material 3). Decreasing the probe concentration from 150 to 100 nM had little effect on Ct Difference under these conditions. As above, only probe concentrations ≤100 nM resulted in any Ct Differences statistically different than those seen at 150 nM. [For the ABECD probe (F(2,8) = 0.1186, p = 0.8902); for the ABD probe (F(2,8) = 3.433, p = 0.1014); for the AD probe (F(2,8) = 0.0847, p = 0.9199) and for the non-edited probe (F(2,8) = 28.283, p = 0.0009).]
Since lowering the concentration of the probe to 100 nM did not alter the Ct values of the matched template when compared to the Ct values obtained with 150 nM of probe in either set of experiments (Supplementary Materials 2 and 3), we decided to use 100 nM as the final probe concentration to conserve resources and decrease the cost of the reaction.
3.3. Single mismatch discrimination
3.3.1. Addition of competitors
None of the above modifications achieved our desired discrimination criterion of Ct Difference >5 cycles for singly mismatched templates (see Section 2.7). Since commercial qRT-PCR single nucleotide polymorphism assays utilize two probes (labeled with two different fluors, one for each allele) to successfully distinguish between single nucleotide mismatches, we reasoned that the addition of an unlabeled probe complementary to the singly mismatched template (competitors) should compete with the labeled probe to diminish cross-hybridization. The theoretical basis for this is classical kinetics: the perfectly matched probe should have a greater affinity for its complement than a slightly mismatched one and should effectively compete for binding at equilibrium.
In Fig. 2A, we tested this hypothesis by measuring the effect of increasing concentrations of a single competitor on the Ct values of matching template (●) and a singly mismatched template (○) for each TaqMan® MGB probe (template dilution of 106-fold). The added competitor dramatically increased the Ct value with the mismatched template (○) in a concentration-dependent manner but had little effect on detection of the matched template (●). For example, in the absence of the ABCD competitor, the Ct value for the ABECD probe with its target template is 19.43 ± 0.39 and with the singly mismatched ABCD template is 20.73 ± 0.17. However, in the presence of 0.05 μM of the ABCD competitor, the respective values are 20.06 ± 0.13 and 23.54 ± 0.56, respectively (Fig. 2A). The inclusion of the ABCD competitor thus increased the Ct Difference from approximately 1.3–3.5 cycles (Fig. 2B) representing a decrease in the percentage of cross-hybridization from 40.6% to 8.8%. By converting all the Ct Differences to percentage cross-hybridization, the same data can be represented in a fashion that is analogous to a classical displacement curve (Fig. 2C) and clearly demonstrates the efficacy of this approach. It should be noted that the final concentration of competitors necessary to achieve the criterion of a 5 cycle Ct Difference (as interpolated from Fig. 2C) is probe-dependent and varies between approximately 0.05 and 0.25 μM for this concentration of target template. The concentration of template used in Fig. 2 are higher than those we expect to encounter in experimental samples and therefore constitute a stringent test of the ability of the competitors to improve the specificity of the reaction.
Fig. 2.

Effects of competitors on TaqMan® MGB assay. (A) Ct values for matched (●) and singly mismatched (○) templates in the presence of increasing concentrations of competitors complementary to the singly mismatched template. Competitors are: ABCD (for the ABECD probe); ABCD (for the ABD probe); ABD (for the AD probe); D (for the non-edited probe). (B) Ct Difference calculated at each concentration of competitor from the data shown in (A). (C) Percentage of cross-hybridization as a function of competitor concentration. Experiments were repeated 2–4 times for each probe, with each sample run in triplicate. In all instances, results are expressed as mean ± SEM. Where error bars are not seen, SEM is smaller than the size of the symbol.
While the addition of competitors does not measurably affect Ct values for the matched template, high final concentrations of competitors [>0.04 μM (ABECD probe), 0.05 μM (ABD probe), 0.025 μM (AD probe), and 0.25 μM (non-edited probe)] begin to decrease the plateau level of the relative fluorescence readings, resulting in decreased signal to noise (S/N) ratio (data not shown) and thus should be avoided.
3.3.2. Mixed templates (without competitors)
Previous studies have shown that multiple 5-HT2CR isoforms can be found within a tissue sample (Burns et al., 1997; Niswender et al., 1998, 2001). To more closely model this scenario, we conducted a series of assays with mixtures of standard templates (Table 3). If a TaqMan® MGB probe is most specific for its perfectly matched template, addition of mismatched template(s) to the mix should result in little cross-hybridization and thus have negligible effects on the measured Ct values of the probe target. We tested the non-edited probe and focused on mixtures of matched (non-edited template) and singly mismatched templates (A, B and D templates) because single mismatches represent the most stringent tests for accurate discrimination (Table 3). In addition, preliminary data from our laboratory with ex vivo samples (data not shown) have indicated that 5-HT2CR is present in relatively low abundance (Ct values > 25 but <34). Therefore, we set up the mixture of templates with lower concentrations of individual standard templates (total concentration equal to that in Supplementary Material 3) to more closely model expected ex vivo samples.
Table 3.
Effects of standard template mixtures on template detection by the non-edited probe. Ct values for the non-edited probe were measured for the non-edited template alone and for various combinations of A, B, and D templates, with or without the non-edited template. Ct Difference = Ct − Ct (non-edited template only). In the upper section, Ct Difference reflects cross-hybridization due to the presence of the mismatched templates: cross-hybridization = [1/(2Ct Difference)] × 100%. In the lower section, cross-hybridization is not calculated because binding of the probe to the matched template predominates. Each Ct value is the average of three replicates; results are expressed as mean ± SEM.
| Template combination | Ct value | Ct Difference | Cross-hybridization (%) |
|---|---|---|---|
| No matching template | |||
| None | >35.000 | ||
| A | >35.000 | >10.000 | <0.1 |
| B | >35.000 | >10.000 | <0.1 |
| D | 29.383 ± 0.073 | 4.204 ± 0.094 | 5.084–5.789 |
| A + B | >35.000 | >10.000 | <0.1 |
| A + D | 32.021 ± 0.692 | 6.842 ± 0.695 | 0.538–1.411 |
| B + D | 31.301 ± 0.250 | 6.112 ± 0.260 | 1.199–1.719 |
| A + B + D | 30.686 ± 0.560 | 5.507 ± 0.563 | 1.488–3.248 |
| With matching template | |||
| Non-edited | 25.176 ± 0.059 | 0.000 ± 0.084 | |
| Non-edited + A | 25.298 ± 0.050 | 0.119 ± 0.078 | |
| Non-edited + B | 25.521 ± 0.172 | 0.342 ± 0.182 | |
| Non-edited + D | 25.083 ± 0.140 | −0.095 ± 0.152 | |
| Non-edited + A + B | 25.248 ± 0.331 | 0.069 ± 0.337 | |
| Non-edited + A + D | 25.172 ± 0.127 | −0.007 ± 0.140 | |
| Non-edited + B + D | 25.283 ± 0.069 | 0.104 ± 0.091 | |
| Non-edited + A + B + D | 25.401 ± 0.038 | 0.222 ± 0.070 | |
Similar to results reported in Table 2, the non-edited probe, in the absence of its own target template, exhibited small amounts of cross-hybridization with the A, B and D standard templates, either individually (A < 0.1%, B < 0.1% and D < 6%; upper section, Table 3) or in combination (e.g., A + B < 0.1%, A + D < 2%; upper section, Table 3). As in Table 2, the Ct Difference reflects cross-hybridization due to the presence of the mismatched templates. Data in the lower section of Table 3 indicate that the non-edited probe continued to distinguish its target (non-edited) template even in the presence of the A, B and D standard templates: Ct values were not significantly different from the Ct with the non-edited template alone, suggesting that, at these concentrations, there is little or no cross-hybridization of this probe to other templates when its matched template is present in the reaction mix [X2(DF = 7, n = 23) = 9.160, p = 0.241].
3.3.3. Mixed templates: addition of multiple competitors
Data in Fig. 2 show the effects of a single competitor on the Ct value of a probe with a singly mismatched template. We expect to encounter multiple 5-HT2CR isoforms in vivo that differ from the target template by a single mismatch (Burns et al., 1997; Englander et al., 2005; Du et al., 2006). Thus, depending on the concentration of isoforms with single mismatches to a given probe, experimental assays may require the presence of several competitors to blanket the spectrum of potential cross-hybridization. We tested the effects of all the relevant competitors (those targeting the A, B, E, C and D edited sites), individually and in combination (same combinations as in Table 3), on the Ct values obtained with the non-edited probe and its target template. To minimize inhibition of plateau fluorescence levels, we began with a cocktail comprised of a low concentration of competitors (0.05 μM of each, resulting in a total final concentration of 0.25 μM). Even at these concentrations, the competitors decreased cross-hybridization of the non-edited probe with the D standard template (the only template in Table 3 that exhibited <5 cycle Ct Difference) from 5–6% to 2.47–3.45% (Ct Difference = 5.097 ± 0.240) and did not affect the Ct values of the target template (data not shown). Though the initial cross-hybridization is low at these template concentrations, these results are consistent with Fig. 2, and suggest that addition of multiple competitors improves the specificity of the assay while not changing detection of the target.
3.4. Validation of TaqMan® MGB probes in ex vivo assays
3.4.1. 5-HT2CR isoform expression in mouse brains in the absence of competitors
The RNA from whole brains derived from transgenic mouse strains (129S6 genetic background) solely expressing the fully edited ABECD (VGV) or the non-edited (INI) isoforms of 5-HT2CR were used to validate the specificity (cross-reactivity) of our four TaqMan® MGB probes in an ex vivo experimental system. Only the fully edited ABECD isoform was detected by the ABECD probe in VGV-expressing mutant mice which solely express the ABECD transcript (Fig. 3A, normalized to cyclophilin). This complete lack of cross-reactivity demonstrates that the ABD, AD or non-edited probes (2, 3 and 5 nucleotide mismatches, respectively) do not cross-hybridize with ABECD isoform cDNA. Similarly, only the non-edited isoform was detected using the non-edited probe in INI-expressing mutant mice which solely express the non-edited transcript (Fig. 3B). A similar lack of cross-reactivity by the ABECD, ABD or AD probes (5, 3 and 2 nucleotide mismatches, respectively) was observed in INI-expressing mutant mice. These results are consistent with our previous results in the well defined system using standard templates (Table 2) and indicate that the TaqMan® MGB assay accurately detects the expected 5-HT2CR isoforms.
Fig. 3.

Specificity of TaqMan® MGB probes in RNA from whole brain from genetically modified 129S6 mouse strains. (A) VGV-expressing mutant and (B) INI-expressing mutant mice. Data are normalized to cyclophilin and plotted relative to expression of (A) ABECD and (B) non-edited isoforms. The average crossing threshold (ΔCt) was calculated for each isoform studied: ΔCt = Ct (isoform of interest) − Ct (cyclophilin). Relative expression was determined by: 2−ΔΔCt where ΔΔCt = ΔCt (isoform of interest) − ΔCt (ABECD or non-edited isoform). Experiments were repeated twice for each probe, with each sample run in triplicate. In all instances, results are expressed as mean ± SEM.
Fig. 4 shows differential expression of the four 5-HT2CR isoform transcripts (normalized to cyclophilin) in brains of 129S6 and C57BL/6J mice. In 129S6 mice, we found the ABD isoform to be most prevalent; this agrees with results obtained by pyrosequencing for that strain (ABD + AD isoforms = 38%; Dr. Emeson, preliminary data) (Fig. 4; closed bars). The rank order (ABD + AD ⋙ non-edited > ABECD) and low expression levels of the non-edited and ABECD isoforms obtained by pyrosequencing for this strain (Dr. Emeson, preliminary data) are similar to the results obtained with the TaqMan® MGB assay. These data are also consistent with previously published data obtained with RNA from whole brain of C57BL/J6 mice: the ABD edited isoform is the most prevalent (Fig. 4, open bars; compare to Du et al., 2006, Table 3); the relative abundance of AD edited 5-HT2CR transcript is significantly lower than that observed for the ABD edited isoform; and the ABECD edited isoform as well as the non-edited isoforms are found in lower levels than the ABD isoform. More precise comparison to published data is not likely to be possible because editing of 5-HT2CR can be affected by minor genetic differences (such as supplier), age and life experience of the mice. The proposed technique successfully detected four 5-HT2CR edited mRNA variants in 129S6 and C57BL/6J wild-type mouse brains, in amounts and rank order similar to published data, suggesting that the method herein is suitable for the detection of these closely related mRNA sequences.
Fig. 4.

Specificity of TaqMan® MGB probes in RNA from whole brain from mouse strains. The data from the 129S6 (closed bars, n = 1) and C57BL/6J mouse strains (open bars, n = 4) are normalized to cyclophilin and plotted relative to expression of the ABD isoform for each mouse strain. The average crossing threshold (ΔCt) was calculated for each isoform studied: ΔCt = Ct (isoform of interest) − Ct (cyclophilin). Relative expression between groups was determined by: 2−ΔΔCt where ΔΔCt = ΔCt (isoform of interest) − ΔCt (ABD isoform). Experiments were repeated twice for each probe, with each sample run in triplicate. In all instances, results are expressed as mean ± SEM.
3.4.2. 5-HT2CR isoform relative expression measured in the presence of competitors
Preliminary data indicated that the Ct values obtained ex vivo are higher (data not shown) than those Ct values shown in Table 3, therefore we utilized lower concentrations of competitor for this experiment. Fig. 5 illustrates the effects of two concentrations of competitor cocktails (18.8 or 37.5 nM; see Section 2.12) employed in determinations of the relative expression of ABECD, ABD, AD and non-edited 5-HT2CR transcripts normalized to cyclophilin in whole brain from 129S6 and C57BL/6J mice. For the 129S6 strain, addition of competitor cocktail to the assay did not change the detected amounts of the four isoforms compared to control (absence of competitor): ABECD [X2(DF = 2, n = 9) = 7.200, p = 0.0036], ABD [X2(DF = 2, n = 9) = 5.600, p = 0.0500], AD [X2(DF = 2, n = 9) = 5.600, p = 0.0500] and non-edited probes [X2(DF = 2, n = 9) = 4.622, p = 0.1000]. However, for the C57BL/6J strain, the relative expression of the AD [X2(DF = 2, n = 12) = 9.8462, p < 0.001] and ABECD isoforms [X2(DF = 2, n = 12) = 9.2692, p < 0.001] decreased significantly in the presence of the higher concentration of the competitor cocktail. The relative expression of the ABD [X2(DF = 2, n = 12) = 7.7308, p = 0.0066] and non-edited isoforms [X2(DF = 2, n = 12) = 2.000, p = 0.3967] was unaffected by addition of competitor cocktails. These data suggest that the precision of measurement of the AD and ABECD isoforms in brains of C57BL/6J mice is improved by addition of competitors but addition of competitors is not required for the measurement of ABECD, ABD, AD and non-edited isoforms in whole brains of 129S6 mice.
Fig. 5.

Effect of competitors on 5-HT2C R RNA isoform profiles of mouse strains. Relative expression levels in (A) 129S6 and (B) C57BL/6J mouse strains in the absence and presence of competitors. The relative quantification method was used to compare 5-HT2C R samples (www.appliedbiosystems.com/). The average crossing threshold (ΔCt) was calculated for each isoform studied: ΔCt = Ct (isoform of interest) − Ct (cyclophilin). Relative expression between groups was determined by: 2−ΔΔCt where ΔΔCt = ΔCt (isoform of interest) − ΔCt (ABD isoform of control (no competitor). Experiments were repeated twice for each probe, with each sample run in triplicate. In all instances, results are expressed as mean ± SEM. *p < 0.001 vs. no competitor.
4. Discussion
A precise and rapid assay to establish changes in levels of relative expression of specific brain 5-HT2CR RNA isoforms is needed to move forward our understanding of the biology of RNA editing in the brain. We have advanced this goal by adapting a qRT-PCR method to detect and quantify relative changes in edited 5-HT2CR RNA isoforms by utilizing MGB TaqMan® probes. Probes for a series of four closely related 5-HT2CR isoforms were designed to test the sensitivity and discriminative ability of the proposed assay. After confirming these characteristics against standardized templates, we tested the ex vivo cross-reactivity of the four TaqMan® MGB probes (ABECD, ABD, AD and non-edited) against cDNA samples derived from transgenic mouse strains solely expressing the ABECD or non-edited 5-HT2CR isoform. We found that both the ABECD and the non-edited isoforms were detected accurately by their respective probes without cross-reactivity, demonstrating that this technique can sensitively measure target isoforms and discriminate closely related isoforms extracted from tissue samples.
The ex vivo sensitivity and specificity of these probes was further verified in RNA isolated from whole brain of 129S6 and C57BL/6J mice. The relative values of the four isoforms measured were similar to those predicted from DNA sequencing data in both 129S6 (Emeson, preliminary data) and C57BL/6J mouse brain (Du et al., 2006), suggesting that the described method is suitable for the detection of closely related mRNA sequences in ex vivo samples. The current TaqMan® MGB assay detected a rank order of isoform abundance of ABD ⋙ ABECD ≈ non-edited ≈ AD (Fig. 4). DNA sequencing analysis of RNA from C57BL/6J mouse whole brain indicated a rank order of abundance of ABD ⋙ non-edited ≈ AD ≈ ABECD (Du et al., 2006). Both the TaqMan® (present results) and DNA sequencing (Du et al., 2006) techniques detected the ABD isoform as the most abundant isoform with the other three isoforms present in much lower amounts. This consistency between the TaqMan® method and published data on the relative abundance of different isoforms is reassuring and suggests the usefulness of the TaqMan® MGB probes to measure disease- or treatment-related changes in individual isoforms ex vivo.
The discriminatory ability of the TaqMan® MGB probes can be enhanced by the addition of unlabeled competitors, either singly or as a cocktail (Fig. 2 and Table 3). This simple adjustment represents a major advancement in the utility of the method for routine applications. Addition of competitors did not alter the Ct values of the ABECD and non-edited isoforms in VGV- and INI-expressing mutant mice, respectively suggesting that addition of competitors do not interfere with the detection of the target sample (data not shown). For C57BL/6J mouse brain, there were small differences in the amount of ABECD and AD isoforms detected with the addition of 37.5 nM competitor (Fig. 5), although the rank order of abundance was not changed [ABD ⋙ ABECD ≈ non-edited ≈ AD]. These data strongly suggest that the observed decrease in detection of the ABECD and AD isoforms in cDNA samples from whole brain of C57BL/6J mice upon the addition of the competitor cocktail is due to a reduction of cross-reactivity of the respective probes to other 5-HT2CR isoforms. In cDNA samples from whole brain of 129S6 mice, increasing concentrations of competitors did not alter Ct values for the four isoforms suggesting that the need for competitor cocktails is specific to the system under study. For probes not characterized herein, appropriate concentrations of competitor cocktails will need to be estimated using standard templates at concentrations approximating the Ct values of each isoform in the particular ex vivo system under study (Fig. 5). When a series of experiments is initiated, it will be an easy matter to compare Ct values for each isoform of interest obtained with and without competitors to establish the necessity (and concentration) of competitor cocktail (as in Fig. 5). Since high concentrations decrease plateau fluorescence, there are limits to the total amount of competitors (singly or as a cocktail) that can be added to a reaction. For example, concentrations of competitors above 0.25 μM for the non-edited probe utilized with standard templates altered the detection of high concentrations of the target template (Fig. 3). However, lower concentrations of competitors, such as the ones used in Fig. 5, may prove to be sufficient for ex vivo systems.
The labor-intensive direct DNA sequencing (e.g., Burns et al., 1997; Gurevich et al., 2000a) and pyrosequencing methods (Iwamoto et al., 2005; Sodhi et al., 2005) provide unambiguous results and have been used as a “gold standard” in the measurement of the entire profile of mRNA editing. This new TaqMan® MGB method addresses several drawbacks for the study of editing ex vivo. With the TaqMan® MGB assay, measurements are performed directly on cDNA reverse transcribed from isolated RNA. Elimination of the subsequent processing steps increases the speed of data collection and eliminates several sources of error. In direct sequencing and pyrosequencing, each sequenced colony represents a single transcript of RNA within a single sample. While several hundred sequences per sample is a large number to analyze, it is, statistically speaking, a very small number of mRNA molecules. Sodhi et al. (2005) also point out the statistical bias that can result from small sampling size per subject; such concerns would be moot with the present approach because the proposed qRT-PCR method samples the entire population of mRNA transcripts unlike the small subset of transcripts assessed in sequencing methods. Measurement of the entire population of mRNA transcripts in a sample would reduce or eliminate the errors generated due to sampling bias, resulting in more precise measurements and greater statistical discrimination among experimental groups (Wong and Medrano, 2005; Yao et al., 2006). By focusing on only the isoforms of interest based upon the experimental question in hand, the proposed method will bypass the need to characterize the entire isoform profile, thus requiring only a single measurement (rather than hundreds) for each experimental subject. This, in turn, will facilitate the use of a greater number of subjects per study group.
The choice of specific mRNA species for normalization will depend upon the nature of the study being conducted. Normalization to a classical housekeeping gene, such as cyclophilin or actin, is useful to allow expression of isoform level proportionate to cell number. In the present studies, we have normalized our ex vivo data to cyclophilin and then set the value of the most abundant isoform to 100% (ABECD and non-edited in Fig. 3; ABD in Figs. 4 and 5). Setting the normalized value of the expected isoform to 100% clearly conveys the results with no additional manipulations necessary. An additional normalization step using total 5-HT2CR mRNA could describe expression of isoforms as a percentage of total 5-HT2CR mRNA but such analysis would require that measurements of total 5-HT2CR and all individual isoforms be corrected to account for differences in efficiencies among TaqMan® MGB probes. Data obtained with those probes would need to be adjusted in order to calculate percentages appropriately (Schefe et al., 2006; Rebrikov and Trofimov, 2006; Schmittgen and Livak, 2008). However, there are several caveats to this approach. First, and most importantly, such corrections are not necessary when the goal is to measure disease- or treatment-related changes in individual isoforms because the average reaction efficiency to measure a single isoform ex vivo will be the same whether analyzed before or after a given manipulation (Schmittgen and Livak, 2008). Second, the algorithms to correct for probe-to-probe and sample-to-sample differences in efficiency vary among the available online software packages (e.g., LinRegPCR, GenEx, and REST; http://www.efficiency.gene-quantification.info; University of Amsterdam, Amsterdam, The Netherlands) (Rebrikov and Trofimov, 2006). There is currently no consensus for the choice of one correction method over the others. Third, the multiple calculations performed during the correction process can vastly increase the amount of error in the final comparisons. Such manipulations are essential when the goal is to obtain absolute values (i.e., copy numbers) or to measure complete 5-HT2CR isoform profiles, but are not necessary when the goal is to measure disease- or treatment-related changes in individual isoforms ex vivo (Schmittgen and Livak, 2008).
The TaqMan® MGB method allows relative quantification of edited isoforms of 5-HT2CR mRNA in a rapid and cost-effective manner. Purchase of MGB-labeled probes (about $250 each for 6000 pmol from Applied Biosystems) represents an initial expense but is sufficient for measuring a large number of samples (5000 reactions at a final probe concentration of 100 nM). Once assays for isoforms of particular genes have been developed, large quantities of data can be obtained in a relatively short time (Wong and Medrano, 2005; Yao et al., 2006). This method will be particularly useful to study changes in levels of specific isoforms in response to pharmacological, behavioral or genetic manipulations ex vivo without the necessity of measuring an entire profile for each experimental sample. Following an initial survey of isoform profiles by DNA sequencing, assays can be designed to specifically target one (or a few) isoform(s) of interest and rapidly assess changes in expression levels following treatment or to correlate with disease state, behavioral activity, or other parameter. In addition, the qRT-PCR method also will enable investigators to study the impact of treatment-elicited changes in less abundant isoforms because of the increased precision of the assay.
Another approach to the quantitative assessment of 5-HT2CR edited isoform profiles has been published recently (Poyau et al., 2007). Following reverse transcription and nested PCR (in which the second round of PCR incorporates different fluorescent labels onto the forward and reverse cDNA strands), these authors used capillary electrophoresis (CE) to separate the single stranded products. Results were quantified by comparison to similarly prepared standards. The CE method approach is very promising for entire isoform profiles, particularly if researchers have access to the appropriate equipment. This method, however, may require significantly more time and technical expertise than the present TaqMan® MGB method, especially when only one or a few isoforms need to be measured.
In summary, the method to measure RNA edited isoforms described here for brain is a novel and innovative application of TaqMan® technology with the potential to broaden our knowledge of the function and regulation of RNA editing for the brain 5-HT2CR. The general technique can be adapted easily to the study of other multiply edited RNAs and should facilitate the development of a knowledge base to address broader issues of the physiological roles of RNA editing. With the advent of increasing numbers of qRT-PCR equipment and core facilities, this technique has the potential for widespread application by laboratories without in-house DNA sequencing or capillary electrophoresis equipment. With the discovery of ever-increasing numbers of edited mRNAs in brain or other tissues, a rapid method to measure changes in multiply edited RNA isoforms following pharmacological, behavioral or genetic manipulations should have wide applicability. The increased capabilities afforded by this new application will accelerate the pace of discovery in discerning the role of RNA editing in normal physiology and in disease processes.
Supplementary Material
Acknowledgments
This research was supported by the National Institute on Drug Abuse grants DA006511, DA000260, DA020087 (K.A.C.); NS033323 (R.B.E.) and by the Peter F. McManus Charitable Trust (K.A.C.). We would like to thank Dr. Concepcion Diaz-Arrastia, MD, Assistant Professor, Gynecologic Oncology at (UTMB) for providing access to the 7500 Fast real-time PCR equipment for our studies. We also thank Drs. William Clarke and Kelly Berg for kindly providing the plasmid containing the cDNA for the 5-HT2CR non-edited isoform used in our studies.
Appendix A. Supplementary data
Supplementary data associated with this article can be found, in the online version, at doi:10.1016/j.jneumeth.2009.01.027.
References
- Bass BL. RNA editing by adenosine deaminases that act on RNA. Annu Rev Biochem. 2002;71:817–46. doi: 10.1146/annurev.biochem.71.110601.135501. [DOI] [PMC free article] [PubMed] [Google Scholar]
- Benne R, van den Burg J, Brakenhoff JP, Sloof P, Van Boom JH, Tromp MC. Major transcript of the frameshifted coxII gene from trypanosome mitochondria contains four nucleotides that are not encoded in the DNA. Cell. 1986;46:819–26. doi: 10.1016/0092-8674(86)90063-2. [DOI] [PubMed] [Google Scholar]
- Berg KA, Cropper JD, Niswender CM, Sanders-Bush E, Emeson RB, Clarke WP. RNA-editing of the 5-HT(2C) receptor alters agonist-receptor-effector coupling specificity. Br J Pharmacol. 2001;134:386–92. doi: 10.1038/sj.bjp.0704255. [DOI] [PMC free article] [PubMed] [Google Scholar]
- Bubar MJ, Cunningham KA. Prospects for serotonin 5-HT2 receptor pharmacotherapy in psychostimulant abuse. Prog Brain Res. 2008;172:319–46. doi: 10.1016/S0079-6123(08)00916-3. [DOI] [PubMed] [Google Scholar]
- Burns CM, Chu H, Rueter SM, Hutchinson LK, Canton H, Sanders-Bush E, et al. Regulation of serotonin-2C receptor G-protein coupling by RNA editing. Nature. 1997;387:303–8. doi: 10.1038/387303a0. [DOI] [PubMed] [Google Scholar]
- Chevet E, Lematitre G, Doron Katinka M. Low concentrations of tetramethylammonium chloride increase yield and specificity of PCR. Nucleic Acids Res. 1995;23:3343–4. doi: 10.1093/nar/23.16.3343. [DOI] [PMC free article] [PubMed] [Google Scholar]
- Clemett DA, Punhani T, Duxon MS, Blackburn TP, Fone KCF. Immunohistochemical localization of the 5-HT2C receptor protein in the rat CNS. Neuropharmacology. 2000;39:123–32. doi: 10.1016/s0028-3908(99)00086-6. [DOI] [PubMed] [Google Scholar]
- Cruz-Reyes J, Rusche LN, Piller KJ, Sollner-Webb B. T. brucei RNA editing: adenosine nucleotides inversely affect U-deletion and U-insertion reactions at mRNA cleavage. Mol Cell. 1998;1:401–9. doi: 10.1016/s1097-2765(00)80040-4. [DOI] [PubMed] [Google Scholar]
- Decker K, Trager T, Missel A, Heitz K, Kobsch S, Machura K, et al. Optimizing probe hybridization in real-time PCR for quantification and SNP genotyping. Qiagen News. 2002;4:13–6. [Google Scholar]
- Dracheva S, Chin B, Haroutunian V. Altered serotonin 2C receptor RNA splicing in suicide: association with editing. Neuroreport. 2008;19:379–82. doi: 10.1097/WNR.0b013e3282f556d2. [DOI] [PubMed] [Google Scholar]
- Dracheva S, Patel N, Woo DA, Marcus SM, Siever LJ, Haroutunian V. Increased serotonin 2C receptor mRNA editing: a possible risk factor for suicide. Mol Psychiatry. 2007;19:379–82. doi: 10.1038/sj.mp.4002081. [DOI] [PubMed] [Google Scholar]
- Dracheva S, Elhakem SL, Marcus SM, Siever LJ, McGurk SR, Haroutunian V. RNA editing and alternative splicing of human serotonin 2C receptor in schizophrenia. J Neurochem. 2003;87:1402–12. doi: 10.1046/j.1471-4159.2003.02115.x. [DOI] [PubMed] [Google Scholar]
- Du Y, Davisson MT, Kafadar K, Gardiner K. A-to-I pre-mRNA editing of the serotonin 2C receptor: comparisons among inbred mouse strains. Gene. 2006;382:39–46. doi: 10.1016/j.gene.2006.06.007. [DOI] [PubMed] [Google Scholar]
- Englander MT, Dulawa SC, Bhansali P, Schmauss C. How stress and fluoxetine modulate serotonin 2C receptor pre-mRNA editing. J Neurosci. 2005;25:648–51. doi: 10.1523/JNEUROSCI.3895-04.2005. [DOI] [PMC free article] [PubMed] [Google Scholar]
- Fitzgerald LW, Iyer G, Conklin DS, Krause CM, Marshall A, Patterson JP, et al. Messenger RNA editing of the human serotonin 5-HT2C receptor. Neuropsychopharmacology. 1999;21:82S–90S. doi: 10.1016/S0893-133X(99)00004-4. [DOI] [PubMed] [Google Scholar]
- Giorgetti M, Tecott LH. Contribution of the 5-HT2C receptors to multiple actions of central serotonin systems. Eur J Pharmacol. 2004;488:1–9. doi: 10.1016/j.ejphar.2004.01.036. [DOI] [PubMed] [Google Scholar]
- Gurevich I, Tamir H, Arango V, Dwork AJ, Mann JJ, Schmauss C. Altered editing of serotonin 2C receptor pre-mRNA in the prefrontal cortex of depressed suicide victims. Neuron. 2002a;34:349–56. doi: 10.1016/s0896-6273(02)00660-8. [DOI] [PubMed] [Google Scholar]
- Gurevich I, Englander MT, Adlersberg M, Siegal NB, Schmauss C. Modulation of serotonin 2C receptor editing by sustained changes in serotonergic neurotransmission. J Neurosci. 2002b;22:10529–32. doi: 10.1523/JNEUROSCI.22-24-10529.2002. [DOI] [PMC free article] [PubMed] [Google Scholar]
- Herrick-Davis K, Grinde E, Niswender CM. Serotonin 5-HT2C receptor RNA editing alters receptor basal activity: implications for serotonergic signal transduction. J Neurochem. 1999;73:1711–7. doi: 10.1046/j.1471-4159.1999.731711.x. [DOI] [PubMed] [Google Scholar]
- Hoopengardner B, Bhalla T, Staber C, Reenan R. Nervous system targets of RNA editing identified by comparative genomics. Science. 2003;301:832–6. doi: 10.1126/science.1086763. [DOI] [PubMed] [Google Scholar]
- Igo RP, Jr, Weston DS, Ernst NL, Panigrahi AK, Salavati R, Stuart K. Role of uridylate-specific exoribonuclease activity in Trypanosoma brucei RNA editing. Eukaryot Cell. 2002;1:112–8. doi: 10.1128/EC.1.1.112-118.2002. [DOI] [PMC free article] [PubMed] [Google Scholar]
- Iwamoto K, Bundo M, Kato T. Estimating RNA editing efficiency of five editing sites in the serotonin 2C receptor by pyrosequencing. RNA. 2005;11:1596–603. doi: 10.1261/rna.2114505. [DOI] [PMC free article] [PubMed] [Google Scholar]
- Kutyavin IV, Afonina IA, Mills A, Gorn VV, Lukhtanov EA, Belousov ES, et al. 3′-minor groove binder-DNA probes increase sequence specificity at PCR extension temperatures. Nucleic Acids Res. 2000;28:655–61. doi: 10.1093/nar/28.2.655. [DOI] [PMC free article] [PubMed] [Google Scholar]
- Livak KJ, Schmittgen TD. Analysis of relative gene expression data using real-time quantitative PCR and the 2−ΔΔCt method. Methods. 2001;25:402–8. doi: 10.1006/meth.2001.1262. [DOI] [PubMed] [Google Scholar]
- Marion S, Weiner DM, Caron MG. RNA editing induces variation in desensitization and trafficking of 5-hydroxytryptamine 2c receptor isoforms. J Biol Chem. 2004;279:2945–54. doi: 10.1074/jbc.M308742200. [DOI] [PubMed] [Google Scholar]
- Maydanovych O, Beal PA. Breaking the central dogma by RNA editing. Chem Rev. 2006;106:3397–411. doi: 10.1021/cr050314a. [DOI] [PubMed] [Google Scholar]
- Niswender CM, Sanders-Bush E, Emeson RB. Identification and characterization of RNA editing events within the 5-HT2C receptor. Ann NY Acad Sci. 1998;861:38–48. doi: 10.1111/j.1749-6632.1998.tb10171.x. [DOI] [PubMed] [Google Scholar]
- Niswender CM, Copeland SC, Herrick-Davis K, Emeson RB, Sanders-Bush E. RNA editing of the human serotonin 5-hydroxytryptamine 2C receptor silences constitutive activity. J Biol Chem. 1999;274:9472–8. doi: 10.1074/jbc.274.14.9472. [DOI] [PubMed] [Google Scholar]
- Niswender CM, Herrick-Davis K, Dilley GE, Meltzer HY, Overholser JC, Stockmeier CA, et al. RNA editing of the human serotonin 5-HT2C receptor. Alterations in suicide and implications for serotonergic pharmacotherapy. Neuropsychopharmacology. 2001;24:478–91. doi: 10.1016/S0893-133X(00)00223-2. [DOI] [PubMed] [Google Scholar]
- Pasqualetti M, Ori M, Castagna M, Marazziti D, Cassano GB, Nardi I. Distribution and cellular localization of the serotonin type 2C receptor messenger RNA in the human brain. Neuroscience. 1999;92:601–11. doi: 10.1016/s0306-4522(99)00011-1. [DOI] [PubMed] [Google Scholar]
- Poyau A, Vincent L, Berthomme H, Paul C, Nicolas B, Pujol JF, et al. Identification and relative quantification of adenosine to inosine editing in serotonin 2c receptor mRNA by CE. Electrophoresis. 2007;28:2843–52. doi: 10.1002/elps.200600698. [DOI] [PubMed] [Google Scholar]
- Samuel CE. RNA editing minireview series. J Biol Chem. 2003;278:1389–90. doi: 10.1074/jbc.R200032200. [DOI] [PubMed] [Google Scholar]
- Sanders-Bush E, Fentress H, Hazelwood L. Serotonin 5-ht2 receptors: molecular and genomic diversity. Mol Interv. 2003;3:319–30. doi: 10.1124/mi.3.6.319. [DOI] [PubMed] [Google Scholar]
- Schefe JH, Lehmann KE, Buschmann IR, Unger T, Funke-Kaiser H. Quantitative real-time RT-PCR data analysis: current concepts and the novel “gene expression’s CT difference” formula. J Mol Med. 2006;84:901–10. doi: 10.1007/s00109-006-0097-6. [DOI] [PubMed] [Google Scholar]
- Schmittgen TD, Livak KJ. Analyzing real-time PCR data by the comparative CT method. Nat Protocols. 2008;3:1101–8. doi: 10.1038/nprot.2008.73. [DOI] [PubMed] [Google Scholar]
- Sodhi MS, Airey DC, Lambert W, Burnet PW, Harrison PJ, Sanders-Bush E. A rapid new assay to detect RNA editing reveals antipsychotic-induced changes in serotonin 2C transcripts. Mol Pharmacol. 2005;68:711–9. doi: 10.1124/mol.105.014134. [DOI] [PubMed] [Google Scholar]
- Sodhi MS, Burnet PW, Makoff AJ, Kerwin RW, Harrison PJ. RNA editing of the 5-HT(2C) receptor is reduced in schizophrenia. Mol Psychiatry. 2001;6:373–9. doi: 10.1038/sj.mp.4000920. [DOI] [PubMed] [Google Scholar]
- Rebrikov DV, Trofimov DY. Real-time PCR: a review of approaches to data analysis. Biochem Microbiol. 2006;42:455–63. [PubMed] [Google Scholar]
- Varadaraj K, Skinner DM. Denaturants or cosolvents improve the specificity of PCR amplification of a G + C-rich DNA using genetically engineered DNA polymerases. Gene. 1994;140:1–5. doi: 10.1016/0378-1119(94)90723-4. [DOI] [PubMed] [Google Scholar]
- Wong ML, Medrano JF. Real-time PCR for mRNA quantitation. Biotechniques. 2005;39:75–85. doi: 10.2144/05391RV01. [DOI] [PubMed] [Google Scholar]
- Yang JH, Sklar P, Axel R, Maniatis T. Editing of glutamate receptor subunit B pre-mRNA in vitro by site-specific deamination of adenosine. Nature. 1995;374:77–81. doi: 10.1038/374077a0. [DOI] [PubMed] [Google Scholar]
- Yao Y, Nellaker C, Karlsson H. Evaluation of minor groove binding probe and Taq-Man probe PCR assays: influence of mismatches and template complexity on quantification. Mol Cell Probes. 2006;20:311–6. doi: 10.1016/j.mcp.2006.03.003. [DOI] [PubMed] [Google Scholar]
- Yuan JS, Reed A, Chen F, Stewart CN., Jr Statistical analysis of real-time PCR data. BMC Bioinformatics. 2006;7:85–96. doi: 10.1186/1471-2105-7-85. [DOI] [PMC free article] [PubMed] [Google Scholar]
Associated Data
This section collects any data citations, data availability statements, or supplementary materials included in this article.