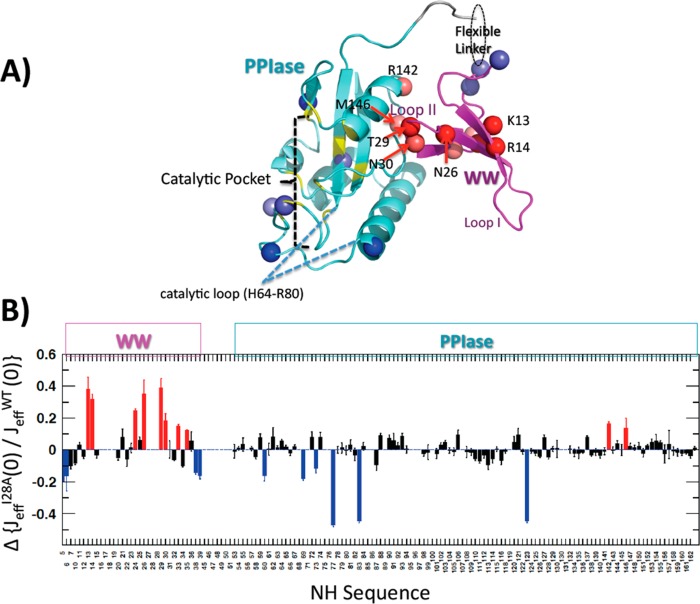
Figure 5.
(A) Pin1 colored to highlight changes in backbone NH dynamics in apo I28A compared with apo WT. Ribbons colored aquamarine, magenta, and yellow indicate the PPIase, WW, and PPIase catalytic site regions, respectively. The red/blue spheres are NHs with outlying values of JeffI28A(0)/Jeff(0) (ratio values >1 standard deviation from the domain-specific trimmed mean). Red spheres highlight NH sites showing enhanced exchange dynamics, whereas blue spheres are sites with enhanced subnanosecond flexibility. (B) Bar graph showing the data underlying panel A. The bars are deviations of NH JeffI28A(0)/Jeff(0) from the domain-specific trimmed means. Red/blue bars correspond to the red/blue spheres in (A).

