Abstract
Purpose
In this paper, we present a new algorithm as an enhancement and preprocessing step for acquired optical coherence tomography (OCT) images of retina.
Methods
The proposed method is composed of two steps, first of which is a denoising algorithm with wavelet diffusion based on circular symmetric Laplacian model, and the second part can be described in the terms of graph based geometry detection and curvature correction according to the hyper-reflective complex (HRC) layer in retina.
Results
The proposed denoising algorithm showed an improvement of contrast to noise ratio from 0.89 to 1.49 and an increase of signal to noise ratio (OCT image SNR) from 18.27 dB to 30.43 dB. By applying the proposed method for estimation of the interpolated curve using a full automatic method, mean ± SD unsigned border positioning error was calculated for normal and abnormal cases. The error values of 2.19±1.25 micrometers and 8.53±3.76 micrometers were detected for 200 randomly selected slices without pathological curvature and 50 randomly selected slices with pathological curvature, respectively.
Conclusions
The important aspect of this algorithm is its ability in detection of curvature in strongly pathological images that surpasses the previously introduced methods; the method is also fast, compared to relatively low speed of the similar methods.
Keywords: Ophthalmology, optical coherence tomography, graph theory, curvature correction
1. INTRODUCTION
Optical coherence tomography (OCT) is a recently established imaging technique capable of depicting internal structure of an object [1]. OCT uses the principle of low coherence interferometry to generate two- or three-dimensional images of biological samples by obtaining high-resolution cross-sectional backscattering profiles (Figure 1 shows a sample of OCT obtained from human retina). Despite the fact that OCT technology has been known since 1991, OCT image segmentation is a relatively recent area of research. To provide successful diagnosis of retinal diseases, OCT datasets should be interpreted as distinct anatomical layers. Since qualitative interpretation can only discover severe irregularities, measurable segmentation is needed and in order to avoid time-consuming and objective results in manual labeling, automatic segmentation methods are introduced. A variety of successful algorithms for computer-aided analysis of retinal OCT images are presented in the literature, but the robust use in clinical practice is still a major challenge for ongoing research in OCT image analysis [2, 3].
Fig. 1.
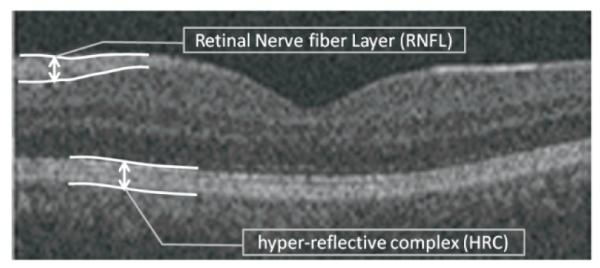
An example retinal OCT image captured using Zeiss SD-OCT Cirrus machine (Carl Zeiss Meditec Inc., Dublin, CA, USA).
Most of current works on OCT image analysis consist of an enhancement and preprocessing step before any main processing (like intra-layer segmentation, vessel segmentation, etc.). Preprocessing of acquired images may refer to algorithms ranging from removal of intrinsic speckle noise to curvature correction of images [4-18].
OCT images carry a multiplicative speckle noise, caused by coherent processing of backscattered signals from multiple distributed targets. Table 1 shows a classification of denoising algorithms employed in OCT segmentation. The methods like median filtering, low pass filtering and linear smoothing suffered from inevitable smoothing. Ringing artifact was also unavoidable when using wavelet shrinkage. Many papers utilized nonlinear anisotropic filters to overcome unwanted smoothing; however, the time complexity of anisotropic filtering restricted the method only to research papers rather than real applications. The proposed denoising method in this paper is a fast implementation of nonlinear anisotropic filters named wavelet diffusion. We modified the wavelet diffusion method for automatic selection of threshold by introduction of new models for speckle related modulus.
TABLE 1.
A classification of enhancement and preprocessing algorithms employed in researches on OCT segmentation
| Publications | Enhancement and preprocessing method |
|---|---|
| Hee, M.R.[3] | low-pass filtering |
| Huang, Y.[1] | 2D lineal smoothing |
| George, A.[4], Koozekanani, D.[5], Herzog, A.[6], Shahidi, M.[7],Shrinivasan, VJ.[8], Lee, K.[9] and Boyer, K.[10] |
median filter |
| Ishikawa, H. [11],Mayer, M.[12] | mean filter |
| Baroni,M. [13] | Two 1D filters: 1) median filtering along the A-scans; 2) Gaussian kernel in the longitudinally direction |
| Bagci, A.M. [14] | Directional filtering |
| Mishra, A. [15] | adaptive vector-valued kernel function |
| Fuller, A.R.[16] | SVM approach |
| Quellec ,G.[17] | wavelet shrinkage |
| Gregori, G.[18], Garvin, M.[19], Cabrera Fernandez, D.[20] | non-linear anisotropic filter |
| Yazdanpanah, A.[21] , Abramoff, M.D. [22], Yang, Q.[23] | none |
Furthermore, vertical scans (A-scans) of retinal OCTs captured from one subject are usually aligned as a preprocessing step of acquired images (curvature correction). Two reasons exist to justify the need for such an alignment: to aid the final 3D segmentation and to allow for better visualization [19]. Hyper-reflective complex (HRC) corresponds to photoreceptors’ inner and outer segments, retinal pigment epithelium (RPE) and choriocapillaris. We assume that HRC is undisturbed and the whole retinal profile underwent a low spatial-frequency distortion caused by the curvature of the eye and patient motion during acquisition. Therefore, curvature correction according to the HRC layer will align the retinal OCTs. Figure 1 demonstrates the location of HRC in retinal OCTs. The task of localizing the HRC may be categorized as a segmentation problem, too; however, since many newly developed methods for intra-retinal layer segmentation in OCT images start the segmentation after curvature correction, we preferred to place this step into the preprocessing category. The task of localization for this layer can be really complicated in the presence of noise and pathological artifacts.
Many papers just try to align the vertical scans (A-Scans) based on cross correlation of each A-Scan with adjacent vertical scans. Such a task is not reliable in noisy images and fails in presence of pathological curvatures. Namely, the curvatures caused by pathological artifacts should be retained because of being the most effective indicators of diseases, but cross-correlations will remove any possible curvature in HRC. Similar studies on localization of the HRC are pertaining to two significant groups. The methods in the first group are either looking for maxima in each column of the OCT images (1D search) [1, 3-8, 11, 18] or seeking the highest values in intensity or vertical gradients of the 2D OCTs [10, 12, 14]. The drawback of such algorithms is their extreme dependency on intensity variations due to intrinsic speckle noise of the OCT images. Therefore, they could not localize the boundaries in images with poor quality and in presence of blood vessel artifacts.
The methods in the second group are mostly utilizing graph-based algorithms [13, 19, 21-23] which show more robustness to noise and can handle the localization problem in images lacking quality and even in the presence of blood vessel artifacts. The main aspect behind most of such methods was construction of graph nodes from each pixel of the OCT image and looking for the shortest path or minimum-cost closed set in a geometric graph. Dynamic programming was also used to improve the time complexity of some methods in [13, 23]. Despite the undeniable superiority of the methods in the second group over the simpler methods in the first group, allocation of one pixel to each node of the graph made the resultant graphs very big and the solution very complicated.
In this paper, we present a new 3D OCT curvature correction algorithm which uses the graph based geometry detection to localize the HRC complex. In order to overcome the problem associated with large sizes of the constructed graphs, a new method is introduced to allocate only a subgroup of pixels in OCT images to the graph nodes. Furthermore, a new aspect is proposed to replace the shortest path algorithm which has some similarities with dynamic programming algorithm.
The combination of two preprocessing steps (circular symmetric Laplacian based wavelet diffusion for denoising and graph-based geometry detection for curvature correction) showed acceptable results in OCT images (even in images lacking quality). The important aspect of this algorithm is its ability in aligning the strongly damaged images (from patients with retinal pathologies like drusen or fluid filled regions) that surpasses the previously introduced methods; the method is also fast, compared to relatively low speed of the similar methods.
2. MATERIAL AND METHODS
The proposed method is composed of two steps, first of which is denoising based on wavelet diffusion, and the second part can be described in terms of graph based geometry detection and curvature correction according to the HRC layer. The proposed data in this paper are from 3D SD-OCT (200×200×1024 pixels covering 6× 6×2 mm3, with a voxel size of 30 × 30 × 2 μm3, and the voxel depth of 8 bits in grayscale) data-set captured using Zeiss SD-OCT Cirrus machine (Carl Zeiss Meditech., Inc., Dublin, CA, USA). The proposed algorithms were tested on images acquired by the OCT unit. The OCT scanner, as part of its operation, performs basic processing of SD-OCT image data. No additional preprocessing was applied to the OCT data prior to the main image processing tasks.1
2.1. Denoising
OCT image denoising problem is better solved if a powerful signal/noise separating tool (e.g., wavelet analysis) is incorporated in the noise-reducing process like nonlinear diffusion. The combination of wavelet analysis with nonlinear diffusion is named wavelet diffusion. In simple words, multiresolution and sparsity properties of wavelet transform on the top of edge preservation ability of nonlinear diffusion can make a significant help to the noise reduction process [24]. Furthermore, the time complexity of this joined method is considerably lower than conventional nonlinear diffusion.
The steps of wavelet diffusion can be outlined as follows [25]:
* Wavelet decomposition into low-frequency subband (Aj) and high-frequency subbands .
* Regularization of high-frequency coefficients with multiplication by a function p.
* Wavelet reconstruction from low-frequency subband (Aj) and regularized high frequency subbands .
Regularization is the second step of the algorithm and the regularization function should be defined as:
| (1) |
where ∣ηjj(x,y)∣ is a value which estimates the sharpness of a possible edge in (x,y) at scale j. The approximate ∣ηj(x,y)∣ can be calculated from modulus of high frequency wavelet subbands at each scale j by:
| (2) |
The selection of a proper value for the constant λ (in eq. 1) has a profound effect on performance of the denoising algorithm [26]. According to what we proposed in [26], λ is calculated based on the information obtained from a homogenous area in the image. The homogenous area was found automatically using a likelihood classification and cross-scale edge consistence. The classification of the image into homogenous and non-homogenous areas is subject to correct modeling of the distribution of wavelet modulus. We proposed a circular symmetric Laplacian mixture model for this distribution in [26]. It could be an acceptable model for the data because of its compatibility with heavy tailed structure and inter-scale dependency of wavelet coefficients. More details about this algorithm, its abilities, the time complexity, and the contrast to noise ratio (CNR) are elaborated in [26].
2.2.Extraction of HRC and curvature correction
After performing the noise removal algorithm described in section 2.1, the next proposed step is curvature correction of vertical scans of the OCT image (curvature correction). We present a new curvature correction which uses the graph based geometry detection to localize the HRC complex. The main aspect behind most of graph based algorithms is construction of graph nodes from one pixel of the OCT image. Such an approach leads to high complexity and high dimensionality.
In this application, we need to detect the retinal HRC layer to be used in curvature correction. Therefore we restrict the graph point selection to an area around the HRC layer. For this purpose, we find the points the brightness of which exceeds a half of the maximum gray level in the image. Then, a morphological erosion algorithm using a square shaped structural element (with 3 pixels in width and height) is applied and followed by a morphological bridge algorithm (by “bwmorph” syntax in MATLAB) used to join the disconnected points. Then, a connected component labeling algorithm employing region properties eliminates areas smaller than 100 pixels. Afterward, the remained regions are sorted according to vertical value of their centroids. As we can see in Fig. 1, due to anatomical structures of intra-retinal layers, the retinal OCT images have two areas which show higher brightness: one located in Retinal Nerve Fiber Layer (RNFL) and one located at HRC. Therefore, the areas sorted as lower class should be selected as the most probable candidates belonging to the HRC layer.
In the case of a large number of candidates, down sampling is employed to prevent high dimensionality in the next step of the graph matrix preparation. The selection of “large number” is dependent on computational abilities of the computer and for our implementation the number of allowed candidates after down sampling is 4000 pixels.
The selected pixels are then allocated to graph nodes in a way that normalized intensity, horizontal value and vertical value of each pixel made the three dimensional graph nodes. Then the matrix of connectivity (weights) is constructed as described in [27]. The local similarity measure is defined in the graph, indicating the connectivity of the dataset. In the next step, a random walk (Fig. 2) is employed between the points, and the connectivity of two points is defined as the probability of jumping from one to another in one step.
Fig. 2.
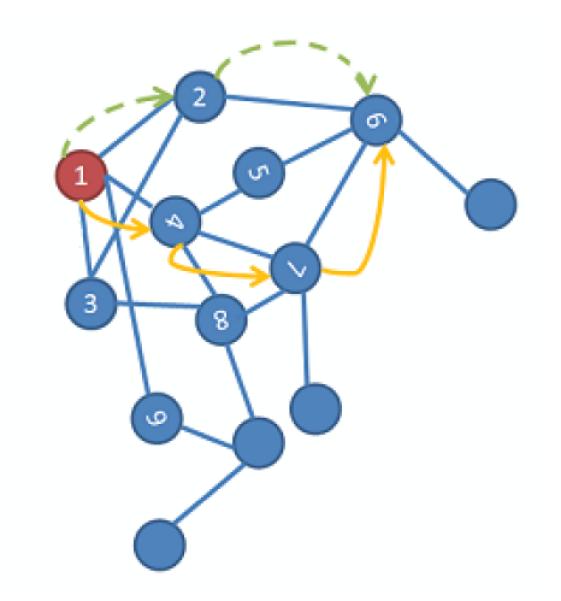
A random walk on a data set [27]; each node is a three dimensional graph nodes in our application.
To have a numerical definition of connectivity, a kernel, named diffusion kernel, is constructed as:
| (3) |
where i and j indicate three dimensional graph nodes. And the connectivity (weights) is defined by:
| (4) |
where is the row-normalized form of k(i,j).
In this algorithm, the choice of the parameter ε is very crucial in the computation of the weights and is a data-dependent parameter [28]. Small values of ε will give almost zero entries for Wij, while large values will lead to close-to-one values (values that would be of most interest lie between these two extremes). Based on this idea, Singer et al. [29] proposed a scheme that we use in this work. The proposed algorithm has the following steps:
Construct a sizeable ε -dependent weight matrix W = W(ε) for several values of ε.
- Compute L(ε) (assuming that N is the number of points which make the graph nodes)
(5) Plot L(ε) using a logarithmic plot. This plot will have two asymptotes when ε →0 and ε →∞.
Choose ε, for which the logarithmic plot of L(ε) appears linear. This step can be done automatically with monitoring the second derivative of L(ε).
A scale factor (time) is also proposed to show the number of steps in jumping between two points. This factor is set to three in this work and can be determined by higher powers of the weight matrix. To clear up, if we choose a higher power instead of the first power, the connection of each pixel to remote pixels becomes more probable. This can be useful when we want to localize a boundary with discontinuities (like OCT scans in presence of blood vessels). The algorithm jumps these irregularities and connects the remote pixels.
The next step after calculation of the weight matrix is finding the curvature in the HRC layer to be aligned. Two methods may be applied for this purpose. The first one is tracing a maximum-to-happen path in the matrix named “graph geometry method”, and the second is finding the minimal path connecting the two desired points using the shortest path algorithm. In the previous sentence, maximum is indicating “maximum of connectivity” (or maximum probability of jumping from one node to another), and minimal is indicating “the minimum in sum of the weights of constituent edges”. The first algorithm produces better results so we select this method for our final solution.
In the first proposed algorithm (“graph geometry method”), the three dimensional graph nodes are considered, looking for a path connecting the points with the least x values (the most left pixels) to the ones with the highest x values (the most right pixels). For this purpose, the first point to start the path is found by sorting the first 20 points in the left region of the image (according to the vertical value) and finding the point with the median vertical value among them. We selected 20 points since the approximate thickness of HRC is around this number. In the next step, the weight matrix is searched to find the second index between the near nodes and with the highest probability of being attached to the first index. For this purpose, we select one row of the weight matrix which contains the connectivity between the selected index and other nodes. Then we eliminate the nodes on the left side of the selected point and we just keep of the nearest remained pixels. It should be noted that numbering of the points in graph construction is column wise; therefore, the points on the left side of each node in the graph row contain the pixels located in the left columns of the current pixel in the image. Therefore, as we want to go toward right part of the image, the left columns can be eliminated from the search path. Furthermore, only a few points located in a determined radius around the pixel are eligible for being connected and the rest of them can be removed. The parameter for choosing this radius is deterministic in connectivity of the localized curve. Namely, a high radius is determined, a pixel located far from the pixel but with very similar intensity will be eligible to connection; this can be useful in areas that an artifact like shadow of vessels is disconnecting HRC. However a small radius only permits the connection of near pixels and consequently can prevent the possible incorrect connections to the wrong points. With such a trade off, we selected of all the points as an optimum radius by trial and error. Thus, the highest value of the remaining row indicates the place of the next node to be connected to the initially localized pixel. This procedure may be repeated until reaching the last point and finding the desired intrinsic geometry. Then we renormalize and smooth the coordinates and remove the points with equal vertical values. The procedure for implementing this method is depicted in Figure 3.
Fig. 3.
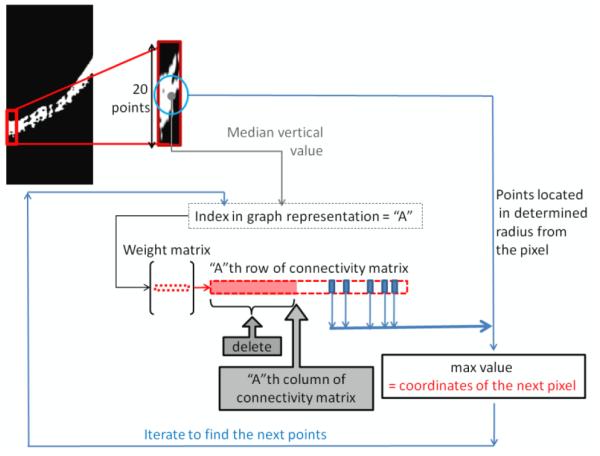
The procedure for implementing the proposed graph geometry method.
Having the HRC layer coordinates, we can align the whole shape to straighten this curve. One simple method for such a curvature correction is described below. We have the estimated coordinates showing the curvature of the HRC layer, connected through interpolation. The image can be considered as a combination of small windows, determined by width equal to one and the height from top to the bottom of the image. Then each of these windows can be translated up or down to force the curve points to form a straight line.
It is also helpful to indicate that selecting the “median” vertical value among first 20 points in the left region is optional and can be changed to the first, last or even the maximum vertical value. Namely, HRC is corresponded to photoreceptors’ inner and outer segments, RPE and choriocapillaris, and starting from a point in each of these anatomical structures, will cause localization of the same section, curvature correction of which is desirable in our application.
In curvature correction of OCT images, it is important to eliminate the unwanted curvature which is caused by a low spatial-frequency distortion due to the curvature of the eye and patient motion during acquisition. If the OCT image is acquired from Optic Nerve Head (ONH) or if some pathological effects (like drusens, fluid filled regions or seeds) exist in the image (see Figure 6- second row), central part of the HRC curve may be affected by a change in the curvature. Such a change in curvature is important in diagnosis (informative curvature) and should not be aligned during the algorithm. Therefore, the curve according to which the alignment will take place can be obtained by interpolation on areas with informative curvature. For this purpose, two procedures can be established: One is selecting the first and last quarters of the curve and interpolating the rest (assuming that informative curvature is placed in the middle of the HRC). The second strategy is obtaining the start and stop points manually and tracing the rest of the curve with interpolation.
Fig. 6.
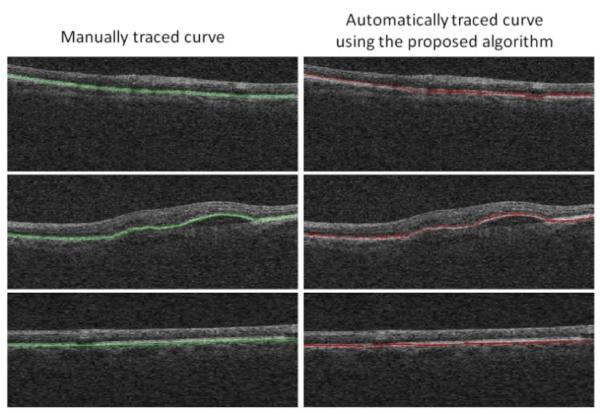
Comparisons between the manual localization of HRC (left column) and the automatic localization using the proposed algorithm (right column); The first and last row are examples of HRCs without pathological curvatures and the middle row is an example of HRC with pathological curvatures in the middle area.
The first proposed algorithm (“graph geometry method”) is somehow similar to dynamic programming in detection of best point to be connected to the current one. However deliberate selection of the accompanying algorithms make the method more suitable for this application.
In the second proposed algorithm (“the minimum in sum of the weights of constituent edges”), the algorithm is based on shortest path algorithm, for which the weight matrix should be sparse. Accordingly, we select a neighborhood (NumNeigh) criterion which indicates the number of nodes which should connect to each node of the graph. We sort the values indicating the connectivity to each point and exclude the NumNeigh higher values, and set the rest to zero. In such a way, we have a sparse matrix for weights and according to the graph theory we may solve the shortest path problem for each pair of nodes [30, 31].
The main problem with the shortest path algorithm is that this method cannot identify the best route automatically (similar to what is achieved through the proposed graph geometry method). Therefore, two strategies may be followed. One is determining the start and stop points of the route and calculating the best path through the two determined pixels, and the second plan is calculating single-source shortest paths from the first node to all other nodes and looking for the best path. Both of these methods have shortcomings. In the first approach, finding the correct points is a very complicated task and makes the algorithm potentially vulnerable to wrong decision. In the second approach, we should compare the distances of the first node to all of the pixels located at the last column and find the shortest route. This can localize the correct path but the computational time is too high in comparison to the proposed graph geometry detection.
3. RESULTS
We applied a circular symmetric Laplacian model based wavelet diffusion to OCT images (Fig. 4a) to decrease the image noise (Fig. 4b) and the estimated HRC layer is illustrated in Fig. 4c.
Fig. 4.
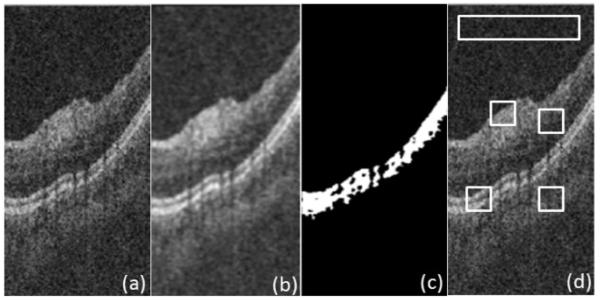
(a) Original image, (b) Denoised image, (c) Estimated HRC layer, and (d) Four selected ROIs.
To assess performance of the proposed denoising, we define four regions of interest (ROI), similarly to [32], on 20 randomly selected slices. Fig. 4d shows the mentioned regions of interest being small rectangular areas with interesting details, edges or textural features inside and the largest, elongated rectangle to assess the background statistics. We use standard measures of signal-to-noise ratio (SNR) and contrast-to-noise ratio (CNR) to compare the proposed method with conventional nonlinear anisotropic filter [18-20]. We evaluate (SNR) = 20log(Imax/σb), where Imax is the maximum value in the processed image, and σb is the standard deviation of noise in the background region, which estimates the standard deviation of the remaining noise. Furthermore, we use CNR to measure the contrast between a feature of interest and the background noise. In the mth region of interest, CNR is defined as [32]
| (6) |
where μm and denote mean value and variance of the mth ROI, and μb and denote mean value and variance of the background region, respectively. Table 2 shows average values of SNR and CNR on 20 randomly selected slices for circular symmetric Laplacian model based wavelet diffusion and conventional non linear anisotropic filter, which shows superiority of the proposed method. The important point is also in near-to-zero time requirement of this method in comparison to approximate 40 second processing time of the conventional non linear anisotropic filters.
TABLE 2.
Average values of SNR and CNR on 20 randomly selected slices
| CNR | SNR[dB] | |
|---|---|---|
| Original | 0.89 ± 0.32 | 18.27 ± 5.68 |
| circular symmetric Laplacian model based wavelet diffusion | 1.49 ± 0.50 | 30.43 ± 7.32 |
| conventional non linear anisotropic filter | 1.08 ± 0.46 | 24.29 ± 6.83 |
The algorithm for selection of epsilon as described in section 2.2 is presented in Fig. 5 and comparisons between the manual localization of HRC and the automatic localization using the proposed algorithm (tracing a maximum-to-happen path named “graph geometry method”) are shown in Fig. 6.
Fig. 5.
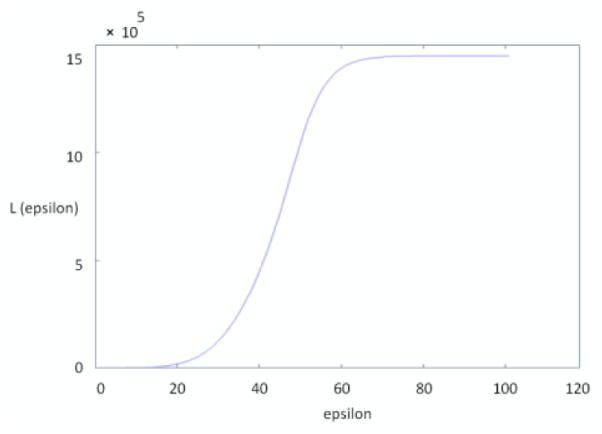
Values of L for different epsilons obtained by applying the algorithm on a sample image shown in Figure 4 (a) ; the selected epsilon should be placed in linear region of the diagram (45 can be a good candidate in this example).
For better comparison of curvature correction results, we described that two procedures are established during curvature correction: One is selecting the first and last quarters of the curve and interpolating the rest (which we name as “full automatic method”), and the other one is obtaining the start and stop points manually and tracing the rest of the curve with interpolation (which we name as “semi automatic method”). Figure 7 shows comparisons between curvature correction results of the full automatic method (second column), the semi automatic method (third column), and the manual method (fourth column). Table 3 and 4 show signed and unsigned border positioning errors (mean ± SD) on 50 randomly selected slices with pathological curvature and 200 randomly selected slices without pathological curvature from 25 datasets of 3D OCT captured using Zeiss SD-OCT Cirrus machine (Carl Zeiss Meditec Inc., Dublin, CA, USA) against the manual tracings of two independent observers. The error values are calculated as difference of vertical values (for each horizontal pixel) computed by the algorithm and labeled by two observers. The mean value obtained from two observers is used to decrease the case dependency of the manual tracing.
Fig. 7.
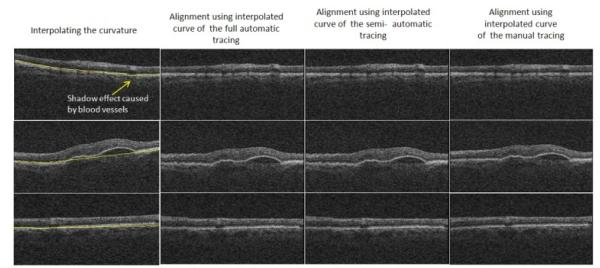
Comparisons between curvature correction results of the full automatic method (second column), the semi automatic method (third column), and the manual method (fourth column); The first and last row are examples of HRCs without pathological curvatures and the middle row is an example of HRC with patholocical curvatures in the middle area.
TABLE 3.
Summary of mean signed and unsigned border positioning errors (mean ± SD) in micrometers on 50 randomly selected slices with pathological curvature using proposed algorithm
| Mean ± SD Signed Border Positioning Error |
Mean ± SD Unsigned Border Positioning Error |
|
|---|---|---|
| Complete Curve | 7.24±2.58 | 12.39±5.97 |
| Interpolated Curve using semi automatic method | 2.92±1.14 | 6.79±4.17 |
| Interpolated Curve using full automatic method | 3.81±3.12 | 8.53±3.76 |
TABLE 4.
Summary of mean signed and unsigned border positioning errors (mean ± SD) in micrometers on 200 randomly selected slices without pathological curvature using proposed algorithm
| Mean ± SD Signed Border Positioning Error |
Mean ± SD Unsigned Border Positioning Error |
|
|---|---|---|
| Complete Curve | 1.22±0.72 | 2.29±1.93 |
| Interpolated Curve using full automatic method | 1.25±0.21 | 2.19±1.25 |
Comparing the results of these two tables, it can be inferred that in pathologically curved OCTs (Table 3), the localization is worse for the complete curve (due to discontinuities and sudden changes in HRC layer) and the error rate decreases dramatically after interpolation (which shows the correct localization in non-pathologic areas). It is also obvious that the error rates do not change between complete and interpolated curves in normal HRCs (Table 4). In order to have a comparison with similar methods incorporating shortest path method and dynamic programming, algorithms in [13] and [23] are discussed. We developed the same algorithm proposed in [13] with dynamic programming, and the unsigned border positioning errors (mean ± SD) on 50 randomly selected slices with pathological curvature and 200 randomly selected slices without pathological curvature are shown in Table 5. The errors in Table 5 indicate the better performance of the proposed method in comparison to [13].
TABLE 5.
Summary of mean unsigned border positioning errors (mean ± SD) in micrometers using the method proposed in [13]
| Mean ± SD Unsigned Border Positioning Error on 200 randomly selected slices without pathological curvature |
Mean ± SD Unsigned Border Positioning Error on 50 randomly selected slices with pathological curvature |
|
|---|---|---|
| Complete Curve | 4.32±2.06 | 19.43±8.32 |
| Interpolated Curve using semi automatic method | --- | 9.54±4.39 |
| Interpolated Curve using full automatic method | 4.29±2.15 | 10.21±4.07 |
To show how the proposed algorithm and the method in [23] are alike or different, unfortunately the border positioning errors were not reported for HRC but the overall signed and unsigned errors were 1.14 ±1.43 and 3.39 ± 0.96, respectively for normal and glaucomatous eyes, which show no pathological curvature. The reported errors are comparable to our results on slices without pathological curvature and cannot be compared to errors of Table 3 on slices with pathological curvature. It should be noted that the results of [23] were acquired using Topcon 3D OCT-1000 equipment with axial resolution of 3.5 μm/pixel, in comparison to our results with 2 μm/pixel axial resolution. To have a comparison with a method that identifies fluid filled regions [17], the overall unsigned positioning error for all of the eleven surfaces was 5.75±1.37, but similar to [23] retinal layer segmentation was assessed on a set of OCT volumes from normal eyes, not on pathological ones.
The mean execution time for proposed HRC localization using MATLAB software on a Dell-E6400 Notebook with 4 GB of RAM is 1.32 sec. The algorithms proposed in [13] takes 3.12 sec. in the same setup. The time complexity of the method in [23] is reported to be about 45 seconds in C programming language for the nine layer detection for each 3D volume, and in [17] to be about 70 seconds for the eleven layer detection for each 3D volume. However, the errors of localization in presence of pathological curvature haven’t been presented which makes the comparison less reliable.
While it was noted that the presence of vessels reduces the ability of our algorithm to accurately detect the location of HRC (as shown in the upper-left image in Figure 7), this limitation can be solved by incorporating a vessel finding algorithm in the process, and then increasing the radius around the pixel through which the pixels are eligible for being connected. We can also use higher powers of the weight matrix to enable the algorithm to jump over the discontinuities of blood vessels, as described in Section 2.
4. CONCLUSION
This paper introduces a combination of two preprocessing steps (circular symmetric Laplacian based wavelet diffusion for denoising and graph-based geometry detection for curvature correction) on OCT images. The combination is shown to be powerful even in images lacking quality such as pathological artifacts. The important aspect of this algorithm is its ability in aligning the strongly damaged images (from patients with retinal pathologies like drusen or fluid filled regions) that surpasses the previously introduced methods (improvement of Mean ± SD unsigned border positioning error from 19.43±8.32 micrometers in [13] to 12.39±5.97 micrometers in our algorithm); the method is also fast, compared to relatively low speed of the similar methods.
For calculation of the intrinsic geometry to reveal the curvature in the HRC, two methods were discussed. The first one is named “graph geometry method”, and the second is finding the minimal path connecting the two desired points with shortest path algorithm. As it is described, the main problem with shortest path algorithm is that this method cannot identify the best route automatically which can be achieved through the proposed graph geometry method; therefore, the first algorithm is selected for this application.
ACKNOWLEDGMENT
This work was supported in part by the National Institutes of Health grants R01 EY018853, R01 EY019112, and R01 EB004640.
Footnotes
We also tested our algorithm for datasets from Topcon and Heidelberg units (with tuned parameters for each unit). MATLAB executable codes and several slices from Ziess, Topcon and Heidelberg units are available upon request.
Contributor Information
Raheleh Kafieh, Biomedical Engineering Dept., Medical Image and Signal Processing Research Center, Isfahan University of Medical Sciences, Isfahan, IRAN.
Hossein Rabbani, Biomedical Engineering Dept., Medical Image and Signal Processing Research Center, Isfahan University of Medical Sciences, Isfahan, IRAN, Iowa Institute for Biomedical Imaging, The University of Iowa, Iowa City, IA 52242, USA.
Michael D. Abramoff, Iowa Institute for Biomedical Imaging, The University of Iowa, Iowa City, IA 52242, USA
Milan Sonka, Iowa Institute for Biomedical Imaging, The University of Iowa, Iowa City, IA 52242, USA.
REFERENCES
- [1].Huang D, Swanson E, Lin C, Schuman J, Stinson G, Chang W, Hee M, Flotte T, Gregory K, Puliafito CA, Fujimoto JG. Optical coherence tomography. Science. 1991;vol. 254:1178–81. doi: 10.1126/science.1957169. [DOI] [PMC free article] [PubMed] [Google Scholar]
- [2].DeBuc DC. A Review of Algorithms for Segmentation of Retinal Image Data Using Optical Coherence Tomography. Image Segmentation, In Tech. 2011 [Google Scholar]
- [3].Hee MR, Izatt JA, Swanson EA, Huang D, Schuman JS, Lin CP, Puliafito CA, Fujimoto JG. Optical coherence tomography of the human retina. Arch. Ophthalmol. 1995;vol. 113:325–32. doi: 10.1001/archopht.1995.01100030081025. [DOI] [PubMed] [Google Scholar]
- [4].George A, Dillenseger JA, Weber A, Pechereau A. Optical coherence tomography image processing. Investigat .Ophthalmol. Vis. Sci. 2000;vol. 41:165–S173. [Google Scholar]
- [5].Koozekanani D, Boyer KL, Roberts C. Retinal Thickness Measurements in Optical Coherence Tomography Using a Markov Boundary Model. IEEE Trans Med Imaging. 2001;vol. 20(9):900–916. doi: 10.1109/42.952728. [DOI] [PubMed] [Google Scholar]
- [6].Herzog A, Boyer KL, Roberts C. Robust Extraction of the Optic Nerve Head in Optical Coherence Tomography. Computer Vision and Mathematical Methods in Medical and Biomedical Image Analysis (CVAMIAMMBIA) 2004:395–407. [Google Scholar]
- [7].Shahidi M, Wang Z, Zelkha R. Quantitative Thickness Measurement of Retinal Layers Imaged by Optical Coherence Tomography. American Journal of Ophthalmology. 2005;vol. 139(6):1056–1061. doi: 10.1016/j.ajo.2005.01.012. [DOI] [PubMed] [Google Scholar]
- [8].Srinivasan VJ, Monson BK, Wojtkowski M, Bilonick RA, Gorczynska I, Chen R, Duker JS, Schuman JS, Fujimoto JG. Characterization of Outer Retinal Morphology with High-Speed, Ultrahigh-Resolution Optical Coherence Tomography. Invest Ophthalmol Vis Sci. 2008:1571–1579. doi: 10.1167/iovs.07-0838. [DOI] [PMC free article] [PubMed] [Google Scholar]
- [9].Lee K, Abramoff MD, Niemeijer M, Garvin MK, Sonka M. 3-D segmentation of retinal blood vessels in spectral-domain OCT volumes of the optic nerve head. Proc. of SPIE Medical Imaging: Biomedical Applications in Molecular, Structural, and Functional Imaging. 2010;vol. 76260V [Google Scholar]
- [10].Boyer KL, Herzog A, Roberts C. Automatic recovery of the optic nervehead geometry in optical coherence tomography. IEEE Trans Med Imaging. 2006;vol. 25(5):553–70. doi: 10.1109/TMI.2006.871417. [DOI] [PubMed] [Google Scholar]
- [11].Ishikawa H, Stein DM, Wollstein G, Beaton S, Fujimoto JG, Schuman JS. Macular Segmentation with Optical Coherence Tomography. Invest. Ophthalmol. Visual Sci. 2005;vol. 46:2012–2017. doi: 10.1167/iovs.04-0335. [DOI] [PMC free article] [PubMed] [Google Scholar]
- [12].Mayer MA, Tornow RP, Bock R, Hornegger J, Kruse FE. Automatic Nerve Fiber Layer Segmentation and Geometry Correction on Spectral Domain OCT Images Using Fuzzy C-Means Clustering. Invest. Ophthalmol. Vis. Sci. 2008;vol. 49 E-Abstract. 1880. [Google Scholar]
- [13].Baroni M, Fortunato P, LaTorre A. Towards quantitative analysis of retinal features in optical coherence tomography. Medical Engineering and Physics. 2007;vol. 29(4):432–441. doi: 10.1016/j.medengphy.2006.06.003. [DOI] [PubMed] [Google Scholar]
- [14].Bagci AM, Shahidi M, Ansari R, Blair M, Blair NP, Zelkha R. Thickness Profile of Retinal Layers by Optical Coherence Tomography Image Segmentation. American Journal of Ophthalmology. 2008;vol. 146(5):679–687. doi: 10.1016/j.ajo.2008.06.010. [DOI] [PMC free article] [PubMed] [Google Scholar]
- [15].Mishra A, Wong A, Bizheva K, Clausi DA. Intra-retinal layer segmentation in optical coherence tomography images. Opt. Express. 2009;vol. 17(26):23719–23728. doi: 10.1364/OE.17.023719. [DOI] [PubMed] [Google Scholar]
- [16].Fuller AR, Zawadzki RJ, Choi S, Wiley DF, Werner JS, Hamann B. Segmentation of Three-dimensional Retinal Image Data. IEEE Transactions on Visualization and Computer Graphics. 2007;vol.13(6):1719–1726. doi: 10.1109/TVCG.2007.70590. [DOI] [PMC free article] [PubMed] [Google Scholar]
- [17].Quellec G, Lee K, Dolejsi M, Garvin MK, Abràmoff MD, Sonka M. Three-dimensional analysis of retinal layer texture: identification of fluid-filled regions in SD-OCT of the macula. IEEE Trans. Med. Imaging. 2010;vol. 29(6):1321–1330. doi: 10.1109/TMI.2010.2047023. [DOI] [PMC free article] [PubMed] [Google Scholar]
- [18].Gregori G, Knighton RW. A Robust Algorithm for Retinal Thickness Measurements using Optical Coherence Tomography (Stratus OCT) Invest. Ophthalmol. Vis. Sci. 2004;vol. 45 E-Abstract.3007. [Google Scholar]
- [19].Garvin MK, Abramoff MD, Kardon R, Russell SR, Xiaodong W, Sonka M. Intraretinal Layer Segmentation of Macular Optical Coherence Tomography Images Using Optimal 3–D Graph Search. IEEE Transaction on Medical Imaging. 2008;vol. 27(10):1495–1505. doi: 10.1109/TMI.2008.923966. [DOI] [PMC free article] [PubMed] [Google Scholar]
- [20].Fernández DC, Villate N, Puliafito CA, Rosenfeld PJ. Comparing total macular volume changes measured by Optical Coherence Tomography with retinal lesion volume estimated by active contours. Invest. Ophthalmol. Vis. Sci. 2004;vol. 45 E-Abstract. 3072. [Google Scholar]
- [21].Yazdanpanah A, Hamarneh G, Smith B, Sarunic M. Intra-retinal layer segmentation in optical coherence tomography using an active contour approach. Med Image Comput Assist Interv. 2009;vol. 12:649–56. doi: 10.1007/978-3-642-04271-3_79. [DOI] [PubMed] [Google Scholar]
- [22].Abràmoff MD, Lee K, Niemeijer M, Alward WLM, Greenlee EC, Garvin MK, Sonka M, Kwon YH. Automated Segmentation of the Cup and Rim from Spectral Domain OCT of the Optic Nerve Head. Invest. Ophthalmol. Vis. Sci. 2009;vol. 50:5778–5784. doi: 10.1167/iovs.09-3790. [DOI] [PMC free article] [PubMed] [Google Scholar]
- [23].Yang Q, Reisman CA, Wang Z, Fukuma Y, Hangai M, Yoshimura N, Tomidokoro A, Araie M, Raza AR, Hood DC, Chan K. Automated layer segmentation of macular OCT images using dual-scale gradient information. Optics Express. 2010;vol. 18(20):21294–21307. doi: 10.1364/OE.18.021293. [DOI] [PMC free article] [PubMed] [Google Scholar]
- [24].Yue Y, Croitoru MM, Bidani A, Zwischenberger JB, Clark JW. Multiscale Wavelet Diffusion for Speckle Suppression and Edge Enhancement In Ultrasound Imag-es. IEEE Trans. Medical Imaging. 2006;vol. 25(3) doi: 10.1109/TMI.2005.862737. [DOI] [PubMed] [Google Scholar]
- [25].Rajpoot Kashif, Rajpoot Nasir, Noble J. Alison. Discrete Wavelet Diffusion for Image Denoising. Proceedings of International Conference on Image and Signal Processing; France. 2008. [Google Scholar]
- [26].Kafieh R, Rabbani H, Foruhande M. Circular Symmetric Laplacian mixture model in wavelet diffusion for dental image denoising. Journal of Medical Signals and Sensors (JMSS) 2012;vol. 2(2):31–44. [PMC free article] [PubMed] [Google Scholar]
- [27].la Porte J. d., Herbs BM, Hereman W, van der Walt SJ. An Introduction to Diffusion Maps. Proceedings of the 19th Symposium of the Pattern Recognition Association of South Africa; South Africa. 2008. pp. 15–25. [Google Scholar]
- [28].Bah B. M.A. thesis. Wolfson College, University of Oxford; UK: 2008. Diffusion Maps: Analysis and Applications. [Google Scholar]
- [29].Singer A. Detecting the slow manifold by anisotropic diffusion maps. Proceedings of the National Academy of Sciences of the USA. 2007 [Google Scholar]
- [30].Dijkstra EW. A note on two problems in connexion with graphs. NumerischeMathematik. 1959;vol. 1:269–271. [Google Scholar]
- [31].Bellman R. On a Routing Problem. Quarterly of Applied Mathematics. 1958;vol. 16(1):87–90. [Google Scholar]
- [32].Pizurica A, Jovanov L, Huysmans B. Multiresolution Denoising for Optical Coherence Tomography: A Review and Evaluation. Current Medical Imaging Reviews. 2008 Nov.vol. 4(4):270–284. [Google Scholar]


