

Abstract
Background/aim
A local nanotherapy (LNT) combining the therapeutic efficacy of trans-arterial embolization, nanoparticles, and p53 gene therapy has been previously presented. The study presented here aimed to further improve the incomplete tumor eradication and limited survival enhancement and to elucidate the molecular mechanism of the LNT.
Methods
In a tumor-targeting manner, recombinant expressing plasmids harboring wild-type p53 and Rb were either co-transferred or transferred separately to rabbit hepatic VX2 tumors in a poly-L-lysine-modified hydroxyapatite nanoparticle nanoplex and Lipiodol® (Guerbet, Villepinte, France) emulsion via the hepatic artery. Subsequent co-expression of p53 and Rb proteins within the treated tumors was investigated by Western blotting and in situ analysis by laser-scanning confocal microscopy. The therapeutic effect was evaluated by the tumor growth velocity, apoptosis and necrosis rates, their sensitivity to Adriamycin® (ADM), mitomycin C, and fluorouracil, the microvessel density of tumor tissue, and the survival time of animals. Eventually, real-time polymerase chain reaction and enhanced chemiluminescence Western blotting were used to investigate the expressive changes of important genes related to the therapy.
Results
The administration procedure proved safe for the rabbits’ liver function, the p53 plus Rb LNT showed significantly better antitumoral effect and lower expression of malignant genes than the p53 or Rb LNT, although no significant difference was observed in animal survival when the p53 plus Rb LNT was compared with the p53 LNT.
Conclusion
Rb works synergistically with p53 in combined therapy mediated by a poly-L-lysine-modified hydroxyapatite nanoparticle nanoplex to augment the antitumoral effect through the downregulated expression of important genes related to apoptosis, necrosis, growth, differentiation and multidrug resistance of tumor cells. LNT with p53 and Rb is potentially an effective antitumor therapy for hepatocellular carcinoma.
Keywords: nanoparticles, gene-transfer techniques, targeting, combined therapy
Introduction
Hepatocellular carcinoma (HCC) is among the most common and lethal cancers worldwide, especially in the People’s Republic of China.1–4 To date, the most likely to be curative treatments are partial liver resection and transplantation. However, most cases escape early detection, when the HCCs are small, and the optimal time for operation.5 In addition, severely impaired hepatic functional reserve, relapse, and the shortage of organs also limit the efficacy of surgical treatment. Thus, various non-operative strategies must usually be tried.6,7 Of these, combined therapy has proven the best solution to date.8–10 A previous study11 successfully combined p53 gene therapy, embolic therapy, and nanotherapy at the liver tumor site by exploiting poly-L-lysine (PLL)-modified hydroxyapatite nanoparticles (nHAPs) to serve as embolic material and gene vector at the same time. However, complete tumor elimination was not observed in any of the animals and the survival prolongation was limited, thus further improvements to the therapy are necessary before clinical application. Moreover, the molecular mechanism of the new therapy is still unknown. As the first identified tumoral suppressor gene, functional loss of Rb gene, highly related to the carcinogenesis, tumor progression, and poor prognosis of hepatocellular carcinoma, is correlated to alterations of p53 gene.12,13 Subsequent gene therapy with Rb has exhibited general antitumoral effect in many kinds of tumors with Rb genes abnormal expression over the past two decades.14–22 Many data suggest that a combination of the two genes is more efficient and useful than either of the two genes alone for local tumor control using gene therapy.23–29 This inspired us to exploit the gene transfer of p53 and Rb simultaneously in the former local combined therapy mediated by PLL-nHAPs. In preliminary experiments, we luckily observed both the p53 mutation and Rb inactivation in rabbit VX2 tumors, which provide an excellent platform for the gene therapy using those two genes. Thus, we explored the combination of the p53 and Rb genes in a local nanotherapy (LNT) protocol for the rabbit liver VX2 model, with the intention of generating co-expression of wt-p53 and wild type Rb in the tumors, increasing the apoptosis and necrosis of tumor cells, decreasing tumor growth, and prolonging the survival time of the animals.
Materials and methods
Formation of the nanoplex and the polyplex using nhaPs and plasmid DNA
The nHAPs were provided by the Biomaterial Center of Wuhan University of Science and Technology, Wuhan, People’s Republic of China. The 1.2 kb p53 gene, cloned from normal L02 cells, was subcloned into the C-terminal of enhanced green fluorescent protein (EGFP) in pEGFP-C2 (CMV promoter, BD Biosciences, San Jose, CA, USA) using BamHI and XhoI restriction enzymes. Subsequent DNA sequence analysis was consistent with the sequence reported in GenBank® (accession no AF307851), with the EGFP reading frame linked in frame to the p53 gene by intervening amino acids “QISSSSFEF.” The recombinant vector was called “pEGFP-C2-p53.” The 2.9 kb Rb gene, cloned from human placental tissue, was subcloned into the multiclone site of PBK-CMV plasmid vector using the same restriction enzymes followed by sequence analysis (Life Technologies, Carlsbad, CA, USA). The analysis was completely consistent with the sequence reported in GenBank (accession number: BC039060.1). The recombinant vector was called “PBK-CMV-Rb.”
The formation of the nanoplex and the polyplex was accomplished in three steps. First, the PLL-nHAP complex (ie, the nanoplex) was formed by adding 1 mg nHAPs to 1 mL 10% magnesium chloride (MgCl2) solution followed by 15 minutes of supersonic separation. Then, the solution was centrifuged for 10 minutes at 10,000 g. Following this, the precipitate was added to 2 mL phosphate-buffered saline (PBS; pH = 7.4) for another separation before being added to 0.2 mL 0.1% PLL and gently shaken at 25°C for 24 hours. Finally, the solution was once again centrifuged for 10 minutes at 10,000 g, then resuspended in 1 mL HEPES (4-(2-hydroxyethyl)-1-piperazineethanesulfonic acid) buffered saline for a third ultrasound separation before being filtered through a 0.22 μm filter.
Second to prepare the nanoplex-plasmid DNA (pDNA) complex (ie, the polyplex), the charge ratio of nanoplex/pDNA was expressed as the mass ratio of nHAP and pDNA. Immediately after the surface modification, the polyplex was prepared by the addition of pDNA into the nanoplex solution at weight ratio of 15 (previously determined as being the best weight ratio by Li et al11) and left at 25°C for 30 minutes.
Third, the Lipiodol® (Guerbet, Villepinte, France)/nanoplex and Lipiodol/polyplex emulsions were prepared by emulsifying 1 mL Lipiodol and 1 mL (3.75 mg) of the nanoplex and polyplex, respectively, according to the pumping method.30 The five systems produced were: (A) Lipiodol (containing equal volumes of Lipiodol and normal saline); (B) nanoplex/Lipiodol; (C) nanoplex-p53/Lipiodol system; (D) nanoplex-Rb/Lipiodol, and (E) nanoplex-(p53+Rb)/Lipiodol, in which pEGFP-C2-p53 and PBK-CMV-Rb plasmids of equal weight were used.
Animal models and Lipiodol/polyplex emulsion-mediated combined therapy in vivo
New Zealand White rabbits, female and male, weighing 2.5–3.5 kg, were obtained from the Experimental Animal Center of the Medical School of Sun Yat-sen University, Guangzhou, People’s Republic of China. Tumor-bearing rabbits were presented by Zhongnan Hospital, Wuhan University. A VX2 tumor, 1.0–1.5 cm in diameter, was taken out of each rabbit’s thigh muscle and the connective and necrotic tissue was ablated. The fragments, 1 mm3, were implanted into the left lobe of healthy rabbits’ liver and covered with absorptive gelatin sponge. Ten days later, spiral computed tomography (CT; GE ProSpeed II CT, GE Healthcare Bio-Sciences Corp, Piscataway NJ, USA) was performed on anesthetized animals in the supine position. The entire liver was scanned to observe the tumor growth state and volume. If no tumor was observed using common CT, 2.0 mL methylglucosamine diatrizoate was injected through the auricular vein and enhanced CT utilized. Models without ectopia metabasis or/and colliquation necrosis fulfilled the entry criteria and were randomly assigned to the follow-up groups.
One day after CT, hepatic arteriography (DPF-2000A/ASDSA; Toshiba, Japan) was performed by gastroduodenal artery injection of 3 mL iopromide to obtain information about the location and feeding artery of the tumor. This was followed by selective catheterization of that artery and injection of 2 mL/kg of one of the five systems: Lipiodol (Group A, n = 26), nanoplex/Lipiodol (Group B, n = 35), nanoplex-p53/Lipiodol (Group C, n = 40), nanoplex-Rb/Lipiodol (Group D, n = 35) and nanoplex-(p53+Rb)/Lipiodol (Group E, n = 35). Ten rabbits from each group were killed for their tumor issue 72 hours postinjection. Some of the tissue was digested using the trypsin method for parenchyma cells and some was stored at −70°C for subsequent testing.
From the remaining animals, blood was drawn for hepatic function investigation of total biliflavin, aspartate aminotransferase, and alanine aminotransferase levels of each group 1 day pre- and 1, 3, 5, and 7 days post-operation. The tumor volume was measured by spiral CT using the GE ProSpeed CT scanner on anesthetized animals in the supine position 1 day pre-operation and 1 and 2 weeks post-operation. The volume (V) was calculated according to the equation V = L × S2/2, in which “L” and “S” stand for the longest and shortest diameter, respectively. “Tumor growth rate” was defined as: (postoperative volume/preoperative volume) × 100%. The survival time of all rabbits was documented.
The animals were anesthetized by 0.2 mL/kg body weight Sumianxin (Quartermaster University of People’s Liberation Army, Changchun, People’s Republic of China) administrated intramuscularly. Lidocaine (0.1 mL/kg) was injected intramuscularly when the animal showed signs of suffering. All animal experimental procedures were performed in accordance with the National Institutes of Health’s Guide for the Care and Use of Laboratory Animals and were approved by the Animal Research Committee at Tongji Hospital, Wuhan, People’s Republic of China.
Investigation of co-expression of p53 and Rb in post-LNT groups
The disjuncted tumor cells were cultured on small glass slides for 12 hours to ensure adherence to the slides. After rinsing with PBS, fixation fluid (a mixture of equal volumes of methanol and acetone) was added to fix the slides for 10–15 minutes before the cells were incubated for 10 minutes in 0.25% Triton-X 100 (Dow Chemical Company, Midland, MI, USA). After this, the cells were incubated with the primary antibody of RB overnight at 4°C. Subsequently, phycoerythrin (PE)-goat anti-rabbit immunoglobulin (Ig) G (Proteintech Group, Inc, Chicago, IL, USA) was used as a secondary antibody at a dilution of 1:100. All slides were analyzed by laser-scanning confocal microscopy using the Nikon Digital Eclipse C1 Microscope System (Nikon Corporation, Tokyo, Japan).
Detection of apoptosis and necrosis in post-treated cancer tissue
Apoptosis, also known as “programmed cell death,” is characterized by cell shrinkage, chromatin condensation, and fragmentation of the cell into membrane-bound bodies that are eliminated by phagocytosis. Hoechst 33342, a type of blue-fluorescence dye, stains the condensed chromatin in apoptotic cells more brightly than it does normal chromatin.
“Necrosis” is defined as a type of cell death that lacks the features of apoptosis and with early plasma membrane rupture. Propidium iodide, a red-fluorescence dye only permeates to dead cells with ruptured membranes. The staining pattern resulting from the simultaneous use of these dyes makes it possible to distinguish normal, apoptotic, and dead cell populations by flow cytometry and fluorescence microscopy.
The disjuncted cells described earlier were washed with PBS, stained with Trypan blue, and counted by microscopy. If the rate of cell viability was >90%, the cells were prepared using an Apoptosis and Necrosis Assay Kit (Beyotime, Haimen, People’s Republic of China) according to the manufacturer’s protocol before being investigated by flow cytometry. The blue fluorescence of Hoechst 33342 indicated cell apoptosis while the red fluorescence of propidium iodide indicated cell necrosis.
Drug-resistance characteristics in post-treated cancer cells
Drug-resistance characteristics were evaluated by exposing the tumor cells to three chemicals: mitomycin C (MMC; Kyowa Kogyo, Japan), fluorouracil (5-FU; Sunrise, Shanghai, People’s Republic of China) and Adriamycin® (ADM) (Pfizer Inc, New York, NY, USA). The disjuncted cells described earlier were washed with PBS, stained with Trypan blue, and counted by microscopy. If the cell viability was >90%, the collected tumor cells were plated into 96-well culture dishes with 30,000 cells in each well and incubated with different concentrations of ADM (0.25–128.00 mg/L), MMC (0.5~256.0 μg/L), and 5-FU (0.5~256.0 mg/L), two-fold one step, in 0.1 mL of Dulbecco’s Modified Eagle’s Medium. After 48 hours’ incubation, the cell viability was evaluated by 3-(4,5-dimethylthiazol-2-yl)-2,5-diphenyltetrazolium bromide (MTT) assay, as described in an earlier publication.31 Following this, the cell survival curves were drawn, from which the half maximal inhibitory concentration of the three agents was calculated.
The detection of microvessel density in post-treated tumor tissue
The specimens were sectioned along the longitudinal diameter, passing through the tumor. The tumor tissues were then fixed in formalin and embedded in paraffin wax immediately after resection. Sections (5 mm) of the tumor tissues were obtained. Cluster of differentiation (CD) 34 expression was assayed by immunoperoxidase staining according to the SP immunohistochemistry kit (Ferment Biocompany, Wuhan, People’s Republic of China). Endogenous peroxidase was blocked with H2O2 and nonspecific antigens were blocked with normal serum. The primary antibodies (1:100 dilution) were incubated at 4°C overnight before being washed twice with PBS. The secondary antibody (1:500) was incubated for 15 minutes at 37°C, sections were stained with diaminobenzidine (DAB) tetrahydrochloride, and hematoxylin was used as the nuclear counterstain. For the negative control, PBS was substituted for the primary antibodies. The protein expression intensity was observed under light microscopy at 400 × magnification. One hundred cells per high-power visual field were counted and five visual fields were randomly counted for each section. The results were evaluated independently by three observers and the mean microvessel density (MVD) was documented.
Relationship between mRNA gene expression and the biological characteristics of aggressive cancer
After being washed twice with cold D-hanks buffer solution then chopped into pieces, 0.1 g tumor tissues were lysed and the total RNAs were extracted following the manufacturer’s instructions for TRIzol® Reagents (Ferments, Wuhan, People’s Republic of China). The subsequent reverse transcription real-time polymerase chain reaction analyses were performed according to the procedure outlined in a previous study31 The primers were synthesized by Biocolors (Shanghai, People’s Republic of China), with the oligonucleotide sequences as shown in Table 1.
Table 1.
The oligonucleotide sequences of primers
| P-gp | Sense | 5′CATTGGTGTGGTGAGTCAGG3′ |
| Antisense | 5′CTCTCTCTCCAACCAGGTG3′ | |
| BCRP | Sense | 5′CACCACCTCCTTCTGTCATCAA3′ |
| Antisense | 5′GGCACCTATAACCAGTCCCAGTA3′ | |
| CD34 | Sense | 5′AACATCTCCCACTAAACCC3′ |
| Antisense | 5′TCTTAAACTCCGCACAGC3′ | |
| VEGF | Sense | 5′GGGAAGAGGAGGAGATGA3′ |
| Antisense | 5′GCTGGGTTTGTCGGTGTT3′ | |
| Twist | Sense | 5′GGAGTCCGCAGTCTTACGAG3′ |
| Antisense | 5′TCTGGAGGACCTGGTAGAGG3′ | |
| p53 | Sense | 5′GCAAACTGGCTCAACGAA3′ |
| Antisense | 5′CATTTGGGAAGGGACAGAG3′ | |
| Beta-actin | Sense | 5′AGAGGGAAATCGTGCGTGAC3′ |
| Antisense | 5′CAATAGTGATGACCTGGCCGT3′ |
Abbreviations: BCRP, breast cancer resistance protein; CD34, cluster of differentiation 34; P-gp, P-glycoprotein 1; VEGF, vascular endothelial growth factor.
Relationship between protein gene expression and the biological characteristics of aggressive cancer
After the aforementioned tissue pretreatment, 0.1 g chopped tumor tissue was lysed in 400 μL lysis buffer (50 mM Tris-Cl, 150 Mm NaCl, 0.02% sodium azide, 100 μg/μL phenylmethylsulfonyl fluoride [PMSF], 1 μg/μL aprotinin, 1% NP-40, 0.5% sodium deoxycholate, 0.1% sodium dodecyl sulfate). The samples were incubated for 30 minutes at 0°C before being centrifuged at 12,000 g at 4°C for 15 minutes. Finally, the supernatant was recovered. The antibodies that specifically recognized p53 (wild and mutated type), vascular endothelial growth factor (VEGF), CD34, P-glycoprotein 1 (P-gp; also known as “multidrug resistance protein 1” [MDR1]), breast cancer resistance protein (BCRP), and Twist were purchased from the Borsta Company (Wuhan, People’s Republic of China). The concentrations of the proteins were determined by Bradford protein assay. The following detail of Western blot were performed essentially as described previously31 Blot absorption was analyzed by Alphalmager HP (Alpha Innotech, Santa Clara, CA, USA) and gene expressions were standardized by β-actin expression.
Statistical analysis
All data were expressed as mean±standard deviation. Means of multiple groups were compared using one-way analysis of variance and Fisher’s least significant difference multiple comparison test. Survival analysis was estimated by the Kaplan-Meier survival method with the statistical significance of survival distributions evaluated by log-rank tests. The event used as an endpoint was death. A P-value of ≤0.05 was considered statistically significant. All statistical analysis was performed using SPSS (v 13.0; IBM Corporation, Armonk, NY, USA).
Results
Successful selective gene transfer to VX2 tumors mediated by Lipiodol/polyplex emulsion
For target gene expression, a previous study11 identified the successful gene transduction only in tumor cells by observing the green fluorescence and immunostained band of EGFP-p53 fusion protein using a fluorescent microscope and Western blot, respectively. This work also detected the specific expression of EGFP-p53 in nanoplex-p53/Lipiodol (Group C) and nanoplex-(p53+Rb)/Lipiodol (Group E) group. In terms of the loss of Rb protein from the VX2 tumors, expression was only detectable in nanoplex-Rb/Lipiodol (Group D) and nanoplex-(p53+Rb)/Lipiodol (Group E). These results indicate that the two therapeutic genes were both transferred to the tumor tissue of each group, as shown in Figure 1.
Figure 1.
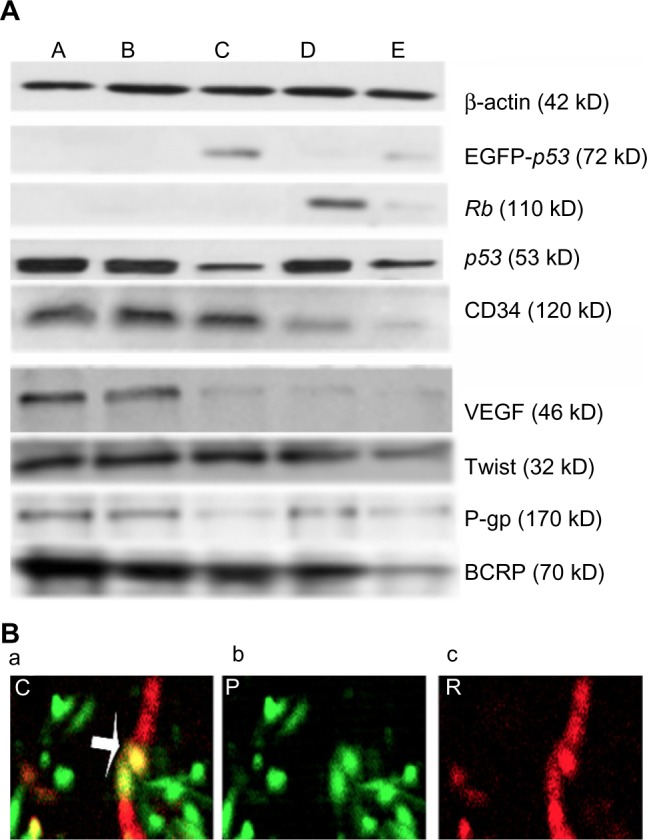
(A) Western blot analysis of protein lysates from VX2 tumors in ten rabbits of each group: Lipiodol® (Guerbet, Villepinte, France) (Group/lane A), nanoplex/Lipiodol (Group/lane B), nanoplex-p53/Lipiodol (Group/lane C), nanoplex-Rb/Lipiodol (Group/lane D), and nanoplex-(p53+Rb)/Lipiodol (Group/lane E).
Notes: Enhanced green fluorescent protein (EGFP)-p53 fusion protein expression can only be detected in Groups C and E, while the Rb protein, loss expression in the tumor, can be observed for expression in the tumor transduced with the exogenous wild-type Rb gene (groups/lanes D and E). a low level of mutated p53 expression was found in tumors upon transduction with two different systems (group/lane C and E) compared with the level of p53 expression in protein lysates from tumors treated with Lipiodol (without gene transfer, there would be no expression of Rb in this tumor. so, it is the gene transfer who realize the gene expression a), nanoplex/Lipiodol (without gene transfer, there would be no expression of Rb in this tumor. so, it is the gene transfer who realize the gene expression B), or nanoplex-Rb/Lipiodol (without gene transfer, there would be no expression of Rb in this tumor. so, it is the gene transfer who realize the gene expression D). For cluster of differentiation (cD)34, high expression level were found in groups a, B, and c, while low expression in groups D and E. For VEGF, high expression level were found in groups a and B, while low expression in groups C, D, and E. a low level of Twist expression was found in only group E, while a high level of expression was found in the other four groups. P-glycoprotein 1 (P-gp) expression was relatively high in groups a, B, and D and slightly lower in c and E. The expression of breast cancer resistance protein (BCRP), which was slightly lower in groups B, c, and D, was significantly inhibited in Group E compared with in Group A. (B) confocal laser-scanning microscopy (×400) in situ analysis demonstrated efficient co-expression of the same cell with two genes in vivo ([a] the yellow color as indicated by the arrow). The red and green fluorescence represent the immunofluorescent staining of RB [b] and the expression of EGFP-p53 fusion protein [c], respectively.
Abbreviations: BCRP, breast cancer resistance protein; CD34, cluster of differentiation 34; P-gp, P-glycoprotein 1; VEGF, vascular endothelial growth factor.
Lipiodol/polyplex emulsion slightly improved hepatic function
The hepatic function investigation showed that, in contrast to the Lipiodol group, the nanoplex and genes improved hepatic function slightly. Details are shown in Figure 2.
Figure 2.

(A) Alanine aminotransferase (ALT), (B) aspartate aminotransferase (AST), and (C) total biliflavin (TBIL), and levels of different groups: Lipiodol® (Guerbet, Villepinte, France) (group a, n = 16), nanoplex/lipiodol (Group B, n = 25), nanoplex-p53/lipiodol (group c, n = 30), nanoplex-Rb/Lipiodol (group D, n = 25), and nanoplex-(p53+Rb)/Lipiodol (Group E, n = 25).
Notes: * △, ▲, and ✰ represent significant difference from Groups A, B, C, and D, respectively, as calculated with one-way analysis of variance and Fisher’s least significant difference multiple comparison test.
Data for A, B, C from11.
Nanoplex-(p53+Rb)/Lipiodol induced the most tumor growth inhibition and longest survival time
The changes in pre- and postoperative tumor volume revealed that the nanoplex-(p53+Rb)/Lipiodol emulsion could inhibit the 1- and 2-week tumor growth rate more than the other systems. Although the nanoplex-p53/Lipiodol emulsion could inhibit the 1-week tumor growth more than the nanoplex-Rb/Lipiodol system, there was no significant difference in the 2-week growth rate between them (Figure 3).
Figure 3.
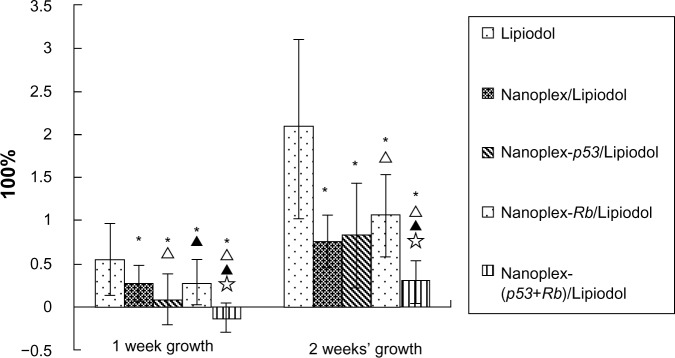
Tumor growth rate and survival time for the different groups: Lipiodol® (Guerbet, Villepinte, France) (Group A, 16), nanoplex/Lipiodol (Group B, 25), nanoplex-p53/Lipiodol (Group C, 30), nanoplex-Rb/Lipiodol (Group D, 25), and nanoplex-(p53+Rb)/Lipiodol (Group E, 25).
Notes: * Δ, ▲, and ✰ represent significant difference from Groups A, B, C, and D, respectively, as calculated with one-way analysis of variance and Fisher’s least significant difference multiple comparison test.
Data for A, B, and C from11.
The overall median survival in Groups A, B, C, D, and E was 39, 52, 59, 50, and 61 days, respectively. The subsequent log-rank test showed that the Lipiodol/polyplex could significantly improve the rabbits’ survival time compared with Lipiodol alone and the nanoplex/Lipiodol, with no significant difference between the nanoplex/Lipiodol group and nanoplex-Rb/Lipiodol group. Both nanoplex-p53/lipiodol and nanoplex-(p53+Rb)/lipiodol can prolong the survival time more than the nanoplex-Rb/lipiodol group. There is no significant difference between nanoplex-p53/lipiodol and nanoplex-(p53+Rb)/lipiodol (Figure 4).
Figure 4.

Overall survival curves for different groups.
Notes: The mean and median survival time for Lipiodol® (Guerbet, Villepinte, France) (Group A, n = 16), nanoplex/Lipiodol (Group B, n = 25), nanoplex-p53/Lipiodol (Group C, n = 30), nanoplex-Rb/Lipiodol (Group D, n = 25), and nanoplex-(p53+Rb)/Lipiodol (Group E, n = 25) are 39.7 and 39.0 days, 52.8 and 52.0 days, 60.4 and 59.0 days, 49.8 and 50.0 days, and 60.0 and 61.0 days, respectively. Log-rank testing showed that Groups B, C, D, and E all had a significantly longer survival time than Group A (all P = 0.000). Groups C and E could prolong the survival time longer than Group B (all P = 0.000) and Group D (C versus D, P = 0.003; E versus D, P = 0.005). There was no significant difference in survival prolongation between Groups B and D (P = 0.462) or between Groups C and E (P = 0.500).
Tumor MVD was decreased the most by nanoplex-(p53+Rb)/Lipiodol
Tumor MVD was decreased by both the nanoplex-Rb/Lipiodol and the nanoplex-(p53+Rb)/Lipiodol systems, with the latter system decreasing the MVD significantly more than the former (Figures 5 and 6).
Figure 5.

Tumor microvessel density images evaluated using cluster of differentiation (CD) 34 expression in the microvessel endothelium (arrow) of tumor tissue sections (original magnification × 400) from ten rabbits from each group: Lipiodol® (Guerbet, Villepinte, France) (Group A), nanoplex/Lipiodol (Group B), nanoplex-p53/Lipiodol (Group C), nanoplex-Rb/Lipiodol (Group D), and nanoplex-(p53+Rb)/Lipiodol (Group E). Immunohistochemistry analysis was undertaken with rabbit polyclonal anti-CD34 as the primary antibody, polyclonal goat anti-rabbit biotinylated antibody as the secondary antibody, and diaminobenzidine as chromogen; hematoxylin counterstaining showed high levels of protein expression in the microvascular endothelial cells of VX2 tumor from groups A, B, and C, which was downregulated in Groups D and E. Normal saline was used instead of the primary antibody for the negative control (N).
Figure 6.
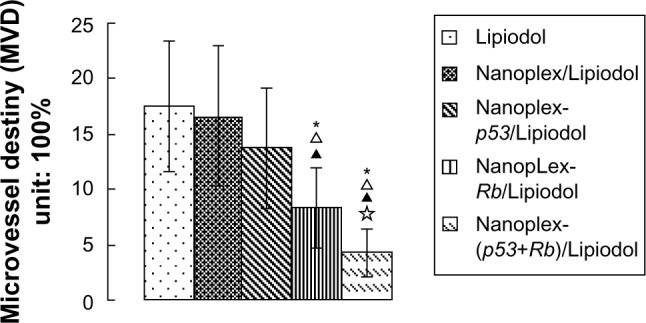
Semi-quantitative analysis of microvessel density in tumors of ten rabbits from each group: Lipiodol® (Guerbet, Villepinte, France) (Group A), nanoplex/Lipiodol (Group B), nanoplex-p53/Lipiodol (Group C), nanoplex-Rb/Lipiodol (Group D), and nanoplex-(p53+Rb)/Lipiodol (Group E).
Notes: *, Δ, ▲, and ✰ represent significant difference from Groups A, B, C, and D, respectively, as calculated with one-way analysis of variance and Fisher’s least significant difference multiple comparison test.
Nanoplex-p53/lipiodol and nanoplex-Rb/Lipiodol induced the most apoptosis and necrosis of cancer cells
The apoptosis results showed that the nanoplexes could induce cancer cell apoptosis and that antitumoral effects could be enhanced further by the polyplexes (P < 0.05). There was no significant difference in this regard between the three polyplex emulsions. The nanoplex/Lipiodol system induced more necrosis than Lipiodol alone, and this effect was greater with the nanoplex-p53/Lipiodol and nanoplex-(p53+Rb)/Lipiodol systems, but not with the nanoplex-Rb/Lipiodol system. There was no significant difference between the p53 and (p53+Rb) systems (Figure 7).
Figure 7.
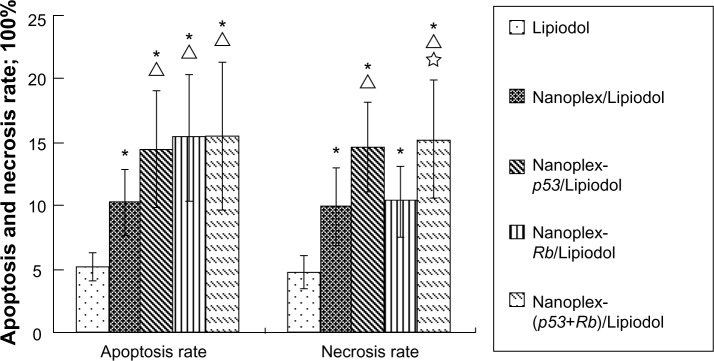
Apoptosis and necrosis rate of tumor cells from different groups.
Notes: * Δ, ▲, and ✰ represent significant difference from Lipiodol® (Guerbet, Villepinte, France) (Group A, n = 10), nanoplex/Lipiodol (Group B, n = 10), nanoplex-p53/Lipiodol (Group C, n = 10), and nanoplex-Rb/Lipiodol (Group D, n = 10), respectively, as calculated with one-way analysis of variance and Fisher’s least significant difference multiple comparison test.
MDR cells endured a greater chemical concentration than the sensitive cells
Examination of the half maximal inhibitory concentration showed that, in contrast to Lipiodol alone, the nanoplex/Lipiodol system did not affect tumor cells’ drug sensitivity to ADM (P = 0.705), MMC (P = 0.100), or 5-FU (P = 0.366). In comparison to the nanoplex/Lipiodol system, the three polyplexes significantly enhanced the sensitivity of the tumor cells to ADM: nanoplex-p53/Lipiodol, P = 0.016; nanoplex-Rb/Lipiodol, P = 0.047; and nanoplex-(p53+Rb)/Lipiodol, P = 0.001. For MMC, only two polyplexes significantly enhanced its sensitivity: nanoplex-Rb/Lipiodol (P = 0.030) and nanoplex-(p53+Rb)/Lipiodol (P = 0.040). For 5-FU, only nanoplex-(p53+Rb)/Lipiodol increased the sensitivity (P = 0.004). These data are summarized in Table 2.
Table 2.
The half maximal inhibitory concentration of different drugs in VX2 cells (x̄ ± s)**
| Group | Adriamycin® (mg/L) | Mitomycin C (μg/L) | Fluorouracil (mg/L) |
|---|---|---|---|
| Lipiodol®* | 0.81 ± 0.10 | 15.72 ± 2.36 | 9.20 ± 1.41 |
| Nanoplex/Lipiodol | 0.78 ± 0.17 | 13.59 ± 3.75 | 10.27 ± 2.78 |
| Nanoplex-p53/Lipiodol | 0.62 ± 0.11a,b | 11.66 ± 2.58a | 9.21 ± 3.26 |
| Nanoplex-Rb/Lipiodol | 0.65 ± 0.17a,b | 10.74 ± 2.20a,b | 8.22 ± 2.26 |
| Nanoplex-(p53+Rb)/Lipiodol | 0.55 ± 0.17a,b | 10.91 ± 3.02a,b | 6.77 ± 2.96a,b,c |
Notes:
significant difference with Groups A, B, C, D respectively as calculated with one-way analysis of variance and Fisher-lSD multiple comparison test. P < 0.05.
Guerbet, Villepinte, France.
mean value±standard difference.
mRNA expression was downregulated the most by nanoplex-(p53+Rb)/Lipiodol
Relative quantitative analysis of the 2-ddCt method showed that the mRNA level of gene expression in the Lipiodol alone and nanoplex/Lipiodol groups was not significantly different. The nanoplex-p53/Lipiodol system significantly decreased the mRNA expression of mutant p53, VEGF, P-gp, and BCRP, while the nanoplex-Rb/Lipiodol system significantly decreased the mRNA expression of CD34, VEGF, P-gp, and BCRP. The nanoplex-(p53+Rb)/Lipiodol system lowered the expression of mRNA of p53, CD34, VEGF, Twist, P-gp, and BCRP the most, and was significantly different to the other two polyplexes for some genes in this regard (Figure 8).
Figure 8.

Relative quantitative real-time polymerase chain reaction analysis of messenger RNA (mRNA) expression of each gene in tumors from ten rabbits in each group: Lipiodol® (Guerbet, Villepinte, France) (Group A), nanoplex/Lipiodol (Group B), nanoplex-p53/Lipiodol (Group C), nanoplex-Rb/Lipiodol (Group D), and nanoplex-(p53+Rb)/Lipiodol (Group E).
Notes: * Δ, ▲, and ✰ represent significant difference from Groups A, B, C, and D, respectively, as calculated with one-way analysis of variance and Fisher’s least significant difference multiple comparison test.
Abbreviations: BCRP, breast cancer resistance protein; CD34, cluster of differentiation 34; P-gp, P-glycoprotein 1; VEGF, vascular endothelial growth factor.
Protein expression was downregulated the most by nanoplex-(p53+Rb)/Lipiodol
Western blot results showed there was no significant difference in the gene expression protein level between the Lipiodol only and nanoplex/Lipiodol groups for all the proteins except for a slight decrease in BCRP. The nanoplex-p53/Lipiodol system significantly decreased the protein expression of mutant p53, VEGF, P-gp, and BCRP, while the nanoplex-Rb/Lipiodol system significantly decreased the mRNA expression of CD34, VEGF, and BCRP. The nanoplex-(p53+Rb)/Lipiodol system lowered the protein expression of p53, CD34, VEGF, Twist, P-gp, and BCRP the most, and was significantly different to the other two polyplexes for some genes in this regard (Figure 1). Subsequent semi-quantitative analyses support these results and are presented in Figure 9.
Figure 9.

Quantitative analysis using Western blot of relative protein contents for each gene in tumors from ten rabbits in each group: Lipiodol® (Guerbet, Villepinte, France) (Group A), nanoplex/Lipiodol (Group B), nanoplex-p53/Lipiodol (Group C), nanoplex-Rb/Lipiodol (Group D), and nanoplex-(p53+Rb)/Lipiodol (Group E).
Notes: * Δ, ▲, and ✰ represent significant difference from Groups A, B, C, and D, respectively, as calculated with one-way analysis of variance and Fisher’s least significant difference multiple comparison test.
Abbreviations: BCRP, breast cancer resistance protein; CD34, cluster of differentiation 34; P-gp, P-glycoprotein 1; VEGF, vascular endothelial growth factor.
Discussion
In the study reported here, we aimed to resolve two issues of a previous work.11 Thus, our first aim was to enhance the effectiveness of LNT treatment through a cooperative gene effect and out second was to determine the possible molecular mechanism of this enhancement. The therapeutic protocol was designed using p53+Rb, with the aim of enhancing the antitumor effects obtained with p53 alone in the former LNT for VX2 tumors. As expected, the p53+Rb LNT suppressed tumor growth more intensely than Rb or p53 LNT alone, which was consistent with the specific intra-tumoral expression of the two proteins. This synergistic efficiency has also been observed in combined gene therapy using cytokine and suicide genes in murine models of HCC.25,27,29 The effect of p53 and Rb in combination has been proven by Wang et al20 in breast carcinoma cell lines, which harbor Rb gene deletions as well as mutations of the p53 gene. In this study, the use of the combination of p53 and Rb in a larger animal model provides further rationale for this combined gene therapy to treat HCC.
The reason for the auxiliary effect of the two genes may be concluded from the data as follows.
First, the genes can induce apoptosis and inhibit the growth of tumor cells. Wt-p53 can block the transcription of survival signals in tumor cells, thus inhibit the growth of tumor cells,32 in addition to the direct apoptosis induction effect of that protein.33 This may explain the significant tumor growth inhibition and greater apoptosis rate with the p53 LNT than with the nanoplex system. The downregulation of mutated p53 by wt-p53 may suggest the phenotypical dominance of exogenous wt-p53 over its endogenous mutated p53 alleles. The introduction of Rb into these cells exerted a similar inhibition of growth and induction of apoptosis in the tumor cells. However, in vitro studies suggest that the restoration of Rb expression in pancreatic and bladder cancer cell lines only reduced their tumorigenicity in nude mice, with on apoptosis induction and growth inhibition.19,20,34 This may be due to the different sensitivity of the cells to the genes. Twist oncogene may affect p53 function indirectly through interfering with the alternative reading frame (ARF)/mouse double minute 2 homolog/p53 pathway,35 which may be the reason why wt-p53 gene therapy did not effect its expression in the present study. The reason for its expression in p53+Rb gene therapy is still unknown.
Second, the genes can downregulate the angiogenesis of the tumor. Tumors must develop adequate nourishing vasculature to meet the demands of their increasing growth for nutrition and oxygen. Combined gene transfer of p53 and Rb can generate decreased density of tumor blood vessels,26 as demonstrated by the immunochemistry results for MVD in the VX2 tumors in this study. The reason for this may be the modulation of the intimal hyperplasia and proliferation of vascular smooth muscle cells by Rb36 as well as the blocking of the VEGF gene by p53, which is also observed in fibroblasts.37
Third, the genes can suppress tumor metastasis. The tumor-suppressor gene p53 has inhibitory effects on cell adhesion and infiltration.38 In this study, we investigated the lower expression of Twist, a key regulator of tumor metastasis,39,40 in the group of animals that received combined gene therapy. This lower expression suggests a decrease in the invasive ability of VX2 tumors. This novel mechanism of action of wt-p53 and Rb gene transfer may contribute to their antitumor effect by downregulating Twist expression level in tumor with inactivated wild-type p53 and Rb gene expression. However, the details of the mechanism need further study.
Combined gene therapy can reverse the resistance of tumor cells against chemotherapies. The p53 tumor suppressor protein is required for the efficient execution of the cell death program induced by 5-FU, etoposide, and doxorubicin.41 The introduction of p53 made the tumor cells more sensitive to the chemicals, which agrees with results obtained in clinical trials of p53.42–44 The reason may be that p53-dependent apoptosis modulates the cytotoxicity of anticancer agents through the suppressed p21 expression.45 Moreover, this cooperative effect of p53 gene therapy and chemotherapy is independent of the endogenous p53 status.46 These data reinforce the notion that the cytotoxicity of many anticancer agents may act in part through the wt-p53.
The role of Rb in this same procedure may be due to the downregulation of P-gp and BCRP in the gene-therapy group. Consequently, that the involvement of MDR proteins in the p53+Rb LNT induced a drug sensitivity response suggests a mechanism whereby the two genes can enhance the drug concentration to some extent. So, whether the nanoparticle-mediated Rb+p53 gene therapy can synergize with chemotherapy warrants further investigation.
However, animal survival was not significantly improved and none of the tumors was completely eradicated, which suggests that further improvements of this therapy are necessary. Huh et al have reported that p53 can reinforce local tumor radiotherapy response against cervical cancer cells.47 Whether combining radiation with p53+Rb LNT will enhance the therapeutic effect is our future interest.
Conclusion
In this study, the combination of p53 with Rb gene therapy in a LNT was found to be the most efficacious approach, with this system inhibiting tumor growth significantly more than either p53 or Rb alone. It has been known for many years that HCC is related to p53 and Rb.16,48–50 This suggests that regional nano-mediated delivery of p53 and Rb may be useful for local tumor control and warrants further investigation as a potentially useful adjuvant for the treatment of advanced HCC.
Acknowledgments
This work was supported by grants from the National Natural Science Foundation of China for Young Scholars (grant no 81201810), the Doctor Project of the Natural Science Foundation of Guangdong Province (grant no S2012040007819), the Medical Scientific Research Foundation of Guangdong Province (grant no B2011094), the Medical Science and Technology Project of Guangzhou (20121A011078), and the Science and Technology Planning Project of Guangdong Province (social development: 2010B031100009).
Footnotes
Disclosure
The authors declare no conflicts of interest in this work.
References
- 1.Llovet JM, Beaugrand M. Hepatocellular carcinoma: present status and future prospects. J Hepatol. 2003;38(Suppl 1):S136–S149. doi: 10.1016/s0168-8278(02)00432-4. [DOI] [PubMed] [Google Scholar]
- 2.Kiyosawa K, Sodeyama T. Global epidemiology of hepatocellular carcinoma. Nippon Rinsho. 2001;59(Suppl 6):13–19. Japanese. [PubMed] [Google Scholar]
- 3.Mazzanti R, Gramantieri L, Bolondi L. Hepatocellular carcinoma: epidemiology and clinical aspects. Mol Aspects Med. 2008;29(1–2):130–143. doi: 10.1016/j.mam.2007.09.008. [DOI] [PubMed] [Google Scholar]
- 4.Tabor E. Hepatocellular carcinoma: global epidemiology. Dig Liver Dis. 2001;33(2):115–117. doi: 10.1016/s1590-8658(01)80062-1. [DOI] [PubMed] [Google Scholar]
- 5.Okuda K, Ohtsuki T, Obata H, et al. Natural history of hepatocellular carcinoma and prognosis in relation to treatment. Study of 850 patients. Cancer. 1985;56(4):918–928. doi: 10.1002/1097-0142(19850815)56:4<918::aid-cncr2820560437>3.0.co;2-e. [DOI] [PubMed] [Google Scholar]
- 6.Lo CM, Ngan H, Tso WK, et al. Randomized controlled trial of transarterial lipiodol chemoembolization for unresectable hepatocellular carcinoma. Hepatology. 2002;35(5):1164–1171. doi: 10.1053/jhep.2002.33156. [DOI] [PubMed] [Google Scholar]
- 7.Lin DY, Lin SM, Liaw YF. Non-surgical treatment of hepatocellular carcinoma. J Gastroenterol Hepatol. 1997;12(9–10):S319–S328. doi: 10.1111/j.1440-1746.1997.tb00516.x. [DOI] [PubMed] [Google Scholar]
- 8.Chen CA, Lo CK, Lin BL, Sibley E, Tang SC. Application of doxorubicin-induced rAAV2-p53 gene delivery in combined chemotherapy and gene therapy for hepatocellular carcinoma. Cancer Biol Ther. 2007;7(2):303–309. doi: 10.4161/cbt.7.2.5333. [DOI] [PMC free article] [PubMed] [Google Scholar]
- 9.Guan YS, Liu Y, Sun L, Li X, He Q. Successful management of postoperative recurrence of hepatocellular carcinoma with p53 gene therapy combining transcatheter arterial chemoembolization. World J Gastroenterol. 2005;11(24):3803–3805. doi: 10.3748/wjg.v11.i24.3803. [DOI] [PMC free article] [PubMed] [Google Scholar]
- 10.Schepelmann S, Hallenbeck P, Ogilvie LM, et al. Systemic gene-directed enzyme prodrug therapy of hepatocellular carcinoma using a targeted adenovirus armed with carboxypeptidase G2. Cancer Res. 2005;65(12):5003–5008. doi: 10.1158/0008-5472.CAN-05-0393. [DOI] [PubMed] [Google Scholar]
- 11.Li G, Ye L, Pan J, et al. Antitumoural hydroxyapatite nanoparticles-mediated hepatoma-targeted trans-arterial embolization gene therapy: in vitro and in vivo studies. Liver Int. 2012;32(6):998–1007. doi: 10.1111/j.1478-3231.2012.02761.x. [DOI] [PubMed] [Google Scholar]
- 12.Farshid M, Hsia CC, Tabor E. Alterations of the RB tumour suppressor gene in hepatocellular carcinoma and hepatoblastoma cell lines in association with abnormal p53 expression. J Viral Hepat. 1994;1(1):45–53. doi: 10.1111/j.1365-2893.1994.tb00061.x. [DOI] [PubMed] [Google Scholar]
- 13.Naka T, Toyota N, Kaneko T, Kaibara N. Protein expression of p53, p21WAF1, and Rb as prognostic indicators in patients with surgically treated hepatocellular carcinoma. Anticancer Res. 1998;18(1B):555–564. [PubMed] [Google Scholar]
- 14.Huang HJ, Yee JK, Shew JY, et al. Suppression of the neoplastic phenotype by replacement of the RB gene in human cancer cells. Science. 1988;242(4885):1563–1566. doi: 10.1126/science.3201247. [DOI] [PubMed] [Google Scholar]
- 15.Sumegi J, Uzvolgyi E, Klein G. Expression of the RB gene under the control of MuLV-LTR suppresses tumorigenicity of WERI-Rb-27 retinoblastoma cells in immunodefective mice. Cell Growth Differ. 1990;1(5):247–250. [PubMed] [Google Scholar]
- 16.Bishop JM. Molecular themes in oncogenesis. Cell. 1991;64(2):235–248. doi: 10.1016/0092-8674(91)90636-d. [DOI] [PubMed] [Google Scholar]
- 17.Lee WH, Bookstein R, Hong F, Young LJ, Shew JY, Lee EY. Human retinoblastoma susceptibility gene: cloning, identification, and sequence. Science. 1987;235(4794):1394–1399. doi: 10.1126/science.3823889. [DOI] [PubMed] [Google Scholar]
- 18.Ookawa K, Shiseki M, Takahashi R, Yoshida Y, Terada M, Yokota J. Reconstitution of the RB gene suppresses the growth of small-cell lung carcinoma cells carrying multiple genetic alterations. Oncogene. 1993;8(8):2175–2181. [PubMed] [Google Scholar]
- 19.Goodrich DW, Chen Y, Scully P, Lee WH. Expression of the retinoblastoma gene product in bladder carcinoma cells associates with a low frequency of tumor formation. Cancer Res. 1992;52(7):1968–1973. [PubMed] [Google Scholar]
- 20.Wang NP, To H, Lee WH, Lee EY. Tumor suppressor activity of RB and p53 genes in human breast carcinoma cells. Oncogene. 1993;8(2):279–288. [PubMed] [Google Scholar]
- 21.Fueyo J, Gomez-Manzano C, Yung WK, et al. Suppression of human glioma growth by adenovirus-mediated Rb gene transfer. Neurology. 1998;50(5):1307–1315. doi: 10.1212/wnl.50.5.1307. [DOI] [PubMed] [Google Scholar]
- 22.Riley DJ, Liu CY, Lee WH. Mutations of N-terminal regions render the retinoblastoma protein insufficient for functions in development and tumor suppression. Mol Cell Biol. 1997;17(12):7342–7352. doi: 10.1128/mcb.17.12.7342. [DOI] [PMC free article] [PubMed] [Google Scholar]
- 23.Tamura T, Nishi T, Goto T, Takeshima H, Ushio Y, Sakata T. Combination of IL-12 and IL-18 of electro-gene therapy synergistically inhibits tumor growth. Anticancer Res. 2003;23(2B):1173–1179. [PubMed] [Google Scholar]
- 24.Hirschowitz EA, Naama HA, Evoy D, Lieberman MD, Daly J, Crystal RG. Regional treatment of hepatic micrometastasis by adenovirus vector-mediated delivery of interleukin-2 and interleukin-12 cDNAs to the hepatic parenchyma. Cancer Gene Ther. 1999;6(6):491–498. doi: 10.1038/sj.cgt.7700089. [DOI] [PubMed] [Google Scholar]
- 25.Ma L, Luo L, Qiao H, et al. Complete eradication of hepatocellular carcinomas by combined vasostatin gene therapy and B7H3-mediated immunotherapy. J Hepatol. 2007;46(1):98–106. doi: 10.1016/j.jhep.2006.07.031. [DOI] [PubMed] [Google Scholar]
- 26.Sun X, Kanwar JR, Leung E, Lehnert K, Wang D, Krissansen GW. Angiostatin enhances B7.1-mediated cancer immunotherapy independently of effects on vascular endothelial growth factor expression. Cancer Gene Ther. 2001;8(10):719–727. doi: 10.1038/sj.cgt.7700370. [DOI] [PubMed] [Google Scholar]
- 27.Drozdzik M, Qian C, Xie X, et al. Combined gene therapy with suicide gene and interleukin-12 is more efficient than therapy with one gene alone in a murine model of hepatocellular carcinoma. J Hepatol. 2000;32(2):279–286. doi: 10.1016/s0168-8278(00)80073-2. [DOI] [PubMed] [Google Scholar]
- 28.Toda M, Martuza RL, Rabkin SD. Combination suicide/cytokine gene therapy as adjuvants to a defective herpes simplex virus-based cancer vaccine. Gene Ther. 2001;8(4):332–339. doi: 10.1038/sj.gt.3301392. [DOI] [PubMed] [Google Scholar]
- 29.Stefani AL, Barzon L, Castagliuolo I, et al. Systemic efficacy of combined suicide/cytokine gene therapy in a murine model of hepatocellular carcinoma. J Hepatol. 2005;42(5):728–735. doi: 10.1016/j.jhep.2004.12.037. [DOI] [PubMed] [Google Scholar]
- 30.Kanematsu T, Inokuchi K, Sugimachi K, et al. Selective effects of Lipiodolized antitumor agents. J Surg Oncol. 1984;25(3):218–226. doi: 10.1002/jso.2930250317. [DOI] [PubMed] [Google Scholar]
- 31.Li G, Chen X, Wang Q, Xu Z, Zhang W, Ye L. The roles of four multi-drug resistance proteins in hepatocellular carcinoma multidrug resistance. J Huazhong Univ Sci Technolog Med Sci. 2007;27(2):173–175. doi: 10.1007/s11596-007-0217-8. [DOI] [PubMed] [Google Scholar]
- 32.Singh B, Reddy PG, Goberdhan A, et al. p53 regulates cell survival by inhibiting PIK3CA in squamous cell carcinomas. Genes Dev. 2002;16(8):984–993. doi: 10.1101/gad.973602. [DOI] [PMC free article] [PubMed] [Google Scholar]
- 33.Wang J, Bucana CD, Roth JA, Zhang WW. Apoptosis induced in human osteosarcoma cells is one of the mechanisms for the cytocidal effect of Ad5CMV-p53. Cancer Gene Ther. 1995;2(1):9–17. [PubMed] [Google Scholar]
- 34.Simeone DM, Cascarelli A, Logsdon CD. Adenoviral-mediated gene transfer of a constitutively active retinoblastoma gene inhibits human pancreatic tumor cell proliferation. Surgery. 1997;122(2):428–433. doi: 10.1016/s0039-6060(97)90036-2. discussion 433–434. [DOI] [PubMed] [Google Scholar]
- 35.Maestro R, Dei Tos AP, Hamamori Y, et al. Twist is a potential oncogene that inhibits apoptosis. Genes Dev. 1999;13(17):2207–2217. doi: 10.1101/gad.13.17.2207. [DOI] [PMC free article] [PubMed] [Google Scholar]
- 36.Smith RC, Wills KN, Antelman D, et al. Adenoviral constructs encoding phosphorylation-competent full-length and truncated forms of the human retinoblastoma protein inhibit myocyte proliferation and neointima formation. Circulation. 1997;96(6):1899–1905. doi: 10.1161/01.cir.96.6.1899. [DOI] [PubMed] [Google Scholar]
- 37.Dameron KM, Volpert OV, Tainsky MA, Bouck N. Control of angiogenesis in fibroblasts by p53 regulation of thrombospondin-1. Science. 1994;265(5178):1582–1584. doi: 10.1126/science.7521539. [DOI] [PubMed] [Google Scholar]
- 38.Toschi E, Rota R, Antonini A, Melillo G, Capogrossi MC. Wild-type p53 gene transfer inhibits invasion and reduces matrix metalloproteinase-2 levels in p53-mutated human melanoma cells. J Invest Dermatol. 2000;114(6):1188–1194. doi: 10.1046/j.1523-1747.2000.00000.x. [DOI] [PubMed] [Google Scholar]
- 39.Yang J, Mani SA, Donaher JL, et al. Twist, a master regulator of morphogenesis, plays an essential role in tumor metastasis. Cell. 2004;117(7):927–939. doi: 10.1016/j.cell.2004.06.006. [DOI] [PubMed] [Google Scholar]
- 40.Martin TA, Goyal A, Watkins G, Jiang WG. Expression of the transcription factors snail, slug, and twist and their clinical significance in human breast cancer. Ann Surg Oncol. 2005;12(6):488–496. doi: 10.1245/ASO.2005.04.010. [DOI] [PubMed] [Google Scholar]
- 41.Lowe SW, Ruley HE, Jacks T, Housman DE. p53-dependent apoptosis modulates the cytotoxicity of anticancer agents. Cell. 1993;74(6):957–967. doi: 10.1016/0092-8674(93)90719-7. [DOI] [PubMed] [Google Scholar]
- 42.Peng Z. Current status of gendicine in China: recombinant human Ad-p53 agent for treatment of cancers. Hum Gene Ther. 2005;16(9):1016–1027. doi: 10.1089/hum.2005.16.1016. [DOI] [PubMed] [Google Scholar]
- 43.Schuler M, Herrmann R, De Greve JL, et al. Adenovirus-mediated wild-type p53 gene transfer in patients receiving chemotherapy for advanced non-small-cell lung cancer: results of a multicenter phase II study. J Clin Oncol. 2001;19(6):1750–1758. doi: 10.1200/JCO.2001.19.6.1750. [DOI] [PubMed] [Google Scholar]
- 44.Krishna R, Mayer LD. Multidrug resistance (MDR) in cancer. Mechanisms, reversal using modulators of MDR and the role of MDR modulators in influencing the pharmacokinetics of anticancer drugs. Eur J Pharm Sci. 2000;11(4):265–283. doi: 10.1016/s0928-0987(00)00114-7. [DOI] [PubMed] [Google Scholar]
- 45.Wen SF, Xie L, McDonald M, et al. Development and validation of sensitive assays to quantitate gene expression after p53 gene therapy and paclitaxel chemotherapy using in vivo dosing in tumor xenograft models. Cancer Gene Ther. 2000;7(11):1469–1480. doi: 10.1038/sj.cgt.7700257. [DOI] [PubMed] [Google Scholar]
- 46.Quist SR, Wang-Gohrke S, Köhler T, Kreienberg R, Runnebaum IB. Cooperative effect of adenoviral p53 gene therapy and standard chemotherapy in ovarian cancer cells independent of the endogenous p53 status. Cancer Gene Ther. 2004;11(8):547–554. doi: 10.1038/sj.cgt.7700727. [DOI] [PubMed] [Google Scholar]
- 47.Huh JJ, Wolf JK, Fightmaster DL, Lotan R, Follen M. Transduction of adenovirus-mediated wild-type p53 after radiotherapy in human cervical cancer cells. Gynecol Oncol. 2003;89(2):243–250. doi: 10.1016/s0090-8258(03)00054-4. [DOI] [PubMed] [Google Scholar]
- 48.Harper JW, Adami GR, Wei N, Keyomarsi K, Elledge SJ. The p21 Cdk-interacting protein Cip1 is a potent inhibitor of G1 cyclin-dependent kinases. Cell. 1993;75(4):805–816. doi: 10.1016/0092-8674(93)90499-g. [DOI] [PubMed] [Google Scholar]
- 49.Buetow KH, Murray JC, Israel JL, et al. Loss of heterozygosity suggests tumor suppressor gene responsible for primary hepatocellular carcinoma. Proc Natl Acad Sci U S A. 1989;86(22):8852–8856. doi: 10.1073/pnas.86.22.8852. [DOI] [PMC free article] [PubMed] [Google Scholar]
- 50.Hsu IC, Metcalf RA, Sun T, Welsh JA, Wang NJ, Harris CC. Mutational hotspot in the p53 gene in human hepatocellular carcinomas. Nature. 1991;350(6317):427–428. doi: 10.1038/350427a0. [DOI] [PubMed] [Google Scholar]