Abstract
Background
The successful biotherapy of carcinoma with dendritic cell (DC) vaccines pivotally relies on DCs’ migratory capability into lymph tissues and activation of T cells. Accurate imaging and evaluation of DC migration in vivo have great significance during antitumor treatment with DC vaccine. We herein examined the behavior of DCs influenced by synthetic superparamagnetic iron oxide (SPIO) nanoparticle labeling.
Methods
γ-Fe2O3 nanoparticles were prepared and DCs, which were induced from bone marrow monocytes of enhanced green fluorescent protein (EGFP) transgenic mice, were labeled. The endocytosis of the SPIO, surface molecules, cell apoptosis and fluorescence intensity of EGFP-DCs were displayed by Prussian blue staining and flow cytometry (FCM), respectively. After EGFP-DCs, labeled with SPIO, were injected into footpads (n = 5) for 24 hours, the mice were examined in vivo by optical imaging (OPI). Meanwhile, confocal imaging and FCM were applied, respectively, to detect the migration of labeled DCs into draining lymph nodes.
Results
Nearly 100% of cells were labeled by the SPIO, in which the intracellular blue color gradually deepened and the iron contents rose with the increase of labeling iron concentrations. In addition, cell apoptosis and the surface molecules on DCs were at similar levels after SPIO labeling. After confirming that the fluorescence intensity of EGFP on DCs was not influenced by SPIO, the homing ability of EGFP-DCs labeled with SPIO displayed that the fluorescence intensity and the ratios of EGFP-DCs in draining lymph nodes were gradually decreased with the increase of labeling iron concentrations.
Conclusion
The synthetic SPIO nanoparticles possess perfect labeling ability and biocompatibility. Moreover, DCs labeled with a low dose of SPIO showed stronger migratory capability in vivo.
Keywords: optical imaging, dendritic cell, superparamagnetic iron oxide, cell tracking
Introduction
Due to the multifunctional properties for biomedical applications, superparamagnetic iron oxide (SPIO) nanoparticles have been regarded as a useful tool in numerous medical diagnoses or treatment,1–3 the applications of which includes in vivo cell tracking, hyperthermia therapy, lymph node detection, and anticancer drug delivery, etc.4–7 In particular, SPIO nanoparticles can enhance contrast in magnetic resonance imaging (MRI), which allows researchers to monitor anatomical, physiological, and molecular changes during the evolution of a disease or treatment.
Dendritic cells (DCs) are professional antigen-presenting cells that play a critical role in the initiation of primary immune responses and stimulate naïve T cells.8 Accumulated data have shown that DCs can induce powerful antitumor immune responses by using their exceptional capabilities to capture antigens, process and present antigenic peptide fragments, migrate into lymphoid organs, and strengthen primary immune responses.9 DC vaccines loaded with the tumor antigen and then transfused into patients with cancer is currently one of the strategies with the most potential, which has the advantages of high efficiency, low toxicity, low side effects, and so on. Although it is difficult to prove the immunomonitoring of cellular immunotherapies, we have recently demonstrated that mouse bone marrow DCs could be safely labeled with our synthetic SPIO nanoparticles;10 meanwhile, the labeled DCs migrating into the draining popliteal lymph nodes could be monitored by the hypersensitive 7T MRI and optical imaging (OPI) techniques effectively through footpad injections.11 With the help of the MRI and OPI, we could assess the delivery of enhanced green fluorescent protein (EGFP) transgenic DCs labeled with SPIO into the lymph nodes accurately. However, only a few of the labeled DCs migrating into draining lymph nodes were observed while most cells stayed at the injected section and underwent cell apoptosis in our and other previous studies.12
As accurate delivery and targeting are crucial for the efficacy of cellular therapies, it is urgent to demonstrate imaging of cellular vaccines precisely after injection into the patient and the improvement of the efficacy of the antitumor immunity. From the data presented here, we conclude that SPIO labeled EGFP transgenic DCs migrating into local draining lymph nodes can be detected when the iron concentration for labeling is 25 μg/mL, with only about 4% labeled DCs migrating into local draining lymph nodes. But how would labeling DCs with different concentrations of synthetic SPIO influence this process?
The purpose of this study is to evaluate the impact of synthetic SPIO on DCs and to explore the migratory efficiency of DCs labeled with different concentrations of SPIO using OPI techniques.
Materials and methods
Mice
Female C57BL/6 mice and EGFP-transgenic mice of C57BL/6 background were purchased from Model Animal Research Center of Nanjing University (Nanjing, People’s Republic of China) and were kept under specified pathogen-free conditions in the Central Animal Facility, Nanjing University. For experimental purposes, the bone marrow donors were between 8 to 10 weeks old and the weight of the donors ranged from 20 to 22 g. All mice involved in the experiments were performed in accordance with protocols approved by the Animal Care and Use Committee of the Medical School, Nanjing University.
Cell culture
Monocytes, which were isolated from bone marrow of mice, were cultured with Roswell Park Memorial Institute (RPMI) medium 1640 with 100 U/mL penicillin, 100 mg/mL streptomycin (Gibco-Invitrogen, Grand Island NY, USA), 10% fetal bovine serum (Gibco, Life Technologies, Breda, The Netherlands), and 10 ng/mL granulocyte-macrophage colony-stimulating factor and 1 ng/mL interleukin (IL)-4 (eBioscience, San Diego, CA, USA). On days 2 and 4, half of the medium was removed and fresh medium was renewed. The nonadherent cells were washed out on day 6 and were incubated with tumor necrosis factor (TNF-α; 10 ng/mL), IL-1β (10 ng/mL), IL-6 (10 ng/mL; Peprotech, Rocky Hills, NJ, USA) and prostaglandin E2 (1 μg/mL; Sigma-Aldrich, St Louis, MO, USA) for 12 hours.13 The mature DCs were collected on day 7.
Cell labeling
The collected DCs were seeded in a 6-well plate and incubated at 37°C with 5% CO2. SPIO nanoparticles were prepared according to our previous work.14 Different concentrations of SPIO (0, 10, 25, 50 μg/mL) were added to the cell medium. After incubation of 12 hours, the medium was removed the cells were washed and cytospins were prepared. Thereafter, the amount of intracellular iron was visualized using a Prussian blue staining kit (Shanghai Yuanye Bio-Technology Co, Ltd People’s Republic of China) by which, according to the supplier’s instructions, the iron reacts with acid ferrocyanide to produce a blue color. Screenings were observed with a light microscope (Olympus, CKX41-A32PH, Tokyo, Japan).
Flow cytometry assay
For the phenotypic characterization assay, surface markers were tested by FCM (flow cytometry) (FACSCalibur; BD Biosciences). The following monoclonal antibodies were used for the immunophenotyping of DCs: fluorescein isothiocyanate (FITC)-MHC-II, phycoerythrin (PE)-CD80, PE-CD86, and PE-CCR7 (eBioscience) according to the manufacturer’s instructions. Meanwhile, cell apoptosis was also assayed with an Annexin V-FITC and Propidium iodide (PI) apoptosis kit, according to the recommendations of the manufacturer (Biouniquer, Nanjing, People’s Republic of China). After DCs were gated ten thousand gated cells were analyzed per sample and the detectors for FITC, PE, PI, were FL1, FL2, FL3 respectively.
Quantification of internal iron
DCs were seeded (5×10⁵) and washed twice with phosphate buffered saline (PBS) after they were treated with SPIO (0, 10, 25, 50 μg/mL) for 12 hours. The amount of iron inside the cells was investigated according to the Ge method.15 A standard curve (not shown) of an aqueous FeCl3 · 6H2O solution was adopted under the same conditions to quantify the amount of the SPIO in cellular uptake. Also, the iron content of the SPIO-labeled DCs was expressed as the amount of Fe2O3.
OPI ex vivo
After incubation with SPIO (0, 10, 25, 50 μg/mL) for 12 hours and washed thrice, EGFP fluorescence intensity of cells was studied by FCM with Cell Quest software (BD Biosciences). Then, for in vivo imaging, an inflammatory factor (TNF-α 30 ng/side)11 was preinjected into the hind footpads of C57BL/6 mice (n = 5). After 24 hours, 2 × 10⁶ EGFP-DCs loaded with various concentrations of SPIO were injected into the footpads and the control group was injected with EGFP-DCs without SPIO.
To detect the migration of DCs into draining lymph nodes ex vivo, the optical imaging of dissected popliteal and inguinal lymph nodes was performed after the administration of DCs for 24 hours using the Maestro in vivo imaging system (CRi, Woburn, MA, USA). The 484 nm excitation and emission filters (507 nm) were applied to observe the dissected lymph nodes. The fluorescent images consisting of EGFP-related fluorescence were then organized based on their spectral patterns with Living Image software (v 2.50; Caliper Corporation, Newton, MA, USA).
Immunohistochemistry
For confocal microscopic analyses, frozen lymph nodes were cryosectioned into 5 μm-thick sections and fixed with ice-cold acetone. The sections were incubated with a rabbit anti-mouse GFP antibody (Invitrogen) and washed with PBS and goat anti-rabbit Alexa 488 nm antibody (Invitrogen) was used as the secondary antibody. Samples were observed with a confocal laser scanning microscope (Fluoview, Fv10i; Olympus).
Percentage of EGFP-DCs
For comparing the percentages of DCs in draining lymph nodes, 2 × 10⁶ EGFP-DCs labeled with SPIO were infused into the footpads of mice. After 24 hours, the lymph nodes were anatomized and pooled. Next, a single cell suspension was prepared with PBS and the fluorescence of EGFP was examined by FCM. During examination, 5 × 10⁶ cells were analyzed per sample and the detector for EGFP was FL1.
Statistical analysis
Results are expressed as means ± standard deviation (SD). The statistical significance of the differences between the groups was assessed by one-way analysis of variance (ANOVA) and two-tailed Student’s t-test. A P-value < 0.05 was considered statistically significant.
Results
Efficiency and cellular uptake of SPIO labeling
To evaluate the potential for SPIO particles in tracking DCs, SPIO particles with different concentrations phagocytized by DCs were examined first. Prussian blue staining showed that almost all cells were labeled by SPIO and the intracellular blue color gradually deepened with increasing iron concentrations (Figure 1).
Figure 1.
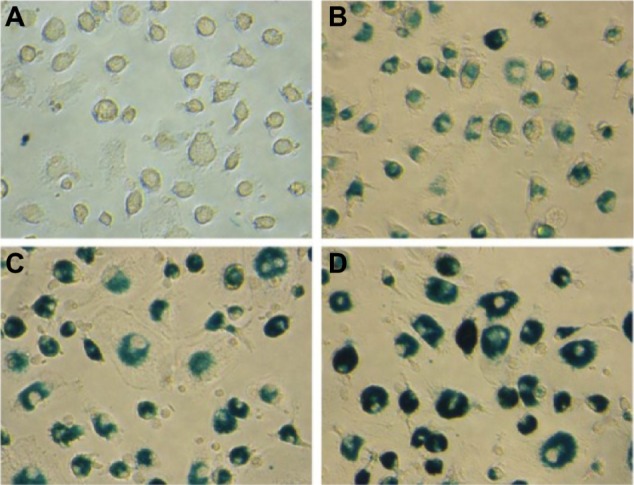
Morphology of DCs labeled with SPIO (0, 10, 25, 50 μg/mL) after 24 hour incubation with Prussian blue staining (×400).
Notes: (A) DCs; (B) DCs (SPIO, 10 μg/mL); (C) DCs (SPIO, 25 μg/mL); (D) DCs (SPIO, 50 μg/mL).
Abbreviations: DCs, dendritic cells; SPIO, superparamagnetic iron oxide.
SPIO particles internalized by DCs were also analyzed. On average, the iron contents in SPIO-DCs were 14.09 ± 0.25 μg, 20.12 ± 1.28 μg, and 25.00 ± 1.69 μg per 1 × 10⁶ cells, respectively, according to the labeling concentration of SPIO nanoparticles (Figure 2).
Figure 2.
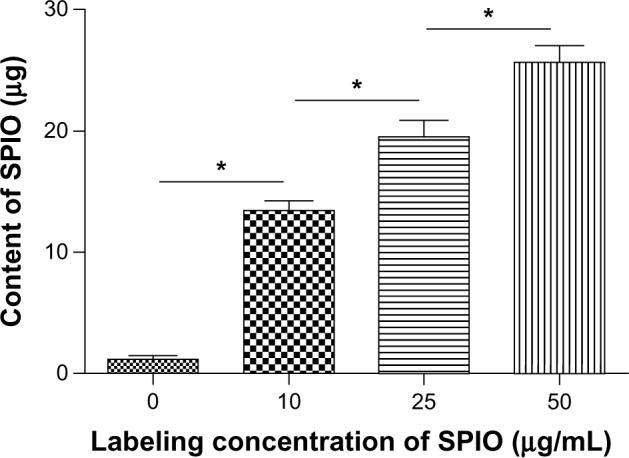
Cellular uptake of iron by DCs at 24 hours co-culture time.
Notes: Mean concentrations of iron in DCs (per 1 × 10⁶ cells) after co-culturing with 0, 25, 25, 50 μg/mL SPIO for 24 hours. *P = 0.0156.
Abbreviations: DCs, dendritic cells; SPIO, superparamagnetic iron oxide.
Cell phenotypes
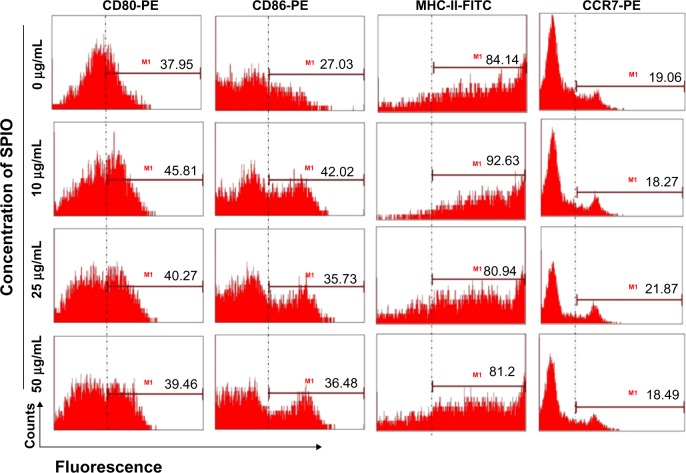
The surface molecules of mature DCs labeled with different concentrations of SPIO were characterized by FCM. The expression of CD80, CD86, MHC-II, and CCR7 of DCs did not have a detectable increase compared to those without SPIO labeling (Figure 3).
Figure 3.
Phenotypes of DCs after labeling with SPIO (0, 10, 25, 50 μg/mL; P > 0.05).
Abbreviations: CCR, chemokine receptor; CD, cluster of differentiation; DCs, dendritic cells; FITC, fluorescein isothiocyanate; MHC, major histocompatibility complex; PE, phycoerythrin; SPIO, superparamagnetic iron oxide.
Cell apoptosis assay
To test whether the apoptosis of DCs labeled with the different concentrations of SPIO nanoparticles was influenced, DCs and SPIO-DCs were analyzed by FCM after Annexin V and PI staining; there were no significant differences in the total percentage of Annexin V/PI DCs at all concentration points (Figure 4).
Figure 4.
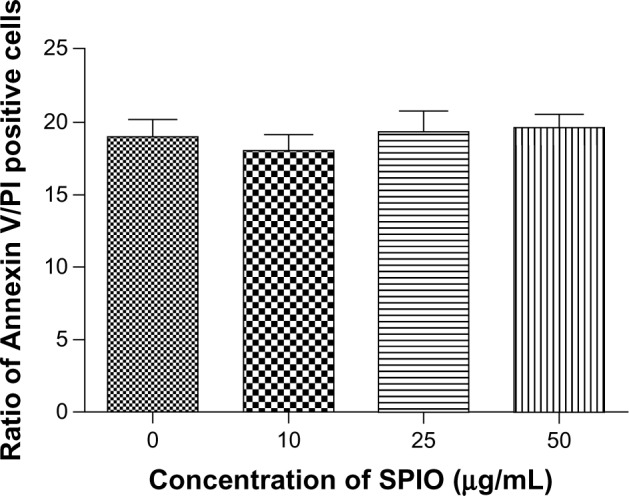
Cell apoptosis of DCs and SPIO-DCs determined by FCM at different labeling concentrations (0, 10, 25, and 50 μg/mL; P = 0.7747).
Note: Ratio of annexin V/PI positive cells refers to sum of ratio of annexin V + PI + and annexin V + PI −. Annexin V + PI + demonstrated late apoptotic cells. Annexin V + PI − demonstrated early apoptotic cells.
Abbreviations: DCs, dendritic cells; FCM, flow cytometry; PI, propidium iodide; SPIO, superparamagnetic iron oxide.
EGFP fluorescence intensity after SPIO labeling
To analyze EGFP fluorescence of DCs, FCM was performed and the results revealed no significant differences in EGFP fluorescence intensity among the groups regardless of SPIO labeling concentrations (Figure 5).
Figure 5.
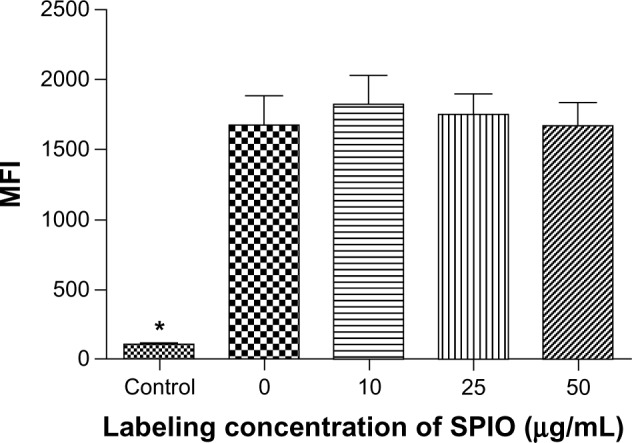
MFI of EGFP-DCs after labeling with SPIO.
Note: *P = 0.0017.
Abbreviations: EGFP, enhanced green fluorescent protein; MFI, mean fluorescence intensity; SPIO, superparamagnetic iron oxide; DCs, dendritic cells.
OPI ex vivo
To detect the amount of DCs migrating into lymph nodes, the draining lymph nodes were dissected and examined by OPI ex vivo. The images with different brightness confirmed the migration of SPIO labeled EGFP-DC into the popliteal lymph nodes. With the increasing iron concentrations, the fluorescence intensity of EGFP in popliteal lymph nodes decreased gradually and no signals were displayed in the inguinal lymph nodes 24 hours after the administration of DCs (Figure 6).
Figure 6.
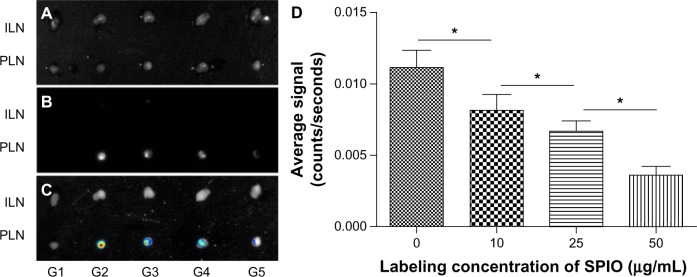
Ex vivo imaging of EGFP fluorescence signal in draining lymph nodes. (A) Overview of whole popliteal and inguinal lymph nodes; (B) draining lymph node imaging of EGFP signals ex vivo; (C) fluorescence signals analyzed by image software; (D) the measured average signal to background.
Note: *P = 0.0273 < 0.05.
Abbreviations: DCs, dendritic cells; EGFP, enhanced green fluorescent protein; G1, phosphate buffered saline; G2, DCs; G3, DCs labeled with SPIO (10 μg/mL); G4, DCs labeled with SPIO (25 μg/mL); G5, DCs labeled with SPIO (50 μg/mL); ILN, inguinal lymph nodes; PLN, popliteal lymph nodes; SPIO, superparamagnetic iron oxide.
EGFP signal localization in lymph nodes
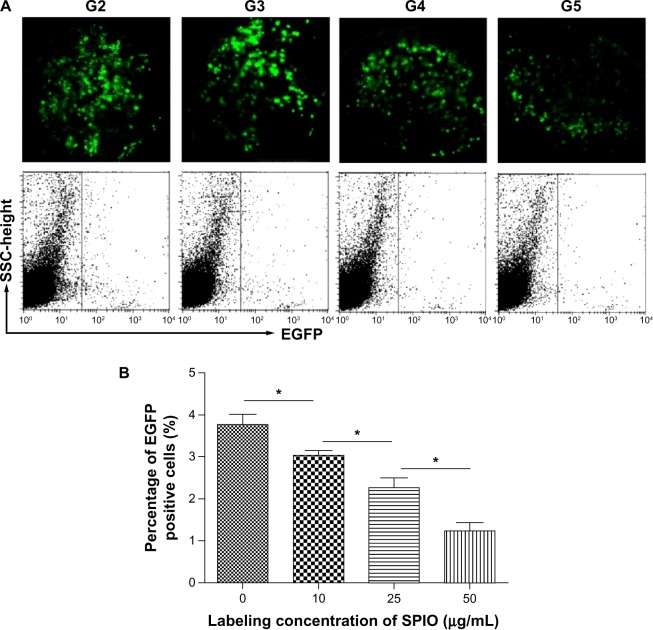
To determine whether SPIO labeling would influence DCs’ migration in vivo, evidence of EGFP localization within the areas of draining lymph nodes was confirmed by fluorescence confocal microscopy. The positive EGFP fluorescence localized in the popliteal lymph nodes was observed and the fluorescence intensity and the number of cells decreased with increasing concentration of SPIO labeling. In contrast, no fluorescence was detected in inguinal lymph nodes during the first 24 hours (Figure 7).
Figure 7.
Accumulation of DCs in the draining lymph nodes (×400). (A) Analysis of EGFP fluorescence by FCM; (B) quantitative analyses of EGFP fluorescence in popliteal LNs.
Note: *P = 0.0156.
Abbreviations: EGFP, enhanced green fluorescent protein; FCM, flow cytometry; G2, DCs; G3, DCs labeled with SPIO (10 μg/mL); G4, DCs labeled with SPIO (25 μg/mL); G5, DCs labeled with SPIO (50 μg/mL); SPIO, superparamagnetic iron oxide; DCs, dendritic cells; SSC, side scatter; LN, lymph node.
After confirming differences in SPIO labeled EGFP positive DCs distribution in lymph nodes, the ratio of migrating DCs was examined by FCM. The number of DCs that migrated into the popliteal lymph nodes were 3.77%, 3.03%, 2.27%, and 1.23%, respectively, according to SPIO labeling concentrations (Figure 7).
Discussion
Biotherapy for cancer has been of great interest to clinicians. However, many clinical trials designed with DCs to elicit immunity against solid tumors have not induced effective anti-tumor immunity.16,17 One of the reasons for the therapeutic deficiencies might be the fact that most DCs remain at the injection site and undergo apoptosis instead of migrating into lymphoid tissues.12,18 Since tracking DC migration in vivo is a novel non-invasive technique, the influence of different concentrations of the synthetic SPIO labeling on DCs was observed and, at the same time, the migration of SPIO labeled EGFP transgenic DCs was explored with an OPI approach in this study.
SPIO particles have been widely used as agents for cell labeling and tracking for magnetic resonance imaging.14,19 These nanoparticles have been confirmed to be delivered into DCs by our previous study.10 In this study, we examined DCs labeled with different concentrations of SPIO nanoparticles by Prussian blue staining and found that cellular iron increased gradually with the increase in ferric concentration (Figures 1 and 2). Changes in cell morphology were not observed under a light microscope, suggesting the morphology of DCs was minimally influenced by higher concentrations of SPIO labeling. Pauline Verdijk et al20 had shown an average of 30 μg of intracellular iron per 1 × 10⁶ cells without compromising cell viability by 200 μg ferrumoxide/mL labeling and 4 days co-culture time, which means this kind of synthetic SPIO used in the present study can be more easily inserted into DCs than other kinds of SPIO.
Before synthetic SPIO can be used to track DCs in vivo, the phenotypes of DCs following SPIO labeling should be considered. In this study, the expression of the major histocompatibility complex (MHC)-II molecule, the costimulatory molecules CD80, CD86, and the chemokine receptor CCR7 were investigated. These molecules were detected by FCM 12 hours after SPIO labeling and the negative results demonstrated that this type of synthetic SPIO had little effect on the phenotype of DCs. Besides these phenotypic effects, apoptosis of DCs with different intracellular iron contents were also assessed and no significant differences were found with respect to either early apoptosis or late apoptosis (Figures 3 and 4). From the data mentioned above, it is evident that synthetic SPIO labeling did not interfere with DCs’ maturation, expression of migration molecules, or apoptosis, which was similar to other kinds of SPIO nanoparticles modified by different materials.21,22
To analyze the migratory efficiency of DCs loaded with different concentrations of SPIO in vivo, the OPI technique was adopted. Because dying cells would lose their autofluorescence rapidly, EGFP were not only regarded as a tool for tracking cell migration, but also a marker for the viability of cells.23 Based on EGFPs’ continuous expression compared to other fluorescent dyes, DCs were induced from bone marrow monocytes of EGFP transgenic mice. An important aspect of the migration ability of EGFP-DCs loaded with SPIO is whether the fluorescence intensity of EGFP-DCs would be influenced by SPIO labeling. The FCM results showed that the intensity of the fluorescent signal of EGFP in DCs did not weaken with different concentrations of SPIO labeling compared to EGFP-DCs alone, which means that fluorescence intensity of EGFP in DCs were minimally influenced by synthetic SPIO endocytosis (Figure 5).
Efficacy of biotherapies based on DCs requires a sufficient number of DCs to migrate into appropriate tissues to induce or modulate immune responses and present relevant antigens to naïve T cells in draining lymph nodes of infection or tumor. Although migration efficiency was ineffective, we demonstrated that SPIO-EGFP-DCs could migrate into draining popliteal lymph nodes though footpad injection with a specific SPIO labeling concentration of 25 μg/mL.11 To define the homing capabilities of DCs labeled with different concentrations of synthetic SPIO, OPI was performed in this study, which has recently gained attention for tracking cells labeled with fluorescent dyes in vivo because of its high spatial resolution. Our results showed strong EGFP expression in popliteal lymph nodes during the first 24 hours and the intensity of fluorescence weakened gradually with the increase in labeling concentrations of SPIO (Figure 6). The optical images also verified that the fluorescence signals of EGFP existed within popliteal lymph nodes in the first 24 hours. On the contrary, it was not detected in the secondary draining inguinal lymph nodes, which was also in accordance with other studies.24–26 Further similar evidence of EGFP expression detected by immunohistochemistry and FCM was revealed in which DCs without SPIO labeling had the strongest migration ability and those with the most content of intracellular SPIO had the weakest migration ability during the first 24 hours after DCs’ infusion (Figure 7).
Based on the data presented here, there was sufficient proof to confirm the migration of EGFP-DCs with different concentrations of synthetic SPIO labeling into the first draining lymph nodes in the short term, which suggests that DCs would maintain stronger migration capability when labeled with a low dose of SPIO when tracking them in vivo. Consequently, further experiments exploring the mechanisms behind DC migratory capabilities with different concentrations of the synthetic SPIO are currently underway.
Acknowledgments
We acknowledge the kind support of Prof Ning Gu, Yayi Hou, and Zichun Hua for technical assistance. The authors are grateful for grants from the National Important Science Research Program of China (2011CB933503), the National Natural Sciences Foundation of China (81271698), the Project of Natural Science Foundation of Jiangsu Province (BK2012744, BK2012075), and the Nanjing Medical Development Foundation (ZKX10031, ZKX12034, 201201077).
Footnotes
Disclosure
The authors report no conflicts of interest in this work.
References
- 1.Grazú V, Silber AM, Moros M, et al. Application of magnetically induced hyperthermia in the model protozoan Crithidia fasciculata as a potential therapy against parasitic infections. Int J Nanomedicine. 2012;7:5351–5360. doi: 10.2147/IJN.S35510. [DOI] [PMC free article] [PubMed] [Google Scholar]
- 2.Raoof M, Corr SJ, Kaluarachchi WD, et al. Stability of antibody-conjugated gold nanoparticles in the endolysosomal nanoenvironment: implications for noninvasive radiofrequency-based cancer therapy. Nanomedicine. 2012;8(7):1096–1105. doi: 10.1016/j.nano.2012.02.001. [DOI] [PMC free article] [PubMed] [Google Scholar]
- 3.Chen R, Yu H, Jia ZY, Yao QL, Teng GJ. Efficient nano iron particle-labeling and noninvasive MR imaging of mouse bone marrow-derived endothelial progenitor cells. Int J Nanomedicine. 2011;6:511–519. doi: 10.2147/IJN.S16934. [DOI] [PMC free article] [PubMed] [Google Scholar]
- 4.Daldrup-Link HE, Rudelius M, Piontek G, et al. Migration of iron oxide-labeled human hematopoietic progenitor cells in a mouse model: in vivo monitoring with 1.5-T MR imaging equipment. Radiology. 2005;234(1):197–205. doi: 10.1148/radiol.2341031236. [DOI] [PubMed] [Google Scholar]
- 5.Murase K, Oonoki J, Takata H, et al. Simulation and experimental studies on magnetic hyperthermia with use of superparamagnetic iron oxide nanoparticles. Radiol Phys Technol. 2011;4(2):194–202. doi: 10.1007/s12194-011-0123-4. [DOI] [PubMed] [Google Scholar]
- 6.Mori Y, Umeda M, Fukunaga M, Ogasawara K, Yoshioka Y. MR contrast in mouse lymph nodes with subcutaneous administration of iron oxide particles: size dependency. Magn Reson Med Sci. 2011;10(4):219–227. doi: 10.2463/mrms.10.219. [DOI] [PubMed] [Google Scholar]
- 7.McBain SC, Yiu HH, Dobson J. Magnetic nanoparticles for gene and drug delivery. Int J Nanomedicine. 2008;3(2):169–180. doi: 10.2147/ijn.s1608. [DOI] [PMC free article] [PubMed] [Google Scholar]
- 8.O’Neill DW, Adams S, Bhardwaj N. Manipulating dendritic cell biology for the active immunotherapy of cancer. Blood. 2004;104(8):2235–2246. doi: 10.1182/blood-2003-12-4392. [DOI] [PubMed] [Google Scholar]
- 9.Xu Q, Liu G, Yuan X, et al. Antigen-specific T-cell response from dendritic cell vaccination using cancer stem-like cell-associated antigens. Stem Cells. 2009;27(8):1734–1740. doi: 10.1002/stem.102. [DOI] [PMC free article] [PubMed] [Google Scholar]
- 10.Mou Y, Chen B, Zhang Y, et al. Influence of synthetic superparamagnetic iron oxide on dendritic cells. Int J Nanomedicine. 2011;6:1779–1786. doi: 10.2147/IJN.S23240. [DOI] [PMC free article] [PubMed] [Google Scholar]
- 11.Mou Y, Hou Y, Chen B, et al. In vivo migration of dendritic cells labeled with synthetic superparamagnetic iron oxide. Int J Nanomedicine. 2011;6:2633–2640. doi: 10.2147/IJN.S24307. [DOI] [PMC free article] [PubMed] [Google Scholar]
- 12.Verdijk P, Aarntzen EH, Lesterhuis WJ, et al. Limited amounts of dendritic cells migrate into the T-cell area of lymph nodes but have high immune activating potential in melanoma patients. Clin Cancer Res. 2009;15(7):2531–2540. doi: 10.1158/1078-0432.CCR-08-2729. [DOI] [PubMed] [Google Scholar]
- 13.Xie H, Hua C, Sun L, et al. 17β-estradiol induces CD40 expression in dendritic cells via MAPK signaling pathways in a minichromosome maintenance protein 6-dependent manner. Arthritis Rheum. 2011;63(8):2425–2435. doi: 10.1002/art.30420. [DOI] [PubMed] [Google Scholar]
- 14.Yao K, Yun J, Shen S, Wang L, He X, Yu X. Characterization of a novel continuous supermacroporous monolithic cryogel embedded with nanoparticles for protein chromatography. J Chromatogr A. 2006;1109(1):103–110. doi: 10.1016/j.chroma.2006.01.014. [DOI] [PubMed] [Google Scholar]
- 15.Ge Y, Zhang Y, Xia J, et al. Effect of surface charge and agglomerate degree of magnetic iron oxide nanoparticles on KB cellular uptake in vitro. Colloids Surf B Biointerfaces. 2009;73(2):294–301. doi: 10.1016/j.colsurfb.2009.05.031. [DOI] [PubMed] [Google Scholar]
- 16.Norian LA, Rodriguez PC, O’Mara LA, et al. Tumor-infiltrating regulatory dendritic cells inhibit CD8+ T cell function via L-arginine metabolism. Cancer Res. 2009;69(7):3086–3094. doi: 10.1158/0008-5472.CAN-08-2826. [DOI] [PMC free article] [PubMed] [Google Scholar]
- 17.Liu Q, Zhang C, Sun A, Zheng Y, Wang L, Cao X. Tumor-educated CD11bhighIalow regulatory dendritic cells suppress T cell response through arginase I. J Immunol. 2009;182(10):6207–6216. doi: 10.4049/jimmunol.0803926. [DOI] [PubMed] [Google Scholar]
- 18.De Vries IJ, Krooshoop DJ, Scharenborg NM, et al. Effective migration of antigen-pulsed dendritic cells to lymph nodes in melanoma patients is determined by their maturation state. Cancer Res. 2003;63(1):12–17. [PubMed] [Google Scholar]
- 19.Yao Y, Wang Y, Zhang Y, et al. In vivo imaging of macrophages during the early-stages of abdominal aortic aneurysm using high resolution MRI in ApoE mice. PLoS ONE. 2012;7(3):e33523. doi: 10.1371/journal.pone.0033523. [DOI] [PMC free article] [PubMed] [Google Scholar]
- 20.Verdijk P, Scheenen TW, Lesterhuis WJ, et al. Sensitivity of magnetic resonance imaging of dendritic cells for in vivo tracking of cellular cancer vaccines. Int J Cancer. 2007;120(5):978–984. doi: 10.1002/ijc.22385. [DOI] [PubMed] [Google Scholar]
- 21.Guo L, Huang J, Zheng LM. Control generating of bacterial magnetic nanoparticle-doxorubicin conjugates by poly-L-glutamic acid surface modification. Nanotechnology. 2011;22(17):175102. doi: 10.1088/0957-4484/22/17/175102. [DOI] [PubMed] [Google Scholar]
- 22.Sun Z, Yathindranath V, Worden M, et al. Characterization of cellular uptake and toxicity of aminosilane-coated iron oxide nanoparticles with different charges in central nervous system-relevant cell culture models. Int J Nanomedicine. 2013;8:961–970. doi: 10.2147/IJN.S39048. [DOI] [PMC free article] [PubMed] [Google Scholar]
- 23.Eggert AA, van der Voort R, Torensma R, et al. Analysis of dendritic cell trafficking using EGFP-transgenic mice. Immunol Lett. 2003;89(1):17–24. doi: 10.1016/s0165-2478(03)00105-6. [DOI] [PubMed] [Google Scholar]
- 24.MartIn-Fontecha A, Sebastiani S, Höpken UE, et al. Regulation of dendritic cell migration to the draining lymph node: impact on T lymphocyte traffic and priming. J Exp Med. 2003;198(4):615–621. doi: 10.1084/jem.20030448. [DOI] [PMC free article] [PubMed] [Google Scholar]
- 25.Pham W, Xie J, Gore JC. Tracking the migration of dendritic cells by in vivo optical imaging. Neoplasia. 2007;9(12):1130–1137. doi: 10.1593/neo.07586. [DOI] [PMC free article] [PubMed] [Google Scholar]
- 26.Christian NA, Benencia F, Milone MC, et al. In vivo dendritic cell tracking using fluorescence lifetime imaging and near-infrared-emissive polymersomes. Mol Imaging Biol. 2009;11(3):167–177. doi: 10.1007/s11307-008-0184-x. [DOI] [PMC free article] [PubMed] [Google Scholar]


