

Background: The low activation threshold of T-type CaV3.2 channels is central to neuronal rhythmogenesis.
Results: The S4-S5 linker of Domain II is functionally coupled with Domains II and III during channel activation.
Conclusion: Activation of CaV3.2 requires a specific interaction between adjacent domains.
Significance: Disrupting this protein interface could be a pharmacological strategy to decrease Ca2+ influx in neuronal pathologies.
Keywords: Calcium Channels, Electrophysiology, Epilepsy, Gating, Homology Modeling, Thermodynamics, Cut-open Oocyte
Abstract
T-type CaV3 channels are important mediators of Ca2+ entry near the resting membrane potential. Little is known about the molecular mechanisms responsible for channel activation. Homology models based upon the high-resolution structure of bacterial NaV channels predict interaction between the S4-S5 helix of Domain II (IIS4-S5) and the distal S6 pore region of Domain II (IIS6) and Domain III (IIIS6). Functional intra- and inter-domain interactions were investigated with a double mutant cycle analysis. Activation gating and channel kinetics were measured for 47 single mutants and 20 pairs of mutants. Significant coupling energies (ΔΔGinteract ≥ 1.5 kcal mol−1) were measured for 4 specific pairs of mutants introduced between IIS4-S5 and IIS6 and between IIS4-S5 and IIIS6. In agreement with the computer based models, Thr-911 in IIS4-S5 was functionally coupled with Ile-1013 in IIS6 during channel activation. The interaction energy was, however, found to be stronger between Val-907 in IIS4-S5 and Ile-1013 in IIS6. In addition Val-907 was significantly coupled with Asn-1548 in IIIS6 but not with Asn-1853 in IVS6. Altogether, our results demonstrate that the S4-S5 and S6 helices from adjacent domains are energetically coupled during the activation of a low voltage-gated T-type CaV3 channel.
Introduction
Voltage-dependent Ca2+ channels (CaV)3 are membrane proteins that play a key role in promoting Ca2+ influx in response to membrane depolarization in excitable cells. Voltage-gated Ca2+ channels form oligomeric complexes that are classified according to the structural properties of the pore-forming CaVα1 subunit. The CaVα1 subunit bears high topological homology with the α subunit of NaV channels with 24 transmembrane segments clustered in 4 homologous domains, each of which is analogous to a single subunit of Kv channels. The primary structures for 10 distinct CaVα1 subunits (1–7) are classified into three main subfamilies according to their high-voltage activated gating (HVA CaV1 and HVA CaV2) or low-voltage activated gating (LVA CaV3). In HVA CaV1 and CaV2 channels, auxiliary subunits include a cytoplasmic CaVβ subunit, a mostly extracellular CaVα2δ subunit, and calmodulin constitutively bound to the C terminus of CaVα1 (7–12) (for review, see Ref. 9). LVA T-type CaV3 channels are currently believed to achieve voltage-dependent activation and plasma membrane targeting without a significant contribution from CaVβ and CaVα2δ auxiliary subunits.
LVA T-type CaV3 channels open in response to a small membrane depolarization, making these channels the key mediators of Ca2+ entry near the resting membrane potential (14–17). They contribute to rhythmogenesis, sensory transmission, dendritic integration, cell proliferation, and differentiation. Alterations in T-type channel activity have been associated with pain signaling and a wide range of neuronal pathologies including idiopathic generalized epilepsies (18–21). Hence the T-type CaV3 channel has arisen as an important pharmacological target for the treatment of neurological and psychiatric disorders such as schizophrenia, mania, dementia, and epilepsy.
The molecular mechanisms controlling the voltage-dependent activation of T-type CaV3 channel remain, however, largely unknown. Many regions appear to participate in the channel gating. The loop between Domains I and II (I-II loop) appears to play a major role in this process (22–25) but molecular determinants are distributed in the IIIS6 pore domain (26, 27), on the C terminus (28) and the pore helix (29), and on S4 segments (30). Nonetheless, the series of events linking channel depolarization and pore opening have been only scarcely addressed.
The current model of activation postulates that the electrically driven outward movement and rotation of the S4 segment will lead to pore opening through a cascade of events that include pulling on the S4-S5 linker and bending the S6 segments to open the bundle crossing at their intracellular ends (31). In HVA CaV1.2, CaV2.1, and CaV2.3 channels, a cluster of hydrophobic residues in the distal S6 pore region were shown to stabilize the channel closed state (32–39). In particular, we have shown that the conserved isoleucine residue in distal S6 was functionally coupled with a leucine residue at position 596 in the S4-S5 helix during the activation of HVA CaV2.3 (39). Whether each of the four domains moves independently or in a concerted fashion remains to be established. By comparison, the opening of the Shaker KV channel involves multiple activation steps as the S4 segments move from the resting state toward the activated state, which is followed by a concerted opening transition of the four identical S6 gates (40). This transition has been shown to occur through atomic interaction between adjacent subunits/domains (41).
In this current work, we have investigated the role of domain/domain interaction within the pore-forming CaVα1 subunit during the activation of CaV3.2, a LVA CaV channel. Unlike HVA channels, the CaVα1 subunit of CaV3.2 can be functionally expressed in the absence of CaVβ and CaVα2δ auxiliary subunits thus minimizing their effects on activation gating. To get structural clues regarding interaction interfaces, we produced three-dimensional models of the T-type CaV3.2 channel by homology with the recently published high-resolution three-dimensional structures of the bacterial NaVRh (42) and NaVAb channels in the closed and partially inactivated states (43, 44) (Fig. 1). The two homology models of CaV3.2 predict multiple points of interaction between adjacent domains. A total of 20 double mutants were herein functionally characterized using a double mutant cycle analysis. Strong interaction energies were measured for 4 pairs of mutants between the IIS4-S5 helix and the distal S6 helices of Domains II and III. Altogether our results confirm that the proximal IIS4-S5 helix is functionally coupled with the IIS6 region during channel activation. We also demonstrate that the distal IIS4-S5 helix is significantly coupled with residues in the IIIS6 region during the activation gating of CaV3.2. These results support of model of activation gating whereby opening of voltage-activated Ca2+ channels involves protein-protein interaction between adjacent domains and results in the concerted movement of the four domains.
FIGURE 1.
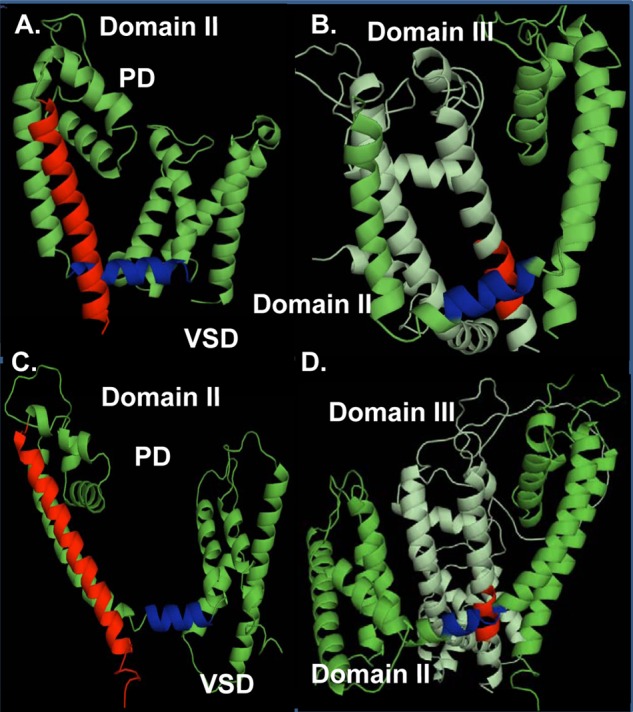
Modeling of Domains II and III was based upon the atomic coordinates of NaVAb (PDB code 3RVY) (panels A and B) and NaVRh (PDB code 4DXW) (panels C and D). Four different views of the computer-based molecular models of Domain II (panels A and C) and Domains II and III (panels B and D) of CaV3.2 are shown in a schematic representation. Modeling was achieved with Modeler 9v4. Panels A and C, the regions in red correspond to the IIS6 and the regions in blue correspond to the IIS4-S5. Panel B and D, the regions in red correspond to the predicted region in the IIIS6 could be interacting with the region in blue in the IIS4-S5. PD, pore domain; VSD, voltage sensor domain. The figures were produced using PyMol (DeLano Scientific).
EXPERIMENTAL PROCEDURES
Recombinant DNA Techniques
The human CaV3.2 (GenBankTM AF051946) (5) was a gift from Edward Perez-Reyes (University of Virginia) and Leanne L. Cribbs (Loyola University). Point mutations were produced with the QuikChange XL-mutagenesis kit (Agilent Technologies, Santa Clara, CA) using 39-mer primers as described elsewhere (38, 39, 45). Constructs were verified by automated double-stranded sequence analysis (Genomics Platform, IRIC, Université de Montréal, QC, Canada). Run-off transcripts were prepared using the T7 RNA polymerase mMessage mMachine® transcription kit (Ambion, Invitrogen) and stored at −20 °C before use.
Functional Expression of CaV3.2
Oocytes were obtained from female Xenopus laevis clawed frogs as described previously (38, 39, 46). Oocytes were injected with 46 or 4.6 nl of a solution containing 1 μg/μl of cRNA coding for the CaV3.2 WT or mutant and incubated for 2 to 5 days after RNA injection.
Electrophysiological Recordings and Data Acquisition
Wild-type and mutant channels were screened at room temperature for macroscopic Ba2+ currents and for gating currents, with the cut-open oocyte voltage-clamp technique using a CA-1B amplifier (Dagan Corp., Minneapolis, MN) (47, 48) as described before (39). The membrane of the oocyte exposed to the bottom chamber was permeabilized by a brief treatment with 0.1% saponin. Data acquisition was performed with the Digidata 1322A 16-bit system (Molecular Devices, Sunnyvale, CA). The pCLAMP 10 software was used for on-line data acquisition and analysis.
Whole cell currents were recorded in the presence of an external solution containing 10 mm BaOH, 110 mm NaOH, 1 mm KOH, and 20 mm Hepes, titrated to pH 7.0 with methanesulfonic acid (49). The internal solution in contact with the oocyte cytoplasm was 120 mm N-methyl-d-glucamine, 10 mm EGTA, and 10 mm Hepes, titrated to pH 7.0 with methanesulfonic acid. Functional expression of mutants was deemed significant with whole cell Ba2+ currents larger than −50 nA. Current-voltage relationships were measured using a series of 150-ms voltage pulses (2 mV steps) applied at a frequency of 0.2 Hz from a holding potential of −100 mV. The holding potential was decreased to −120 mV for mutants displaying a negative shift in the voltage dependence of inactivation. Leak currents were subtracted off-line. Steady-state inactivation was determined using a one-pulse protocol with a 2-s conditioning pulse of varying amplitude followed by a test pulse at the voltage yielding the peak current and was applied at a frequency of 0.02 Hz. Normalized currents obtained at the test pulse (I/Imax) were fitted with a standard Boltzmann equation as described elsewhere (38, 46, 50). Recovery from inactivation was studied by using a paired-pulse protocol. Briefly, whole cell Ba2+ currents were inactivated with 1-s pulses to −20 mV and recovery was examined at a test pulse of −20 mV after a series of variable intervals at −100 mV.
Gating currents were recorded in the presence of an external solution containing 2 mm CoCl2, 110 mm NaOH, and 10 mm Hepes, titrated to pH 7.0 with methanesulfonic acid (49). Hence the voltage dependence of gating charge movement and activation of macroscopic currents are measured with different divalent ion concentrations. Others have shown that this substitution left the charge movement unaltered and caused no changes in the surface potential (49). The internal solution in contact with the oocyte cytoplasm was 110 mm potassium glutamate and 10 mm Hepes, titrated to pH 7.0 with KOH. Gating currents were filtered at 1 kHz and digitized at 10 kHz. Holding potential was −120 mV and 30-ms voltage steps were evoked from −120 to 0 mV by 2-mV increments. Gating charge versus voltage (Q-V) relationships were obtained by integrating the OFF gating currents and then fitting single Boltzmann functions (Equation 1) according to,
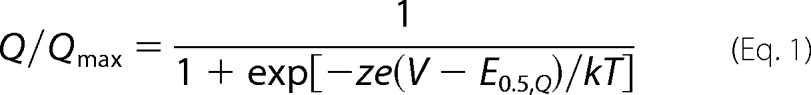 |
where the parameter e is the elementary electric charge; E0.5,Q is the mid-potential of charge displacement, k is the Boltzmann constant; z is the effective valence.
Data Analysis
Activation curves were obtained from normalized current-voltage (I-V) relationships. The estimation of E0.5,act using nonstationary measurements rests upon the assumption that the transition to the open state is much faster than the transition to the inactivated state. The voltage dependence of activation was estimated using the normalized conductance-voltage (G-V) data with G = I/(Vm − Er), where I is the normalized peak whole cell current, Vm is the voltage command, and Er is the reversal potential. Normalized conductance values were fitted with a standard Boltzmann equation,
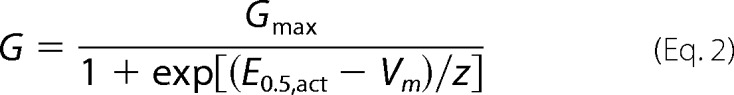 |
where E0.5,act is the mid-potential of activation, and z is the effective valence. Each data point was reported as the mean of individual measurements ± S.E. as described elsewhere (38, 46, 50). The free energy of activation was calculated using the mid-potential of activation.
Activation, inactivation, and deactivation time constants of whole cell current traces were estimated with the predefined equations in Clampfit 10 that uses the Chebyshev routine and a 4-point smoothing filter with a single exponential function. Statistical analyses were performed using the one-way analysis of variance fitting routine for two independent populations included in OriginPro 8.0. Data were considered statistically significant at p < 0.05.
Double Mutant Cycle Analysis
The coupling or interaction energy ΔΔGact,interact during channel activation was calculated as follows,
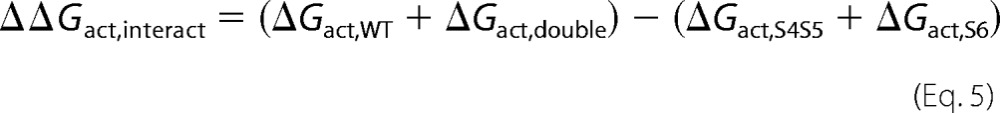 |
where ΔGact,wt is the free energy of activation of the wild-type channel, ΔGact,double is the free energy of activation of the double glycine mutant, ΔGact,S4-S5 is the free energy of activation of the single glycine mutant in the S4-S5 linker, and ΔGact,S6 is the free energy of activation of the single glycine mutant in S6. ΔΔGact,interact = 0 suggests that the activation energies are purely additive hence that the residues are not functionally coupled. A value of ΔΔGinteract more positive than +1 kcal mol−1 or more negative than −1 kcal mol−1 (|ΔΔGinteract |> 1) was considered significantly different in similar studies (39, 51, 52). The coupling or interaction energy ΔΔGinact,interact during channel inactivation was calculated as follows,
 |
where ΔGinact,wt is the free energy of inactivation of the wild-type channel, ΔGinact,double is the free energy of inactivation of the double glycine mutant, ΔGinact,S4-S5 is the free energy of inactivation of the single glycine mutant in the S4-S5 linker, and ΔGinact,S6 is the free energy of inactivation of the single glycine mutant in S6.
Homology Modeling of CaV3.2
The primary sequence of CaV3.2 was aligned with NaVAb and NaVRh by using T-COFFEE. The computer-based molecular models of CaV3.2 were obtained with the stand-alone Modeler 9v4 software using the molecular coordinates of NaVAb (PDB 3RVY and 4EKW) (43, 44) and NaVRh (PDB 4DXW) (42) (Fig. 1). The first NaVAb structure that was reported (PDB 3RVY) was estimated to depict the channel into an intermediate conformation along the channel activation pathway (53), whereas the second structure (PDB 4EKW) captured the channel in the inactivated state. The activation gate of NaVRh also appears to be in the closed state. Although the structure of NaVMs is reported to be captured in the open state, it lacks the S4-S5 linkers (54). Fifty models were generated and the models with the lowest molpdf scoring function (as provided in PyMol) were selected. The modeling was restricted to Domains II, III, and IV because Domain I of CaV3.2 displays a stretch of 100 residues in the loop preceding the pore region that could not be modeled with the current templates. In Domain II, CaV3.2 displays a series of 12 contiguous residues after transmembrane domain S5 that are not modeled, whereas in Domain III, the stretch of residues not accounted for by either template amounts to 27 residues at the same position. The gaps in the structural model imply a certain degree of uncertainty in the final model, especially in regard to the orientation of the S4-S5 linker with respect to the S6 residues. Despite these gaps, the structural homology for the S4-S5 to S6 region in Domains II and III is conclusive with an average root mean square deviation of 1.6 Å for the NaVRh-based model and 1.3 Å for the NaVAb-based model.
RESULTS
Activation Gating of Glycine Mutants in IIS6
The T-type CaV3.2 channel was functionally expressed in Xenopus oocytes and its electrophysiological properties were measured with the cut-open oocyte technique in the presence of 10 mm Ba2+ as the charge carrier. As seen in Fig. 2, its biophysical properties were comparable with the properties reported in the original cloning paper (5) and after recombinant expression in HEK cells (55). Under our conditions, CaV3.2 was activated with E0.5,act = −48 ± 1 mV (n = 37), which is similar to E0.5,act = −45.8 ± 0.7 mV reported in HEK cells in the presence of 1.25 mm Ca2+ in the external medium (55). This negative activation potential translated into a ΔGact = −4.3 ± 0.2 kcal mol−1 (n = 37). CaV3.2 activates at significantly more negative voltages than HVA CaV2.3 with E0.5,act = −7 mV for the latter (39). The channel kinetics were typical of current-dependent inactivation with activation and inactivation kinetics becoming increasingly faster after the threshold potential (55). Other properties include a relatively slow deactivation time constant of 12 ± 1 ms (n = 9) at −40 mV and a time constant for recovery (τrecovery) from inactivation of 480 ± 1 ms (n = 10), which is similar to the τrecovery = 395 ms reported in HEK cells (55). Channels were inactivated with E0.5,inact = −65 ± 1 mV (n = 10). These activation and inactivation parameters suggest a window current between −65 and −50 mV as shown for native T-type currents in vestibular neurons (56). The complete set of biophysical parameters is shown in Table 1.
FIGURE 2.

A, whole cell current traces are shown for CaV3.2 WT. Current traces were obtained using the cut-open oocyte technique in 10 mm Ba2+ from a holding potential of −100 mV. Leak subtraction was carried out off-line. B, bar graphs of the mean time constants of activation and inactivation of the CaV3.2 WT are shown as a function of the test potential. Leak-subtracted whole cell current traces were fitted by a sum of two exponential equations, one for the activation and the other one for inactivation (55). C, normalized current-voltage relationships for CaV3.2 WT were obtained by fitting the experimental data to a modified Boltzmann equation. D, representative tail currents for CaV3.2 WT. Currents were activated during 20-ms conditioning depolarizing voltage pulses at −30 mV. Deactivation was recorded during subsequent repolarization to test potentials from −120 to −20 mV (10-mV increments) as illustrated on the pulse protocol. E, the mean time constants of deactivation were obtained from fitting current traces with monoexponential functions. The mean deactivation time constant was 8.4 ± 0.6 ms (n = 9) at −50 mV for CaV3.2 WT. F, normalized gating charge (Q/Qmax) and normalized conductance (G/Gmax) were plotted against the test voltages for CaV3.2 WT. As seen, both curves overlapped in contrast to observations reported in Kv channels where the Q/Qmax is left-shifted as compared with the G/Gmax curve. Mid-points were −44 ± 1 mV (n = 4) for Q/Qmax and −47 ± 1 mV (n = 37) for G/Gmax. G, time course of recovery from inactivation for the CaV3.2 WT. Recovery was measured using a double pulse protocol. A 1-s prepulse to −20 mV induced inactivation and, after a variable period at −100 mV, a test pulse to the same voltage (−20 mV) was applied to assess the extent to which channels had recovered from inactivation. H, data points from panel G were fitted with a single exponential equation of 480 ± 1 ms (n = 10). I, voltage dependence of inactivation for CaV3.2 WT was estimated from isochronal inactivation data points measured after 2-s conditioning pulses applied between −110 and 0 mV from a holding potential of −100 mV. The fraction of the noninactivating current was fitted with a Boltzmann equation yielding E0.5,inact = −65 ± 1 mV (n = 10). Pooled data points are plotted against test voltages and are shown alongside the normalized G/Gmax curve. As seen, a non-negligible window current is predicted between −65 and −50 mV for CaV3.2 WT. Numerical values are found in Table 1.
TABLE 1.
Biophysical parameters of CaV3.2 wild-type and S6 mutant channels were estimated from recordings obtained with the cut-open oocyte technique in the presence of 10 mm Ba2+
Activation properties (E0.5,act and z) were estimated from the mean I-V relationships and fitted to a Boltzmann equation, where z is the slope factor. Activation and inactivation energies were calculated as follows: ΔGact = z · F · E0.5,act; ΔΔGact = ΔGact,mut − ΔGact,wt; ΔGinact = z · F · E0.5,inact; and ΔΔGinact = ΔGinact,mut − ΔGinact,wt. The voltage dependence of inactivation was determined from the peak currents after 2-s depolarizing pulses from a holding potential of −120 mV. The data are shown with the mean ± S.E. of the individual experiments and the number of experiments appears in parentheses.
| E0.5, act | ΔGact | ΔΔGact | Ipeak | E0.5, inact | ΔGinact | τact, −20 mV | τinact, −20 mV | τdeact, −50 mV | |
|---|---|---|---|---|---|---|---|---|---|
| kcal mol−1 | nA | kcal mol−1 | ms | ||||||
| CaV3.2 WT | −47 ± 1 (37) | −4.3 ± 0.2 | NAa | −1300 ± 200 | −65 ± 1 (10) | −8.6 ± 0.5 | 3.2 ± 0.1 (18) | 11.6 ± 0.2 | 8.4 ± 0.6 (9) |
| V1005A | −36 ± 1 (5) | −3.3 ± 0.2 | 1.0 ± 0.4 | −160 ± 40 | −58.2 ± 0.5 (5) | −7.3 ± 0.5 | 3.5 ± 0.2 (5) | 13.3 ± 0.6b | 3.9 ± 0.9b (5) |
| V1005G | −37 ± 1 (5) | −3.0 ± 0.3b | 1.3 ± 0.5 | −170 ± 40 | −61 ± 1 (4) | −8.3 ± 0.6 | 2.62 ± 0.09 (5) | 17.2 ± 0.4c | 5 ± 1 (5) |
| L1006A | −43 ± 2 (5) | −4.5 ± 0.5 | 0.2 ± 0.7 | −210 ± 70 | −67 ± 1 (5) | −7.1 ± 0.7 | 3.0 ± 0.3 (5) | 13 ± 1 | 4 ± 1b (5) |
| L1006G | −39 ± 2 (6) | −3.8 ± 0.3 | 0.5 ± 0.5 | −300 ± 100 | −63 ± 1 (6) | −7.3 ± 0.8 | 3.3 ± 0.1 (6) | 12.5 ± 0.3 | 3.0 ± 0.9c (6) |
| F1007G | −48.6 ± 0.7 (7) | −4.7 ± 0.2 | −0.4 ± 0.4 | −140 ± 40 | −65 ± 2 (7) | −6.7 ± 0.4 | 4.3 ± 0.3c (7) | 43 ± 2c | 7.5 ± 2 (8) |
| N1008A | −35 ± 2 (4) | −3.1 ± 0.3 | 1.2 ± 0.5 | −120 ± 20 | −62 ± 1 (5) | −6.6 ± 0.4 | 3.2 ± 0.6 (4) | 8.2 ± 0.6c | 3.0 ± 0.8c (5) |
| N1008G | −38.8 ± 0.9 (5) | −3.2 ± 0.2 | 1.1 ± 0.4 | −200 ± 100 | −65 ± 1 (4) | −6.8 ± 0.5 | 2.4 ± 0.4 (5) | 7.1 ± 0.9c | 2.5 ± 0.5c (5) |
| L1009A | −39 ± 2 (11) | −3.2 ± 0.4b | 1.1 ± 0.6 | −500 ± 200 | −71 ± 3 (5) | −5.9 ± 0.4 | 5.4 ± 0.6 (7) | 16 ± 3 | 3.0 ± 0.7c (6) |
| L1009G | −44 ± 2 (6) | −3.3 ± 0.3 | 1.0 ± 0.5 | −900 ± 400 | −63 ± 1 (6) | −7.9 ± 0.6 | 3.6 ± 0.2 (6) | 15.6 ± 0.4c | 7 ± 1 (6) |
| L1010A | −26 ± 1 (5) | −1.3 ± 0.1c | 3.0 ± 0.3 | −170 ± 30 | −58 ± 3 (3) | −6.9 ± 0.4 | 4.0 ± 0.3c (5) | 16.0 ± 0.8c | 3.5 ± 0.9b (4) |
| L1010G | −34.9 ± 0.9 (9) | −2.6 ± 0.2c | 1.7 ± 0.4 | −600 ± 100 | −67.5 ± 0.7 (3) | −8.0 ± 0.3 | 4.4 ± 0.6 (9) | 10.6 ± 0.6 | 6.7 ± 0.5 (4) |
| V1011A | −45 ± 2 (6) | −4.2 ± 0.4 | 0.1 ± 0.6 | −800 ± 200 | −63 ± 2 (3) | −8.4 ± 0.4 | 4.2 ± 0.6b (6) | 28.4 ± 0.7c | 17 ± 1c (5) |
| V1011G | −50 ± 1 (9) | −5.0 ± 0.3 | −0.7 ± 0.5 | −900 ± 200 | −67 ± 1 (11) | −7.8 ± 0.4 | 5.2 ± 0.5c (11) | 115 ± 16c | 8 ± 1 (4) |
| A1012G | −41 ± 3 (5) | −3.1 ± 0.4b | 1.2 ± 0.6 | −500 ± 200 | −66.0 ± 0.4 (3) | −6.2 ± 0.4 | 3.1 ± 0.1 (5) | 15.2 ± 0.6c | 11.3 ± 0.7 (5) |
| I1013A | −41 ± 1 (10) | −3.6 ± 0.2 | 0.7 ± 0.4 | −400 ± 100 | −64 ± 2 (9) | −7.7 ± 0.6 | 4.8 ± 0.5**(10) | 55 ± 1c | 20 ± 4c (3) |
| I1013G | −54 ± 1 (10) | −5.4 ± 0.3b | −1.1 ± 0.5 | −390 ± 90 | −66.8 ± 0.7 (5) | −9 ± 1 | 8.5 ± 0.4c (10) | 68 ± 4c | 30 ± 9b (5) |
| I1013L | −41 ± 2 (5) | −3.2 ± 0.4 | 1.1 ± 0.3 | −170 ± 60 | −63.3 ± 0.7 (4) | −6.4 ± 0.1 | 3.7 ± 0.3 (5) | 18.4 ± 0.3c | 10.4 ± 0.5 (5) |
| I1013V | −45.5 ± 0.8 (7) | −4.2 ± 0.3 | 0.1 ± 0.5 | −220 ± 60 | −66 ± 1 (6) | −8.0 ± 0.3 | 2.21 ± 0.07c (7) | 18.1 ± 0.5c | 8 ± 2 (7) |
| L1014A | −39 ± 1 (6) | −3.1 ± 0.3b | 1.2 ± 0.5 | −700 ± 300 | −66 ± 2 (6) | −7.8 ± 0.6 | 5.2 ± 0.4 (6) | 17.7 ± 0.4c | 11.0 ± 0.8 (6) |
| L1014G | −38 ± 1 (5) | −3.0 ± 0.2b | 1.3 ± 0.4 | −1100 ± 500 | −67.0 ± 0.9 (5) | −9.9 ± 0.5 | 5.1 ± 0.4c (5) | 20.8 ± 0.3c | 11 ± 2 (5) |
| V1015A | −42 ± 1 (5) | −2.5 ± 0.1c | 1.8 ± 0.3 | −330 ± 50 | NDd | ND | 4.0 ± 0.3 (5) | 12 ± 1 | ND |
| V1015G | −43 ± 1 (5) | −2.7 ± 0.1b | 1.4 ± 0.3 | −330 ± 30 | −75 ± 2 (4) | −7.0 ± 0.5 | 4.9 ± 0.4c (7) | 24 ± 1c | 3.6 ± 0.8c (5) |
| E1016A | −47 ± 1 (6) | −4.0 ± 0.2 | 0.3 ± 0.4 | −400 ± 100 | −67 ± 1 (6) | −8.8 ± 0.6 | 4.1 ± 0.2c (6) | 15.9 ± 0.6c | 10.7 ± 0.5 (6) |
| E1016G | −43 ± 3 (6) | −3.1 ± 0.4b | 1.2 ± 0.6 | −160 ± 30 | ND | ND | 5.9 ± 0.5c (6) | 36 ± 3c | ND |
| N1548A | −42 ± 1 (5) | −3.9 ± 0.1 | 0.4 ± 0.3 | −400 ± 300 | −80 ± 1 (4) | −6.0 ± 0.2b | 3.4 ± 0.2 (5) | 9.5 ± 0.8c | 3 ± 1 (5) |
| N1548G | −40.2 ± 0.9 (8) | −3.9 ± 0.2 | 0.4 ± 0.4 | −400 ± 100 | −66 ± 2 (8) | −8.1 ± 0.4 | 2.6 ± 0.2 (8)c | 6.8 ± 0.8c | 2.9 ± 0.5c (10) |
| M1549A | −42 ± 2 (7) | −3.1 ± 0.2b | 1.2 ± 0.4 | −400 ± 100 | −68 ± 2 (4) | −6.2 ± 0.4 | 6.3 ± 0.5c (7) | 29 ± 2c | 11 ± 3 (5) |
| N1853A | −37 ± 1 (5) | −3.2 ± 0.3b | 1.1 ± 0.5 | −400 ± 200 | ND | ND | 5.0 ± 0.3c (5) | 14.1 ± 0.3c | ND |
| N1853G | −37 ± 3 (5) | −2.2 ± 0.3c | 2.1 ± 0.5 | −500 ± 200 | ND | ND | 3.4 ± 0.2 (5) | 11.6 ± 0.5 | ND |
a NA, not applicable.
b p < 0.01 as compared with CaV3.2 WT.
c p < 0.001 as compared with CaV3.2 WT.
d ND, not determined.
Gating currents were isolated in 2 mm external Co2+ (49) and the voltage dependence of charge movement Q/Qmax was fitted with a single Boltzmann function. Q/Qmax and G/Gmax curves of CaV3.2 WT displayed comparable voltage dependence in contrast to KV2.1 (57) and HVA CaV2.3 (49) where the threshold for gating current activation was shown to be more negative than the threshold for activation of ion currents. Similar observations were reported for LVA CaV3.1 and CaV3.3 channels whether gating currents were measured with 1 mm La3+ or 30 μm Er3+ suggesting that this is an intrinsic property of LVA CaV3 channels and arguing against a role for a simple surface charge screening effect (25). These results suggest that charge movement of CaV3.2 is negligible in the pre-open state and support a model with a concerted opening of the four pore domains.
In HVA CaV2.3 channels, hydrophobic residues in distal S6 were shown to stabilize the channel closed state, whereas mutations to glycine residues promoted channel activation near the resting potential (38, 39). Given that LVA CaV3.2 channels open at negative membrane potentials, we investigated whether its closed state was also stabilized by hydrophobic residues in the distal S6 of Domain II (IIS6) (Fig. 3). We opted to perform a glycine scan of IIS6 as a way to significantly perturb the energies of gating transitions (40). Glycine is more hydrophilic than leucine, isoleucine, and valine residues (58). It thus appears to be suitable to study the role of hydrophobic interactions, whereas minimizing steric hindrance. Furthermore, the high conformational flexibility of side chain-free glycine residues appear to be compatible with the relatively loose α-helicoidal arrangement of the distal S6 region observed in high resolution of K+ channels (59). Point mutations were introduced into 10 residues from Val-1005 to Glu-1016 and their biophysical properties were measured. Current traces obtained for four mutations between L1010G and L1014G are shown in Fig. 4. As seen, the kinetics of L1010G, A1012G, and L1014G were not significantly different from CaV3.2 WT. In contrast, the activation, deactivation, and inactivation kinetics of V1011G and I1013G were significantly slower. Only I1013G activated at more negative potentials than CaV3.2 WT with a E0.5,act = −54 ± 1 mV (n = 10). Introducing a glycine residue at other positions in the distal IIS6 either right-shifted the activation and inactivation potentials or else were without significant impact (p > 0.1) (Fig. 5, A and B). Similar results were reported when residues in IIS6 were mutated to alanine (Table 1). The slower kinetics of I1013G, its left-shift of the activation potential, and its lack of significant impact on the inactivation potential are qualitatively reminiscent of the IIS6 I701G mutant in CaV2.3 (38, 39). Multiple primary sequence alignments of S6 segments and homology models suggest that Ile-1013 is structurally equivalent to Ile-701 in CaV2.3 (39) and Ile-217 in NaVAb (44), which were shown to play a role in activation gating. Although CaV3.2 I1013G activated at more negative potentials than CaV3.2 WT, the −10 mV negative shift was more modest than the ≈−35 mV shift in the voltage dependence of activation observed with CaV2.3 I701G (38, 39). In addition, glycine substitutions were the only ones to successfully left shift the activation potential because I1013A, I1013V, and I1013L either right shifted the activation curve or were without effect. Finally, none of the glycine mutations significantly affected the mid-potential of steady-state inactivation (Table 1).
FIGURE 3.
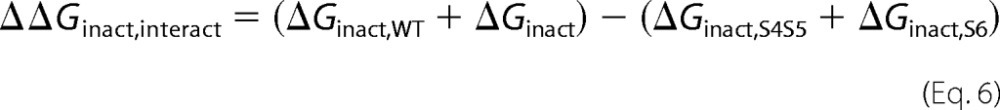
The primary sequences of IS6, IIS6, IIIS6, and IVS6 of CaV3.2 were aligned with S6 of NaVAb, NaVRh, KV1.2, and the CaV2.3 Domain II using the T-coffee algorithm. Underlined residues have been identified in previous studies as determinants of activation gating: Ile-217 in NaVAb, PVP locus in KV channels, and Ile-701 in CaV2.3. The underlined residues in CaV3.2 designate the IIS6 residues studied herein.
FIGURE 4.

A, whole cell current traces are shown from left to right for CaV3.2 L1010G, V1011G, A1012G, I1013G, and L1014G. Current traces were obtained in 10 mm Ba2+ from a holding potential of −100 mV. B, bar graphs show the mean time constants of activation (dark gray bars) and inactivation (light gray bars) as a function of the test potential from left to right for CaV3.2 L1010G, V1011G, A1012G, I1013G, and L1014G. All graphs cover the same range but insets emphasize the details for the faster mutants (L1010G, A1012G, and L1014G). Inactivation kinetics were strongly decreased in V1011G and I1013G. C, the mean time constants of deactivation (obtained from fitting current traces from monoexponential functions) from left to right for CaV3.2 L1010G, V1011G, A1012G, I1013G, and L1014G are shown alongside CaV3.2 WT (circle). The data points for CaV3.2 WT are replotted from Fig. 1E in each graph to facilitate comparison. As seen the slower inactivating kinetics of V1011G and I1013G were accompanied by slower deactivation kinetics suggesting that the channel open state was stabilized by these mutations. D, normalized conductance-voltage relationships of G/Gmax (shown from left to right for CaV3.2 L1010G, V1011G, A1012G, I1013G, and L1014G) were obtained by fitting the experimental data to a Boltzmann equation. The data obtained for the WT channel (dark circles) are shown alongside for comparison. Numerical values are found in Table 1.
FIGURE 5.

A, bar graph of the activation energies (ΔΔGact) for the glycine mutants in IIS6 of CaV3.2. ΔΔGact were obtained from the difference between the ΔGact values for the mutant channels and the ΔGact values for the WT channel such that ΔΔGact = ΔGact,mutant − ΔGact,WT. As seen, only I1013G activated at voltages more negative than the WT channel. B, bar graph of the inactivation energies (ΔΔGinact) for the glycine mutants in IIS6 of CaV3.2. ΔΔGinact were obtained from the difference between the ΔGinact values for the mutant channels and the ΔGinact values for the WT channel such that ΔΔGinact = ΔGinact,mutant − ΔGinact,WT. As seen, most of the mutations inactivated at voltages significantly more positive than the WT channel. Data are shown in kcal mol−1. Numerical values are found in Table 1.
Functional Coupling within Domain II
The crystal structures of KV and NaV channels have shown that residues in the S6 activation gate are positioned within atomic distance of the S4-S5 α-helix. Mutational studies as well as statistical coupling analysis (60) have shown that the S4-S5 linker plays a major role in the activation gating of voltage-dependent ion channels and that compatibility across the S4-S5 linker to pore interface is required to couple voltage-sensor action to pore gating (60, 61). Previous studies have shown that Ile-701 in CaV2.3 (39) and Ile-217 in NaVAb (44) are functionally coupled with a conserved leucine residue located in the S4-S5 linker of the same domain. This position is equivalent to Leu-908 in CaV3.2 (Fig. 6A). Both NaVAb and NaVRh homology models of CaV3.2, however, predict that Thr-911 in S4-S5 would be the closest residue to Ile-1013 in IIS6. CaV3.2 Leu-908 is predicted to lie further away with predicted distances ≥10 Å between their C-α atoms and/or C-β atoms. To investigate functional interaction between these residues, we performed a double-mutant cycle analysis. The double-mutant cycle analysis (62, 63) provides a way for isolating the energetics of specific pairwise interactions as shown in NaV1.7 channels (64) and in our previous study with CaV2.3 (39). The initial glycine scan of IIS4-S5 was carried out in 11 individual positions from Leu-901 to Asp-913. Of all the residues tested, only V907G strongly shifted the ΔGact toward negative voltages with ΔΔGact = −3.3 ± 0.8 kcal mol−1 (n = 11) (Fig. 6B). The Q/Qmax curve was shifted to the same extent and overlapped with the G/Gmax curve as it was also shown for the WT channel. This tight coupling between the conductance and the charge means that electromechanical coupling was not altered, and suggests that V907G stabilized the pore in its open state (65). Remarkably, introduction of glycine residues at positions 902, 903, 904, 906, 908, 909, 911, 912, and 913 did not significantly alter ΔGact (p > 0.01). T911G activated within the same voltage range as the WT channel although its activation and inactivation kinetics were significantly slower (Table 2).
FIGURE 6.

A, the primary sequences of IS4-S5, IIS4-S5, IIIS4-S5, and IVS4-S5 of CaV3.2 were aligned with S4-S5 of NaVAb, NaVRh, KV1.2, and S4-S5 in domain II of CaV2.3 using the T-coffee algorithm. Underlined residues have been identified in previous studies as modulating the channel activation gating; Leu-123 in NaVAb and Leu-596 in CaV2.3. The sequence of residues underlined in CaV3.2 designate the residues studied herein. B, bar graphs of the activation energies (ΔΔGact) for the glycine mutants in IIS4-S5 of CaV3.2; ΔΔGact = ΔGact,mut − ΔGact,WT. V907G activated at significantly more negative voltages than the WT channel with a ΔΔGact = −3.3 ± 0.8 kcal mol−1 (n = 11). The complete sets of numerical values are found in Table 2.
TABLE 2.
Biophysical parameters of CaV3.2 wild-type and S4-S5 mutant channels from Domain II (IIS4-S5) were estimated from recordings obtained with the cut-open oocyte technique in the presence of 10 mm Ba2+
Activation properties (E0.5,act and z) were estimated from the mean I-V relationships and fitted to a Boltzmann equation where z is the slope factor. Activation and inactivation energies were calculated as follows: ΔGact = z · F · E0.5,act; ΔΔGact = ΔGact,mut − ΔGact,wt; ΔGinact = z · F · E0.5,inact; and ΔΔGinact = ΔGinact,mut − ΔGinact,wt. The voltage-dependence of inactivation was determined from the peak currents after 2-s depolarizing pulses from a holding potential of −120 mV. The data are shown with the mean ± S.E. of the individual experiments and the number of experiments appears in parentheses.
| E0.5, act | ΔGact | ΔΔGact | Ipeak | E0.5, inact | ΔGinact | τact, −20 mV | τinact, −20 mV | τdeact, −50 mV | |
|---|---|---|---|---|---|---|---|---|---|
| mV | kcal mol−1 | nA | mV | kcal mol−1 | ms | ||||
| CaV3.2 WT | −47 ± 1 (37) | −4.3 ± 0.2 | NAa | −1300 ± 200 | −65 ± 1 (10) | −8.6 ± 0.5 | 3.2 ± 0.1 (18) | 11.6 ± 0.2 | 8.4 ± 0.6 (9) |
| L901G | −44 ± 1 (4) | −3.5 ± 0.2 | 0.8 ± 0.4 | −260 ± 30 | NDb | ND | 5.7 ± 0.2c (4) | 25.7 ± 0.4c | ND |
| R902G | −47.9 ± 0.5 (5) | −4.9 ± 0.5 | −0.6 ± 0.7 | −500 ± 100 | −71 ± 1 (3) | −5.8 ± 0.5 | 5.6 ± 0.4c (5) | 29 ± 3c | 16 ± 3d (5) |
| R903G | −41 ± 1 (5) | −4.0 ± 0.5 | 0.3 ± 0.7 | −180 ± 30 | −60 ± 2 (4) | −6.2 ± 0.7 | 2.8 ± 0.2 (5) | 10.6 ± 0.4 | 5.3 ± 0.7 (4) |
| Q904G | −54.6 ± 0.8 (7) | −5.3 ± 0.3 | −1.0 ± 0.6 | −230 ± 20 | −74 ± 2 (6) | −6.7 ± 0.4 | 5.5 ± 0.2c (7) | 46 ± 2c | 19 ± 1c (4) |
| L905G | −51 ± 1 (5) | −5.5 ± 0.4d | −1.2 ± 0.5 | −500 ± 100 | −70 ± 2 (4) | −7.7 ± 0.7 | 2.8 ± 0.2 (5) | 13 ± 0.7 | 5 ± 1d (5) |
| V906G | −43 ± 2 (5) | −4.2 ± 0.6 | 0.1 ± 0.6 | −120 ± 20 | −68 ± 4 (5) | −5.4 ± 0.4d | 4.0 ± 0.6 (5) | 14.1 ± 0.6c | 3.4 ± 0.6c (5) |
| V907A | −41 ± 1 (6) | −4.8 ± 0.3 | −0.5 ± 0.5 | −240 ± 70 | −74.2 ± 0.9 (5) | −7.2 ± 0.4 | 2.6 ± 0.3 (6) | 11.9 ± 0.3 | 2.8 ± 0.5c (6) |
| V907G | −54 ± 1 (11) | −7.6 ± 0.6c | −3.3 ± 0.8 | −310 ± 80 | −74.6 ± 0.9 (9) | −7.7 ± 0.1 | 3.2 ± 0.2 (11) | 11.1 ± 0.4 | 3.8 ± 0.6c (11) |
| L908A | −41 ± 1 (5) | −4.8 ± 0.4 | −0.5 ± 0.6 | −240 ± 70 | −63.0 ± 0.8 (6) | −9.1 ± 0.8 | 2.7 ± 0.4 (5) | 14.0 ± 0.9d | 7 ± 1 (7) |
| L908G | −51 ± 2 (11) | −4.9 ± 0.3 | −0.6 ± 0.5 | −800 ± 200 | −73 ± 2 (9) | −7.4 ± 0.4 | 2.6 ± 0.1 (6) | 12.5 ± 0.3 | 8 ± 2 (5) |
| V909G | −41 ± 1 (5) | −4.2 ± 0.4 | 0.1 ± 0.6 | −200 ± 50 | −62 ± 1 (4) | −7.6 ± 0.3 | 5.0 ± 0.2 (5)c | 11.9 ± 0.9 | 6 ± 1 (5) |
| K910G | −36.9 ± 0.6 (5) | −3.0 ± 0.2d | 1.3 ± 0.4 | −290 ± 80 | −68 ± 2 (6) | −6.9 ± 0.4 | 3.8 ± 0.3 (5) | 13.7 ± 0.6c | 4.0 ± 0.7d (6) |
| T911A | −45 ± 2 (6) | −3.5 ± 0.3 | 0.8 ± 0.5 | −290 ± 50 | ND | ND | 7.4 ± 0.4c (7) | 77 ± 4c | ND |
| T911G | −52 ± 1 (11) | −4.3 ± 0.2 | 0.0 ± 0.4 | −200 ± 30 | −62 ± 2 (5) | −8.5 ± 0.6 | 4.2 ± 0.3d (11) | 39 ± 5c | 10 ± 1 (5) |
| M912G | −44 ± 1 (4) | −4.7 ± 0.5 | −0.4 ± 0.7 | −400 ± 300 | −69.1 ± 0.7 (5) | −10 ± 1 | 2.7 ± 0.3 (5) | 11.8 ± 0.8 | 8 ± 2 (5) |
| D913G | −47 ± 2 (6) | −4.9 ± 0.5 | −0.6 ± 0.7 | −1700 ± 400 | −66 ± 2 (6) | −8.4 ± 0.4 | 3.2 ± 0.3 (6) | 10.0 ± 0.3d | 6.7 ± 0.4 (6) |
| N914A | −35 ± 2 (5) | −3.0 ± 0.4d | 1.3 ± 0.6 | −500 ± 100 | −63 ± 2 (4) | −8.0 ± 0.3 | 4.5 ± 0.2c (5) | 14 ± 1d | 6 ± 1 (5) |
| N914G | −38 ± 2 (8) | −3.2 ± 0.4d | 1.1 ± 0.6 | −300 ± 70 | −62.0 ± 0.6 (5) | −6.9 ± 0.5 | 3.4 ± 0.4 (8) | 13.0 ± 0.7 | 6 ± 2 (5) |
a NA, not applicable.
b ND, not determined.
c p < 0.001 as compared with CaV3.2 WT.
d p < 0.01 as compared with CaV3.2 WT.
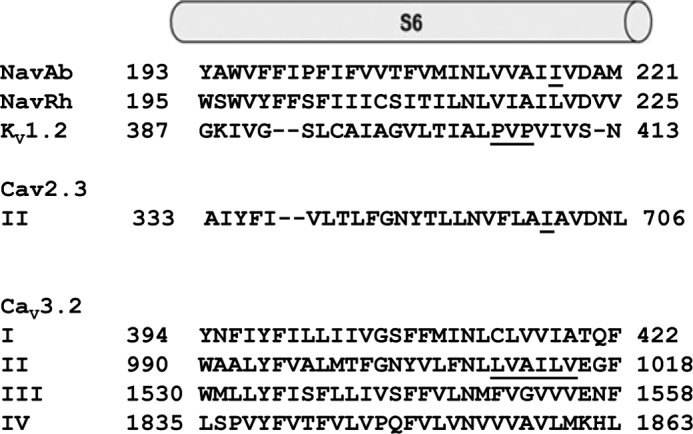
The properties of the double mutant T911G/I1013G are reported in Fig. 7. Inactivation kinetics of T911G/I1013G were slower than the WT and T911G but remained faster than I1013G (Fig. 7). More interestingly T911G/I1013G activated at slightly more depolarized voltages, whereas both single mutants activated at voltages more negative than the WT channel. Altogether, this yielded a ΔΔGact,interact = 1.8 ± 0.9 kcal mol−1 (n = 6), a value that is significantly different from 0. With a ΔΔGinteract ≥1 kcal mol−1, this result suggests that Thr-911 is functionally coupled with Ile-1013 during channel activation. There seems to be a functional coupling during inactivation although the larger experimental error associated with this measure (ΔΔGinact,interact = 2.9 ± 2.6 kcal mol−1, n = 6) precludes its statistical significance. The ΔΔGact,interact for the double mutant T911A/I1013A was −1.6 ± 1.2 kcal mol−1 (n = 6) again suggestive albeit not conclusively of a possible interaction between these two residues during channel activation. Of note, Thr-911 and Ile-1013 in CaV3.2 are, respectively, equivalent to Ser-241 in IS4-S5 and Val-400 in IS6 that were shown to be functionally coupled during activation of NaV1.7 channels (64).
FIGURE 7.
A, computer-based molecular models of Domain II of CaV3.2 are shown in a schematic representation. Modeling of Domain II was based upon the atomic coordinates of NaVAb (PDB code 3RVY) (left panel) and NaVRh (PDB code 4DXW) (right panel). Thr-911 (IIS4-S5) is shown in stick representation in blue and Ile-1013 (IIS6) is shown in red. B, whole cell current traces are shown from left to right for CaV3.2 T911G, I1013G, and the double mutant T911G/I1013G. Current traces were obtained in 10 mm Ba2+ from a holding potential of −100 mV. C, normalized conductance (G/Gmax) for CaV3.2 WT (black circles), T911G (blue squares), I1013G (red triangles), and T9117G/I1013G (black stars) are plotted against the test voltages. D, bar graphs of the mean time constants of activation for CaV3.2 WT (black), T911G (pale gray), I1013G (white), and T911G/I1013G (dark gray) as a function of the test potential. E, bar graphs of the mean time constants of inactivation for CaV3.2 WT (black), T911G (pale gray), I1013G (white), and T911G/I1013G (dark gray) as a function of the test potential. Numerical values are found in Tables 1–3.
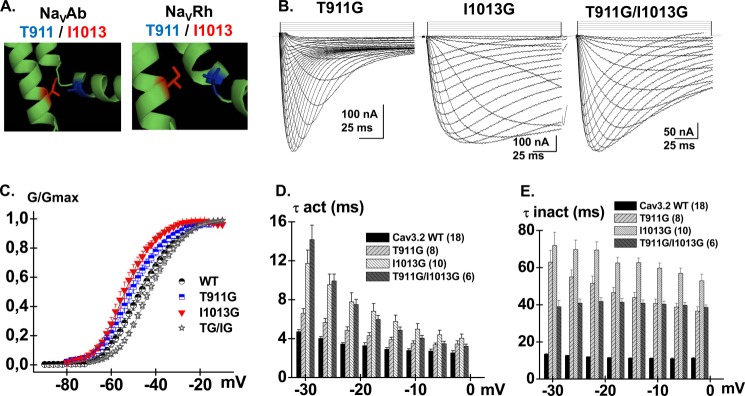
To assess for the specificity of interaction, biophysical properties were characterized for 8 double glycine mutants pairing IIS4-S5 residues (from Val-906 to Met-912) to I1013G or the neighboring L1014G residue. All these double glycine mutants were activated in a voltage-dependent manner albeit with significantly lower peak currents. Most double mutants inactivated with slower kinetics than the WT channel evoking the parent I1013G channel (Table 3). Interaction energies for activation and inactivation of the V906G/I1013G, V909G/I1013G, K910G/I1013G, and T911G/L1014G pairs were not significantly different from 0. Robust interaction energies were, however, measured between Val-907 or Leu-908 in IIS4-S5 and Ile-1013 in IIS6 during channel activation. With a value for ΔΔGact,interact = 4.6 ± 1.3 kcal mol−1 (n = 6), the interaction energy for V907G/I1013G was in fact stronger than for any other pair of mutants tested in Domain II. As seen, the activation curve (G/Gmax) of the double mutant V907G/I1013G was superimposed with those of single mutants V907G and I1013G and significantly left-shifted as compared with the WT channel (Fig. 8). The significant alteration in the electromechanical coupling is supported by the observation that the Q/Qmax and the G/Gmax curves of the double V907G/I1013G mutant are shifted in similar directions.
TABLE 3.
Biophysical parameters of CaV3.2 wild-type and double mutant channels were estimated from recordings obtained with the cut-open oocyte technique in the presence of 10 mm Ba2+
Double mutants are shown with the IIS4-S5 mutant always to the left of the pair. Most double mutants were made between IIS4-S5 and IIS6. Double mutants with Asn-1548 in IIIS6 and Asn-1853 in IVS6 are shown below and are separated by a line. Activation properties (E0.5,act and z) were estimated from the mean I-V relationships and fitted to a Boltzmann equation where z is the slope factor. Activation and inactivation energies were calculated as follows: ΔGact = z · F · E0.5,act; ΔΔGact = ΔGact,mut − ΔGact,wt; ΔGinact = z · F · E0.5,inact; and ΔΔGinact = ΔGinact,mut − ΔGinact,wt. The voltage dependence of inactivation was determined from the peak currents after 2-s depolarizing pulses from a holding potential of −120 mV. The data are shown with the mean ± S.E. of the individual experiments and the number of experiments appears in parentheses.
| V0.5, act | ΔGact | ΔΔGact | Ipeak | V0.5, inact | ΔGinact | τact, −20 mV | τinact, −20 mV | ΔΔGinter (act) | ΔΔGinteract | |
|---|---|---|---|---|---|---|---|---|---|---|
| mV | kcal mol−1 | nA | mV | kcal mol−1 | ms | kcal mol−1 | ||||
| CaV3.2 WT | −47 ± 1 (37) | −4.3 ± 0.2 | NAa | −1300 ± 200 | −65 ± 1 (10) | −8.6 ± 0.5 | 3.2 ± 0.1 (18) | 11.6 ± 0.2 | NA | NA |
| V906G/I1013G | −54 ± 2 (5) | −6.1 ± 0.7b | −1.8 ± 0.9 | −300 ± 100 | −69.1 ± 0.6 (4) | −7.9 ± 0.6 | 4.2 ± 0.3c (5) | 48 ± 2b | −0.8 ± 1.8 | −2.1 ± 2.5 |
| V907G/I1013G | −55 ± 1 (6) | −4.1 ± 0.2 | 0.2 ± 0.4 | −190 ± 40 | −78.2 ± 0.2 (3) | −7.8 ± 0.5 | 2.9 ± 0.3 (6) | 40 ± 1b | 4.6 ± 1.3 | 0.3 ± 2.1 |
| L908G/N1008G | −50 ± 3 (5) | −5.0 ± 0.7 | −0.7 ± 0.9 | −80 ± 20 | −76 ± 1 (4) | −6.9 ± 0.3 | 2.8 ± 0.3 (5) | 11 ± 1 | −1.3 ± 1.9 | −0.5 ± 1.9 |
| L908A/I1013A | −52 ± 1 (5) | −5.4 ± 0.3 | −1.1 ± 0.5 | −160 ± 40 | −67 ± 1 (5) | −5.8 ± 0.6c | 3.4 ± 0.3 (5) | 72 ± 2b | −1.3 ± 1.2 | 2.4 ± 2.5 |
| L908G/I1013G | −48 ± 1 (6) | −3.9 ± 0.3 | 0.4 ± 0.5 | −120 ± 20 | −72 ± 1 (4) | −7.2 ± 0.4 | 3.7 ± 0.5 (6) | 25.0 ± 0.8b | 2.1 ± 1.1 | 0.6 ± 2.5 |
| V909G/I1013G | −48 ± 1 (4) | −4.9 ± 0.9 | −0.6 ± 1.1 | −170 ± 40 | −65 ± 2 (3) | −6.9 ± 0.8 | 5.0 ± 0.5b (4) | 53 ± 3b | 0.4 ± 1.8 | 1.1 ± 2.6 |
| K910G/I1013G | −46.7 ± 0.6 (5) | −3.9 ± 0.2 | 0.4 ± 0.4 | −150 ± 30 | −65 ± 1 (4) | −6.2 ± 0.2 | 3.6 ± 0.2 (5) | 47 ± 4b | 0.2 ± 0.9 | 1.1 ± 2.3 |
| T911A/I1013A | −46 ± 2 (6) | −4.4 ± 0.4 | −0.1 ± 0.6 | −340 ± 80 | −60.5 ± 0.8 (6) | −6.9 ± 0.5 | 6.1 ± 0.5b (6) | 71 ± 5b | −1.6 ± 1.2 | NDd |
| T911G/I1013G | −43.4 ± 0.8 (6) | −3.6 ± 0.2 | 0.7 ± 0.4 | −260 ± 30 | −66 ± 1 (6) | −6.0 ± 0.5c | 6.7 ± 0.5b (6) | 41 ± 2b | 1.8 ± 0.9 | 2.9 ± 2.6 |
| T911G/L1014G | −47 ± 2 (6) | −3.8 ± 0.4 | 0.5 ± 0.6 | −200 ± 100 | −75 ± 1 (4) | −8 ± 1 | 8 ± 1b (6) | 26 ± 1b | −0.8 ± 1 | 1.8 ± 2.8 |
| M912G/I1013G | −48.6 ± 0.7 (6) | −4.7 ± 0.1 | −0.4 ± 0.3 | −180 ± 60 | −68 ± 1 (6) | −7.5 ± 0.4 | 5.0 ± 0.6b (6) | 42 ± 1b | 1.1 ± 1.1 | 2.3 ± 2.8 |
| N914G/E1016G | −36.5 ± 0.9 (6) | −2.8 ± 0.2b | 1.5 ± 0.4 | −90 ± 10 | −61.0 ± 0.7 (6) | −7.0 ± 0.4 | 3.9 ± 0.2c (6) | 15.0 ± 0.3b | −0.8 ± 1.2 | ND |
| V915G/L1010G | −27 ± 3 (6) | −1.6 ± 0.3b | 2.7 ± 0.5 | −110 ± 30 | −58 ± 1 (3) | −8.6 ± 0.6 | 5.1 ± 0.6b (6) | 14.9 ± 0.9b | −0.3 ± 0.6 | ND |
| V907A/N1548A | −43 ± 3 (4) | −3.4 ± 0.6 | 0.9 ± 0.8 | −50 ± 10 | −90 ± 2 (2) | −6 ± 2 | 3.1 ± 0.2 (4) | 12 ± 2 | 1 ± 1.2 | −1.4 ± 3.1 |
| V907G/N1548G | −47 ± 1 (10) | −3.8 ± 0.2 | 0.5 ± 0.4 | −110 ± 17 | −82 ± 2 (6) | −5.7 ± 0.6c | 2.6 ± 0.1 (10) | 15 ± 1b | 3.4 ± 1.2 | 1.6 ± 1.6 |
| L908A/N1548A | −39 ± 2 (6) | −3.6 ± 0.3 | 0.7 ± 0.5 | −180 ± 30 | −74.6 ± 0.9 (6) | −7.3 ± 0.2 | 4.0 ± 0.3c (6) | 9.9 ± 0.3c | 0.8 ± 1.0 | −0.8 ± 1.7 |
| L908G/N1548G | −35 ± 1 (11) | −3.3 ± 0.4c | 1.0 ± 0.6 | −220 ± 60 | −74 ± 1 (9) | −7.2 ± 0.5 | 3.5 ± 0.2 (11) | 16.5 ± 0.4b | 1.2 ± 1.1 | −0.3 ± 2.0 |
| T911A/N1548A | −36 ± 2 (7) | −2.9 ± 0.4b | 1.4 ± 0.6 | −240 ± 70 | −73 ± 2 (6) | −8.4 ± 0.5 | 4.0 ± 0.2c (7) | 10.0 ± 0.7c | 0.2 ± 1.0 | ND |
| T911G/N1548G | −37 ± 2 (7) | −2.6 ± 0.2b | 1.7 ± 0.4 | −100 ± 20 | −74 ± 2 (4) | −7.6 ± 0.4 | 3.4 ± 0.4 (7) | 13 ± 1 | 1.3 ± 0.8 | 0.4 ± 1.9 |
| L908G/N1853G | −43.4 ± 0.9 (9) | −3.8 ± 0.2 | 0.5 ± 0.4 | −180 ± 30 | −70 ± 2 (5) | −7.9 ± 0.6 | 3.5 ± 0.2 (9) | 17.2 ± 0.4b | −1 ± 1 | ND |
a NA, not applicable.
b p < 0.01 as compared with CaV3.2 WT.
c p < 0.001 as compared with CaV3.2 WT.
d ND, not determined.
FIGURE 8.
A, computer-based molecular model and Domain II of CaV3.2 are shown in a schematic representation. Modeling of Domain II was based upon the atomic coordinates of NaVAb (PDB code 3RVY) (left panel) and NaVRh (PDB code 4DXW) (right panel). Val-907 (IIS4-S5) is shown in stick representation in blue and Ile-1013 (IIS6) is shown in red. B, whole cell current traces are shown from left to right for CaV3.2 V907G, I1013G, and the double mutant V907G/I1013G. Current traces were obtained in 10 mm Ba2+ from a holding potential of −100 mV. C, normalized conductance (G/Gmax) for CaV3.2 WT (black circles), V907G (blue squares), I1013G (red triangles), and V907G/I1013G (black squares) are plotted against the test voltages. D, normalized gating charge (Q/Qmax) was plotted against voltage plot for CaV3.2 WT (black circles), V907G (blue squares), I1013G (red triangles), and V907G/I1013G (black squares). Mid-points of charge movement Q/Qmax were −44 ± 1 mV (n = 4) for WT, −57 ± 4 mV (n = 6) for V907G, −56 ± 2 mV (n = 5) for I1013G, and −57 ± 2 mV (n = 6) for V907G/I1013G. E, bar graphs of the mean time constants of inactivation for CaV3.2 WT (black), V907G (pale gray), I1013G (white), and V907G/I1013G (dark gray) as a function of the test potential. Numerical values are found in Tables 1–3.
Finally, a few other pairs of residues predicted by the three-dimensional structure of NaVAb to be in close proximity were tested using the same approach. Asn-211 in S6 of NaVAb is predicted to lie within the atomic distance of Leu-123 in S4-S5 (44). These residues are aligned with Asn-1008 (IIS6) and Leu-908 (IIS4-S5) in CaV3.2 (Figs. 3 and 6A). Double mutants L908G/N1008G, N914G/E1016G, and V915G/L1010G yielded voltage-activated currents with ΔΔGact,interact values that were not significantly different from 0 although these residues might be coupled during inactivation (Table 3).
Interdomain Coupling during Activation
Homology models of CaV3.2 also predict numerous points of contact between S4-S5 and S6 of adjacent domains (Fig. 9). In particular, Val-907 and Leu-908 in IIS4-S5, shown to be functionally coupled with Ile-1013 in IIS6, are predicted to face Asn-1548 in IIIS6 in both homology models. Leu-908 in IIS4-S5 is predicted to be closer to Asn-1548 in IIIS6 than Ile-1013 in IIS6. To note, Asn-1548 is strictly conserved in the primary sequence of IIIS6 in all HVA and LVA CaV channels (26). Despite this predicted proximity (≤8 Å between the closest atoms in the lateral chains), the ΔΔGact,interact = 1.2 ± 1.1 kcal mol−1 (n = 6) was not significantly different from 0 (Table 3).
FIGURE 9.

Computer-based molecular models of Domains II and III (top center and bottom right panels) of CaV3.2 are shown in a schematic representation. Modeling of Domains II and III was based upon the atomic coordinates of NaVAb (PDB code 3RVY) (bottom panels) and NaVRh (PDB code 4DXW) (top panels). Top left and bottom left, Leu-908 (IIS4-S5) is shown in stick representation in blue and Ile-1013 (IIS6) and Asn-1548 (IIIS6) are shown in red. Top center panels, Leu-908 and Thr-911 (IIS4-S5) are shown in stick representation in blue and Ile-1013 (IIS6) and Asn-1548 (IIIS6) are shown in red. Right top and bottom panels, Val-907, Leu-908, and Thr-911 (IIS4-S5) are shown in stick representation in blue and Ile-1013 (IIS6) and Asn-1548 (IIIS6) are shown in red.
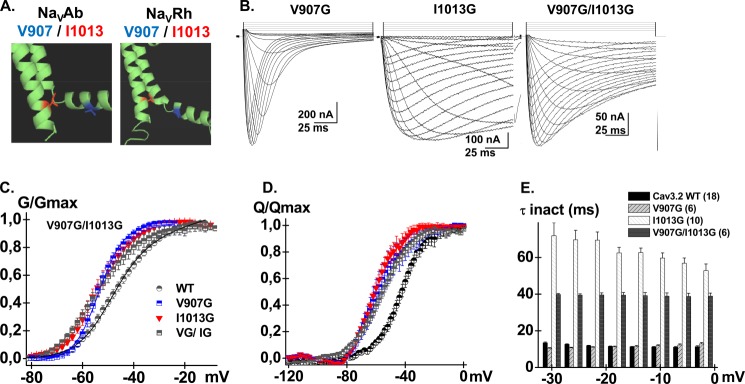
The neighboring residue Val-907 is predicted to protrude slightly further away from Asn-1548 with predicted distances ranging from 7 to 10 Å (Fig. 10). The double mutant V907G/N1548G activated in a voltage-dependent manner with ΔGact = −3.7 ± 0.3 kcal mol−1 (Table 3). Both single mutants activated at significantly more depolarized (N1548G) or significantly hyperpolarized (V907G) voltages than the WT channel yielding a large ΔΔGact,interact = 3.5 ± 1.3 kcal mol−1 (n = 6) (Tables 1–3). This interaction energy suggests significant coupling between Domains II and III during channel activation. We could not, however, estimate the change in Q/Qmax. Poor functional expression of V907G/N1548G, with peak currents in average 10 times lower than recorded for the WT channel (even when measured 7 days after injection) precluded the measure of gating currents. Qualitatively similar results were obtained for the V907A/N1548A double alanine mutant although the ΔΔGact,interact value was smaller. This reduced interaction energy might be explained by the fact that alanine residues are more hydrophobic than glycine. The V907G/N1548G channel showed slightly slower inactivation kinetics and slightly faster deactivation kinetics. The coupling energy between Val-907 and Asn-1548 was stronger than for double mutants T911G/N1548G, T911A/N1548A, L908G/N1548G, L908A/N1548A, and L908G/N1853G, the latter being in IVS6 (Fig. 11 and Table 3). Nonetheless, interaction between these residues cannot be ruled out as the values of ΔΔGact,interact we have measured remain on the verge of statistical significance.
FIGURE 10.
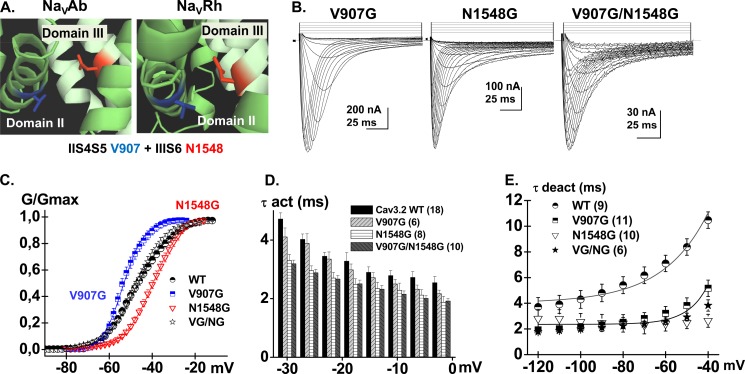
A, computer-based molecular models of Domains II and III of CaV3.2 are shown in a schematic representation. Modeling of Domains II and III was based upon the atomic coordinates of NaVAb (PDB code 3RVY) (left panel) and NaVRh (PDB code 4DXW) (right panel) and was achieved with Modeler 9v4. Val-907 (IIS4-S5) is shown in stick representation in blue and Asn-1548 (IIIS6) is shown in red. The shortest distance between Val-907 and Asn-1548 was estimated to be 6.3 Å for the model based with NaVAb and 4.3 Å for the model based with NaVRh. B, whole cell current traces are shown from left to right for CaV3.2 V907G, N1548G, and V907G/N1548G. Current traces were obtained in 10 mm Ba2+ from a holding potential of −100 mV. C, normalized conductance for CaV3.2 WT (black circles), V907G (blue squares), N1548G (red triangles), and V907G/N1548G (black stars) were obtained by fitting the experimental data to a Boltzmann equation. D, bar graphs of the mean time constants of activation for CaV3.2 WT (black), V907G (pale gray), N1548G (white), and V907G/N1548G (dark gray) as a function of the test potential. E, the mean time constants of deactivation were obtained from fitting tail currents with monoexponential functions. The deactivation time constants measured at −50 mV were 8.4 ± 0.6 ms (n = 9) for WT, 3.8 ± 0.6 ms (n = 11) for V907G, 2.5 ± 0.5 ms (n = 10) for N1548G, and 2.9 ± 0.3 ms (n = 6) for V907G/N1548G. Numerical values are found in Tables 1–3.
FIGURE 11.

Bar graph of the coupling energies (ΔΔGact,interact) for the double glycine mutants of CaV3.2, ΔΔGact,interact = (ΔGact,WT + ΔGact,double) − (ΔGact,S4-S5 + ΔGact,S6). As seen, the interaction energies were significantly stronger for V907G/I1013G and V907G/N1548G than for any other double mutant. Data are shown in kcal mol−1. Symbols * and ** identify double mutants with interaction energies significantly larger than 1.5 kcal mol−1 at p < 0.05 and p < 0.01, respectively. Numerical values are found in Table 3.
DISCUSSION
In this study we have analyzed the molecular mechanisms responsible for the voltage-dependent activation of the T-type CaV3.2 channel, and more specifically the role of the domain/domain interaction in this process. The asymmetrical nature of CaV3.2 is perfectly suited to study the nature of the inter-domain (or intersubunit in KV channels) interaction during channel activation. Furthermore, the T-type CaV3.2 channel can be functionally expressed in the absence of auxiliary subunits unlike HVA CaV1.2 (66) and CaV2.3 (39, 45), thus minimizing indirect effects caused by modulation of gating by CaVβ and CaVα2δ subunits. Biophysical properties were characterized for 47 single mutants and 20 pairs of glycine mutants. Our data identified 4 unique sets of interaction suggesting that residues in the S4-S5 linker of Domain II are functionally coupled with key residues located on the S6 segments of Domains II and III during the activation of LVA CaV3 channels. Mutations of nearby residues in IIS4-S5 displayed milder if any coupling with other residues in IIS6, IIIS6, or IVS6. This is the first report of residues in the S4-S5 linker being coupled at once with S6 residues from 2 adjacent pore regions (Domains II and III). Interdomain (intersubunit) interaction between the voltage sensor S4 and pore residues in S6 has been inferred from the formation of disulfide bonds in Shaker Kv (41) and from double mutant cycle analysis in CaV1.2 (13), respectively.
These zones of interaction were in general agreement with predictions from bacterial NaV crystal structures. Although the latter structures turned out to be superior templates for T-type CaV channels than KV1.2 (59), the presence of large gaps in the region following S5 in Domains II and III of CaV3.2 in both computer-based three-dimensional models limits our predictions regarding the relative orientation of the residues between the S4-S5 linker and the S6 pore region. This constraint does not exclude possible physical interaction between residues in S4-S5 and distal S6 but precludes a conclusive statement. Nonetheless, the strong interaction energy measured with the V907G/I1013G mutant suggests that van der Waals interactions between Val-907 in II S4-S5 and Ile-1013 in IIS6 are compromised in the presence of a pair of glycine residues. Interactions at play during activation might not be identical to the ones determining inactivation. Pairs of residues showing functional coupling during channel activation (Val-907/Ile-1013, Leu-908/Ile-1013, Val-907/Asn-1548, and Thr-911/Ile-1013) did not show significant interaction energy during channel inactivation. These observations suggest either that activation and inactivation are structurally distinct processes or that inactivation engages a larger number of contact points between the pore region and the connecting linkers.
Limitations of Our Study
The ΔGact and ΔΔGact,interact reported herein for CaV3.2 with glycine mutants were significantly lower than the one estimated between L596G in IIS4-S5 and I701G in IIS6 in CaV2.3 (39). By comparison, introducing glycine residues in the IIS4-S5 linker or in IIS6 of CaV2.3 significantly decreased the activation potential with −2 < ΔΔGact < −6 kcal mol−1 (39). It remains to be seen whether the smaller changes in ΔΔGact observed for CaV3.2 suggests that the channel structure is already optimized to open in response to depolarization.
Nonetheless, small ΔΔGact values yield smaller ΔΔGact,interact values. Because of the experimental error inherent to the measure of 4 independent experimental parameters, significant ΔΔGact,interact values are more likely to be identified from coupling two single mutants that are displaying large ΔGact. Point in case, ΔΔGact,interact was smaller for the double V907A/N1548A than for V907G/N1548G despite the fact that the mutants positions are identical in the two mutants. One might speculate that mutations with residues more hydrophilic than glycine might increase the ΔΔGact,interact values. Given the inherent limitations of the analysis, a small ΔΔGact,interact value hence does not necessarily rule out functional coupling. Double-mutant cycle analysis carried out in CaV1.2 and CaV2.1 with residues predicted to be aligned with Leu-596 and Ile-701 failed to show any significant energy coupling (39) despite the high likelihood that the coupling between S4-S5 and S6 involves universally conserved pairs of residues. Caution is thus to be exercised in interpreting ΔΔGact,interact as this parameter measures the relative coupling energy and not the absolute value of energy coupling. Despite these limitations, the thermodynamic mutant analysis remains undeniably a useful tool to qualitatively identify functional hot spots that may not be inferred from static crystal structures.
Model of Channel Activation
LVA CaV channels open in response to smaller depolarization than HVA CaV1.2 and CaV2.3 channels, yet their S4-S5 helices appear to be strongly coupled with S6 residues during channel activation. The electromechanical model of channel activation states that the channel closed state is stabilized by hydrophobic interactions in the distal S6 region and the upward movement of the voltage sensor is mechanically transduced to the channel pore S6 residues through the S4-S5 helices. The role of the S4-S5 linker in this process has yet to be elucidated. The S4-S5 linker can act as a high-energy bolt that prevents the pore S6 residues from opening. The outward movement of the voltage sensor would be sufficient to disrupt the interaction and the pore would then open passively in the absence of any physical hindrance (65). It is also possible that the S4-S5 linker and the pore S6 residues remain in close contact during activation and are being pulled away simultaneously as a single unit. In both cases, the interaction between S4-S5 and S6 has to occur in the closed state, a conclusion that is also borne out by the NaV-based molecular models. The observation that the voltage dependence of the charge movement (Q/Qmax) and the conductance (G/Gmax) were shifted similarly pleads in favor of a model where the energy deployed by the movement of the voltage sensor is directly transduced to the S6 pore residues. Finally, the strong interaction energies measured between Domains II and III suggests that activation of CaV3.2 occurs in a concerted manner across all 4 voltage sensors rather than by each S4 moving separately in a stochastic manner. It would be highly interesting to investigate whether the changes induced by the glycine mutations in IIS4-S5 or IIIS6 are caused or results from the movement of any S4 segment using voltage-clamp fluorimetry. These questions go beyond the scope of this current investigation and await further structural studies of CaV channels.
Acknowledgments
We thank Drs. Ed Perez-Reyes (University of Virginia) and Leanne Cribbs (Loyola University Chicago) for the human CaV3.2 clone in the pcDNA3 vector, Drs. Rikard Blunck and Nazzareno D'Avanzo for discussions, George Haddad for teaching us the rudiments of the cut-open oocyte technique, Julie Verner for oocyte culture, and Michel Brunette for the design of the perfusion chamber.
This work was supported in part by Grant 262048 from the Natural Sciences and Engineering Research Council of Canada (NSERC) (to L. P.).
- CaV
- voltage-dependent Ca2+ channels
- HVA
- high-voltage activated
- LVA
- low-voltage activated
- PDB
- Protein Data Bank.
REFERENCES
- 1. Snutch T. P., Reiner P. B. (1992) Ca channels. Diversity of form and function. Curr. Opin. Neurobiol. 2, 247–253 [DOI] [PubMed] [Google Scholar]
- 2. Zhang J. F., Randall A. D., Ellinor P. T., Horne W. A., Sather W. A., Tanabe T., Schwarz T. L., Tsien R. W. (1993) Distinctive pharmacology and kinetics of cloned neuronal Ca2+ channels and their possible counterparts in mammalian CNS neurons. Neuropharmacology 32, 1075–1088 [DOI] [PubMed] [Google Scholar]
- 3. Birnbaumer L., Campbell K. P., Catterall W. A., Harpold M. M., Hofmann F., Horne W. A., Mori Y., Schwartz A., Snutch T. P., Tanabe T. (1994) The naming of voltage-gated calcium channels. Neuron 13, 505–506 [DOI] [PubMed] [Google Scholar]
- 4. Perez-Reyes E., Cribbs L. L., Daud A., Lacerda A. E., Barclay J., Williamson M. P., Fox M., Rees M., Lee J. H. (1998) Molecular characterization of a neuronal low-voltage-activated T-type calcium channel. Nature 391, 896–900 [DOI] [PubMed] [Google Scholar]
- 5. Cribbs L. L., Lee J. H., Yang J., Satin J., Zhang Y., Daud A., Barclay J., Williamson M. P., Fox M., Rees M., Perez-Reyes E. (1998) Cloning and characterization of α1H from human heart, a member of the T-type Ca2+ channel gene family. Circ. Res. 83, 103–109 [DOI] [PubMed] [Google Scholar]
- 6. Randall A., Benham C. D. (1999) Recent advances in the molecular understanding of voltage-gated Ca2+ channels. Mol. Cell Neurosci. 14, 255–272 [DOI] [PubMed] [Google Scholar]
- 7. Catterall W. A. (2000) Structure and regulation of voltage-gated Ca2+ channels. Annu. Rev. Cell Dev. Biol. 16, 521–555 [DOI] [PubMed] [Google Scholar]
- 8. Peterson B. Z., DeMaria C. D., Adelman J. P., Yue D. T. (1999) Calmodulin is the Ca2+ sensor for Ca2+-dependent inactivation of L-type calcium channels. Neuron 22, 549–558 [DOI] [PubMed] [Google Scholar]
- 9. Dolphin A. C. (2009) Calcium channel diversity. Multiple roles of calcium channel subunits. Curr. Opin. Neurobiol. 19, 237–244 [DOI] [PubMed] [Google Scholar]
- 10. Dai S., Hall D. D., Hell J. W. (2009) Supramolecular assemblies and localized regulation of voltage-gated ion channels. Physiol. Rev. 89, 411–452 [DOI] [PMC free article] [PubMed] [Google Scholar]
- 11. Gao T., Puri T. S., Gerhardstein B. L., Chien A. J., Green R. D., Hosey M. M. (1997) Identification and subcellular localization of the subunits of L-type calcium channels and adenylyl cyclase in cardiac myocytes. J. Biol. Chem. 272, 19401–19407 [DOI] [PubMed] [Google Scholar]
- 12. Carl S. L., Felix K., Caswell A. H., Brandt N. R., Ball W. J., Jr., Vaghy P. L., Meissner G., Ferguson D. G. (1995) Immunolocalization of sarcolemmal dihydropyridine receptor and sarcoplasmic reticular triadin and ryanodine receptor in rabbit ventricle and atrium. J. Cell Biol. 129, 673–682 [DOI] [PMC free article] [PubMed] [Google Scholar]
- 13. Beyl S., Depil K., Hohaus A., Stary-Weinzinger A., Linder T., Timin E., Hering S. (2012) Neutralization of a single voltage sensor affects gating determinants in all four pore-forming S6 segments of CaV1.2. A cooperative gating model. Pflugers Arch. 464, 391–401 [DOI] [PMC free article] [PubMed] [Google Scholar]
- 14. Carbone E., Lux H. D. (1984) A low voltage-activated, fully inactivating Ca channel in vertebrate sensory neurones. Nature 310, 501–502 [DOI] [PubMed] [Google Scholar]
- 15. Carbone E., Giancippoli A., Marcantoni A., Guido D., Carabelli V. (2006) A new role for T-type channels in fast low-threshold exocytosis. Cell Calcium 40, 147–154 [DOI] [PubMed] [Google Scholar]
- 16. Nilius B., Talavera K., Verkhratsky A. (2006) T-type calcium channels. The never ending story. Cell Calcium 40, 81–88 [DOI] [PubMed] [Google Scholar]
- 17. Perez-Reyes E. (2003) Molecular physiology of low-voltage-activated T-type calcium channels. Physiol. Rev. 83, 117–161 [DOI] [PubMed] [Google Scholar]
- 18. Khosravani H., Zamponi G. W. (2006) Voltage-gated calcium channels and idiopathic generalized epilepsies. Physiol. Rev. 86, 941–966 [DOI] [PubMed] [Google Scholar]
- 19. Siwek M., Henseler C., Broich K., Papazoglou A., Weiergraber M. (2012) in Calcium Signaling (Islam M., ed) pp. 1219–1247, Springer, The Netherlands: [DOI] [PubMed] [Google Scholar]
- 20. Singh B., Monteil A., Bidaud I., Sugimoto Y., Suzuki T., Hamano S. I., Oguni H., Osawa M., Alonso M. E., Delgado-Escueta A. V., Inoue Y., Yasui-Furukori N., Kaneko S., Lory P., Yamakawa K. (2007) Mutational analysis of CACNA1G in idiopathic generalized epilepsy. Hum. Mutat. 28, 524–525 [DOI] [PubMed] [Google Scholar]
- 21. Nelson M. T., Todorovic S. M., Perez-Reyes E. (2006) The role of T-type calcium channels in epilepsy and pain. Curr. Pharm. Des 12, 2189–2197 [DOI] [PubMed] [Google Scholar]
- 22. Arias-Olguín I. I., Vitko I., Fortuna M., Baumgart J. P., Sokolova S., Shumilin I. A., Van Deusen A., Soriano-García M., Gomora J. C., Perez-Reyes E. (2008) Characterization of the gating brake in the I-II loop of Cav3.2 T-type Ca2+ channels. J. Biol. Chem. 283, 8136–8144 [DOI] [PMC free article] [PubMed] [Google Scholar]
- 23. Baumgart J. P., Vitko I., Bidaud I., Kondratskyi A., Lory P., Perez-Reyes E. (2008) I-II loop structural determinants in the gating and surface expression of low voltage-activated calcium channels. PLoS One 3, e2976. [DOI] [PMC free article] [PubMed] [Google Scholar]
- 24. Vitko I., Bidaud I., Arias J. M., Mezghrani A., Lory P., Perez-Reyes E. (2007) The I-II loop controls plasma membrane expression and gating of Cav3.2 T-type Ca2+ channels. A paradigm for childhood absence epilepsy mutations. J. Neurosci. 27, 322–330 [DOI] [PMC free article] [PubMed] [Google Scholar]
- 25. Karmaz̆ínová M., Baumgart J. P., Perez-Reyes E., Lacinová L. (2011) The voltage dependence of gating currents of the neuronal CaV3.3 channel is determined by the gating brake in the I-II loop. Pflugers Arch. 461, 461–468 [DOI] [PMC free article] [PubMed] [Google Scholar]
- 26. Marksteiner R., Schurr P., Berjukow S., Margreiter E., Perez-Reyes E., Hering S. (2001) Inactivation determinants in segment IIIS6 of Cav3.1. J. Physiol. 537, 27–34 [DOI] [PMC free article] [PubMed] [Google Scholar]
- 27. Talavera K., Nilius B. (2006) Evidence for common structural determinants of activation and inactivation in T-type Ca2+ channels. Pflugers Arch. 453, 189–201 [DOI] [PubMed] [Google Scholar]
- 28. Staes M., Talavera K., Klugbauer N., Prenen J., Lacinova L., Droogmans G., Hofmann F., Nilius B. (2001) The amino side of the C-terminus determines fast inactivation of the T-type calcium channel α1G. J. Physiol. 530, 35–45 [DOI] [PMC free article] [PubMed] [Google Scholar]
- 29. Karmazinova M., Beyl S., Stary-Weinzinger A., Suwattanasophon C., Klugbauer N., Hering S., Lacinova L. (2010) Cysteines in the loop between IS5 and the pore helix of Cav3.1 are essential for channel gating. Pflugers Arch. 460, 1015–1028 [DOI] [PubMed] [Google Scholar]
- 30. Kurejová M., Lacinová L., Pavlovicová M., Eschbach M., Klugbauer N. (2007) The effect of the outermost basic residues in the S4 segments of the CaV3.1 T-type calcium channel on channel gating. Pflugers Arch. 455, 527–539 [DOI] [PubMed] [Google Scholar]
- 31. Catterall W. A. (2010) Ion channel voltage sensors. Structure, function, and pathophysiology. Neuron 67, 915–928 [DOI] [PMC free article] [PubMed] [Google Scholar]
- 32. Hohaus A., Beyl S., Kudrnac M., Berjukow S., Timin E. N., Marksteiner R., Maw M. A., Hering S. (2005) Structural determinants of L-type channel activation in segment IIS6 revealed by a retinal disorder. J. Biol. Chem. 280, 38471–38477 [DOI] [PMC free article] [PubMed] [Google Scholar]
- 33. Raybaud A., Dodier Y., Bissonnette P., Simoes M., Bichet D. G., Sauvé R., Parent L. (2006) The role of the GX9GX3G motif in the gating of high voltage-activated Ca2+ channels. J. Biol. Chem. 281, 39424–39436 [DOI] [PubMed] [Google Scholar]
- 34. Kraus R. L., Sinnegger M. J., Glossmann H., Hering S., Striessnig J. (1998) Familial hemiplegic migraine mutations change α1A Ca2+ channel kinetics. J. Biol. Chem. 273, 5586–5590 [DOI] [PubMed] [Google Scholar]
- 35. Hans M., Luvisetto S., Williams M. E., Spagnolo M., Urrutia A., Tottene A., Brust P. F., Johnson E. C., Harpold M. M., Stauderman K. A., Pietrobon D. (1999) Functional consequences of mutations in the human α1A calcium channel subunit linked to familial hemiplegic migraine. J. Neurosci. 19, 1610–1619 [DOI] [PMC free article] [PubMed] [Google Scholar]
- 36. Cao Y. Q., Tsien R. W. (2005) Effects of familial hemiplegic migraine type 1 mutations on neuronal P/Q-type Ca2+ channel activity and inhibitory synaptic transmission. Proc. Natl. Acad. Sci. U.S.A. 102, 2590–2595 [DOI] [PMC free article] [PubMed] [Google Scholar]
- 37. Tottene A., Fellin T., Pagnutti S., Luvisetto S., Striessnig J., Fletcher C., Pietrobon D. (2002) Familial hemiplegic migraine mutations increase Ca2+ influx through single human CaV2.1 channels and decrease maximal CaV2.1 current density in neurons. Proc. Natl. Acad. Sci. U.S.A. 99, 13284–13289 [DOI] [PMC free article] [PubMed] [Google Scholar]
- 38. Raybaud A., Baspinar E. E., Dionne F., Dodier Y., Sauvé R., Parent L. (2007) The role of distal S6 hydrophobic residues in the voltage-dependent gating of Cav2.3 channels. J. Biol. Chem. 282, 27944–27952 [DOI] [PubMed] [Google Scholar]
- 39. Wall-Lacelle S., Hossain M. I., Sauvé R., Blunck R., Parent L. (2011) Double mutant cycle analysis identified a critical leucine residue in IIS4-S5 linker for the activation of the Cav2.3 calcium channel. J. Biol. Chem. 286, 27197–27205 [DOI] [PMC free article] [PubMed] [Google Scholar]
- 40. Ledwell J. L., Aldrich R. W. (1999) Mutations in the S4 region isolate the final voltage-dependent cooperative step in potassium channel activation. J. Gen. Physiol. 113, 389–414 [DOI] [PMC free article] [PubMed] [Google Scholar]
- 41. Lainé M., Lin M. C., Bannister J. P., Silverman W. R., Mock A. F., Roux B., Papazian D. M. (2003) Atomic proximity between S4 segment and pore domain in Shaker potassium channels. Neuron 39, 467–481 [DOI] [PubMed] [Google Scholar]
- 42. Zhang X., Ren W., DeCaen P., Yan C., Tao X., Tang L., Wang J., Hasegawa K., Kumasaka T., He J., Wang J., Clapham D. E., Yan N. (2012) Crystal structure of an orthologue of the NaChBac voltage-gated sodium channel. Nature 486, 130–134 [DOI] [PMC free article] [PubMed] [Google Scholar]
- 43. Payandeh J., Scheuer T., Zheng N., Catterall W. A. (2011) The crystal structure of a voltage-gated sodium channel. Nature 475, 353–358 [DOI] [PMC free article] [PubMed] [Google Scholar]
- 44. Payandeh J., Gamal El-Din T. M., Scheuer T., Zheng N., Catterall W. A. (2012) Crystal structure of a voltage-gated sodium channel in two potentially inactivated states. Nature 486, 135–139 [DOI] [PMC free article] [PubMed] [Google Scholar]
- 45. Shakeri B., Bourdin B., Demers-Giroux P. O., Sauvé R., Parent L. (2012) A quartet of leucine residues in the guanylate kinase domain of CaVβ determines the plasma membrane density of the CaV2.3 channel. J. Biol. Chem. 287, 32835–32847 [DOI] [PMC free article] [PubMed] [Google Scholar]
- 46. Berrou L., Dodier Y., Raybaud A., Tousignant A., Dafi O., Pelletier J. N., Parent L. (2005) The C-terminal residues in the α-interacting domain (AID) helix anchor CaV beta subunit interaction and modulation of CaV2.3 channels. J. Biol. Chem. 280, 494–505 [DOI] [PubMed] [Google Scholar]
- 47. Stefani E., Bezanilla F. (1998) Cut-open oocyte voltage-clamp technique. Methods Enzymol. 293, 300–318 [DOI] [PubMed] [Google Scholar]
- 48. Batulan Z., Haddad G. A., Blunck R. (2010) An intersubunit interaction between S4-S5 linker and S6 is responsible for the slow off-gating component in Shaker K+ channels. J. Biol. Chem. 285, 14005–14019 [DOI] [PMC free article] [PubMed] [Google Scholar]
- 49. Olcese R., Neely A., Qin N., Wei X., Birnbaumer L., Stefani E. (1996) Coupling between charge movement and pore opening in vertebrate neuronal α1E calcium channels. J. Physiol. 497, 675–686 [DOI] [PMC free article] [PubMed] [Google Scholar]
- 50. Berrou L., Bernatchez G., Parent L. (2001) Molecular determinants of inactivation within the I-II linker of α1E (CaV2.3) Ca2+ channels. Biophys. J. 80, 215–228 [DOI] [PMC free article] [PubMed] [Google Scholar]
- 51. Kusch J., Zimmer T., Holschuh J., Biskup C., Schulz E., Nache V., Benndorf K. (2010) Role of the S4-S5 linker in CNG channel activation. Biophys. J. 99, 2488–2496 [DOI] [PMC free article] [PubMed] [Google Scholar]
- 52. Labro A. J., Boulet I. R., Choveau F. S., Mayeur E., Bruyns T., Loussouarn G., Raes A. L., Snyders D. J. (2011) The S4-S5 linker of KCNQ1 channels forms a structural scaffold with the S6 segment controlling gate closure. J. Biol. Chem. 286, 717–725 [DOI] [PMC free article] [PubMed] [Google Scholar]
- 53. Amaral C., Carnevale V., Klein M. L., Treptow W. (2012) Exploring conformational states of the bacterial voltage-gated sodium channel NavAb via molecular dynamics simulations. Proc. Natl. Acad. Sci. U.S.A. 109, 21336–21341 [DOI] [PMC free article] [PubMed] [Google Scholar]
- 54. McCusker E. C., Bagnéris C., Naylor C. E., Cole A. R., D'Avanzo N., Nichols C. G., Wallace B. A. (2012) Structure of a bacterial voltage-gated sodium channel pore reveals mechanisms of opening and closing. Nat. Commun. 3, 1102. [DOI] [PMC free article] [PubMed] [Google Scholar]
- 55. Klöckner U., Lee J. H., Cribbs L. L., Daud A., Hescheler J., Pereverzev A., Perez-Reyes E., Schneider T. (1999) Comparison of the Calcium currents induced by expression of three cloned α1 subunits, α1G, α1H and α1I, of low-voltage-activated T-type Calcium channels. Eur. J. Neurosci. 11, 4171–4178 [DOI] [PubMed] [Google Scholar]
- 56. Autret L., Mechaly I., Scamps F., Valmier J., Lory P., Desmadryl G. (2005) The involvement of Cav3.2/α1H T-type calcium channels in excitability of mouse embryonic primary vestibular neurones. J. Physiol. 567, 67–78 [DOI] [PMC free article] [PubMed] [Google Scholar]
- 57. Islas L. D., Sigworth F. J. (1999) Voltage sensitivity and gating charge in Shaker and Shab family potassium channels. J. Gen. Physiol. 114, 723–742 [DOI] [PMC free article] [PubMed] [Google Scholar]
- 58. Hessa T., Kim H., Bihlmaier K., Lundin C., Boekel J., Andersson H., Nilsson I., White S. H., von Heijne G. (2005) Recognition of transmembrane helices by the endoplasmic reticulum translocon. Nature 433, 377–381 [DOI] [PubMed] [Google Scholar]
- 59. Long S. B., Campbell E. B., Mackinnon R. (2005) Crystal structure of a mammalian voltage-dependent Shaker family K channel. Science 309, 897–903 [DOI] [PubMed] [Google Scholar]
- 60. Lee S. Y., Banerjee A., MacKinnon R. (2009) Two separate interfaces between the voltage sensor and pore are required for the function of voltage-dependent K+ channels. PLoS Biol. 7, e1000047. [DOI] [PMC free article] [PubMed] [Google Scholar]
- 61. Lu Z., Klem A. M., Ramu Y. (2002) Coupling between voltage sensors and activation gate in voltage-gated K+ channels. J. Gen. Physiol. 120, 663–676 [DOI] [PMC free article] [PubMed] [Google Scholar]
- 62. Horovitz A. (1996) Double-mutant cycles. A powerful tool for analyzing protein structure and function. Fold. Des. 1, R121–R126 [DOI] [PubMed] [Google Scholar]
- 63. Ranganathan R., Lewis J. H., MacKinnon R. (1996) Spatial localization of the K+ channel selectivity filter by mutant cycle-based structure analysis. Neuron 16, 131–139 [DOI] [PubMed] [Google Scholar]
- 64. Yang Y., Dib-Hajj S. D., Zhang J., Zhang Y., Tyrrell L., Estacion M., Waxman S. G. (2012) Structural modelling and mutant cycle analysis predict pharmacoresponsiveness of a NaV1.7 mutant channel. Nat. Commun. 3, 1186. [DOI] [PMC free article] [PubMed] [Google Scholar]
- 65. Blunck R., Batulan Z. (2012) Mechanism of electromechanical coupling in voltage-gated potassium channels. Front. Pharmacol. 3, 166. [DOI] [PMC free article] [PubMed] [Google Scholar]
- 66. Bourdin B., Marger F., Wall-Lacelle S., Schneider T., Klein H., Sauvé R., Parent L. (2010) Molecular determinants of the Cavβ-induced plasma membrane targeting of the Cav1.2 channel. J. Biol. Chem. 285, 22853–22863 [DOI] [PMC free article] [PubMed] [Google Scholar]