

Background: Modular receptors like the photoreceptor YF1 detect signals and process them into biological responses.
Results: We identify numerous residues in the photosensor module of YF1 governing signal detection and processing.
Conclusion: Spatial clustering of these residues delineates structurally contiguous regions in the photosensor crucially involved in signal transduction.
Significance: The underlying mechanistic principles are widely shared in signal receptors.
Keywords: Histidine Kinases, Mutagenesis, Photoreceptors, Receptors, Signal Transduction, Per-ARNT-Sim, Covariance Analysis, Light-Oxygen-Voltage
Abstract
Modular signal receptors empower organisms to process environmental stimuli into adequate physiological responses. At the molecular level, a sensor module receives signals and processes the inherent information into changes of biological activity of an effector module. To better understand the molecular bases underpinning these processes, we analyzed signal reception and processing in the dimeric light-oxygen-voltage (LOV) blue light receptor YF1 that serves as a paradigm for the widespread Per-ARNT-Sim (PAS) signal receptors. Random mutagenesis identifies numerous YF1 variants in which biological activity is retained but where light regulation is abolished or inverted. One group of variants carries mutations within the LOV photosensor that disrupt proper coupling of the flavin-nucleotide chromophore to the protein scaffold. Another larger group bears mutations that cluster at the dyad interface and disrupt signal transmission to two coaxial coiled-coils that connect to the effector. Sequence covariation implies wide conservation of structural and mechanistic motifs, as also borne out by comparison to several PAS domains in which mutations leading to disruption of signal transduction consistently map to confined regions broadly equivalent to those identified in YF1. Not only do these data provide insight into general mechanisms of signal transduction, but also they establish concrete means for customized reprogramming of signal receptors.
Introduction
To ensure survival and eventual procreation, diverse organisms constantly perceive changes in their environment and respond appropriately. At the molecular level, these vital processes are mediated by signal receptors, which at a minimum comprise two functional modules, one denoted sensor being responsible for perceiving signals (e.g. environmental changes), and another denoted effector being responsible for triggering organismal responses (1). The modular composition of signal receptors commonly extends from the functional level to the structural level, in that sensor and effector modules are often realized as distinct protein domains. Strikingly, combinations of a rather limited set of sensor and effector domains give rise to a much larger number of signal receptors (2, 3). To a great extent, functional versatility and diversity in nature are thus accomplished by variations of recurring underlying themes, and certain structural motifs and signaling mechanisms are apparently shared across signal receptors (4). Sensor modules are specific for their signal, which can be of chemical form, e.g. the concentration of a small molecule, or of physical form, e.g. the absorption of a photon. Light sensation is afforded by photoreceptors (5), which provide spatial and temporal cues to be used for orientation in a habitat or for avoidance of harmful radiation. In particular, blue light detection is often mediated by light-oxygen-voltage photosensors (6, 7), which form a flavin-nucleotide-binding subclass of the versatile Per-ARNT-Sim family (4). Absorption of a photon in the blue spectral range triggers formation of a metastable thioether bond between the flavin isoalloxazine ring and a conserved cysteine residue in the LOV3 photosensor (8). Subsequent structural and dynamic changes propagate within the photosensor and transmit to the effector by a variety of molecular mechanisms depending on LOV domain (9–12).
An intensely studied paradigm for modular recombination of sensors and effectors and for resultant functional diversity is provided by two-component systems, which constitute the prevalent means of prokaryotes for signal transduction (3, 13, 14). In the classical two-component system scenario, a sensor histidine kinase (SHK) adjusts the phosphorylation status of a cognate response regulator in signal-dependent fashion via antagonistic kinase and phosphatase activities. The physiological response is controlled by the amount of phosphorylated response regulator, which in turn is governed by net kinase activity, i.e. the balance between the opposing kinase and phosphatase reactions (15). Known SHKs are obligate dimers and typically consist of an N-terminal sensor module and a C-terminal effector module, which comprises the dimerization/histidine phosphotransfer (DHp) and catalytic/ATP-binding (CA) domains. The understanding how sensor and effector modules are connected and how they might hence communicate has long suffered from the lack of intact high-resolution SHK structures. Only recently, structures of two SHKs that comprise both sensor and effector modules were reported. On the one hand, Wang et al. (16) elucidated the structure of the cytoplasmic portion of the Streptococcus mutans VicK SHK consisting of HAMP, PAS, DHp, and CA domains; the molecular identity of the signal that VicK responds to is unknown, but presumably the PAS domain serves as the sensor. On the other hand, we reported the full-length structure of the blue light-regulated SHK YF1 (17), which derives from a fusion of the LOV photosensor domain from Bacillus subtilis YtvA to the histidine kinase effector module from Bradyrhizobium japonicum FixL (11) (Fig. 1). Although the molecular details differ, both VicK and YF1 adopt elongated dimeric structures in which an extended helical interface, coincident with the dyad axis, is formed by coaxial coiled-coils. Crucially, the PAS/LOV sensor domains attach laterally to this central helical spine via antiparallel β sheets (strands Aβ, Bβ, Gβ, Hβ, Iβ) and are well separated in space from the downstream histidine kinase effector. Informed by the YF1 structure and a survey of PAS domain signaling (4), we attributed a preeminent role in signal transduction and modulation to the interface formed by the LOV β sheet and an N-terminal coiled-coil denoted A′α (17). Mutational analysis supported this notion in that single amino acid exchanges in this region severely affected proper light regulation of the two-component system. We proposed the rotary-switch model for signal transduction (11, 17), which envisions that signals trigger conformational rearrangements of the sensor module that propagate as torque within coiled-coil linkers to the effector module where they modulate activity.
FIGURE 1.
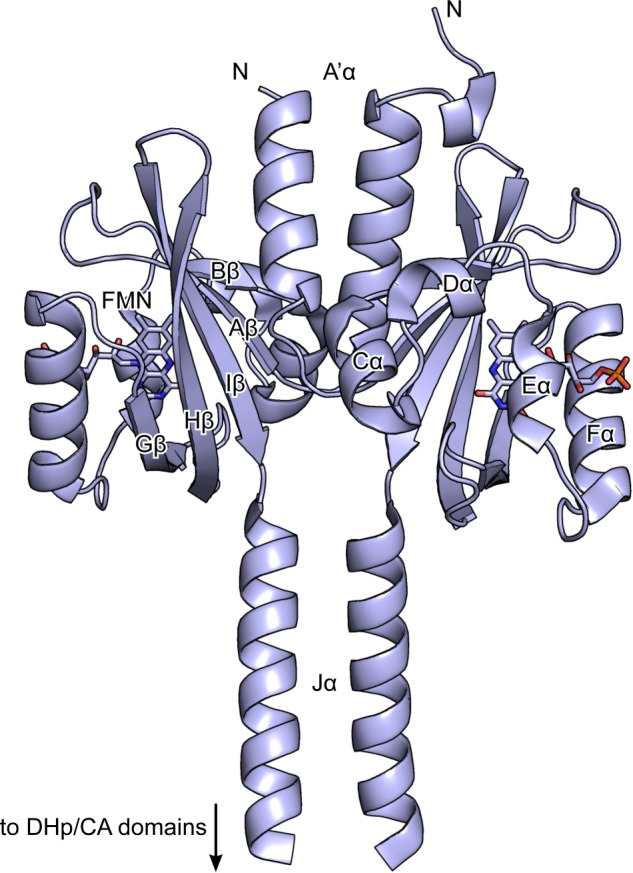
Structure of the LOV domain of YF1 (PDB entry 4GCZ (17)). Secondary structure elements are indicated, and the FMN chromophores are shown in stick representation. The C-terminal DHp and CA domains are not shown.
In the present contribution we interrogate mechanisms of signal reception and transduction in YF1, as a paradigm for SHKs and PAS receptors, in an unbiased manner complementary to our previous structure-guided, rational mutagenesis. Facilitated by the availability of efficient functional assays (18) and high-resolution structural information (17), we took a two-pronged approach to identify residues that govern signal transduction: random mutagenesis for in vivo identification and large-scale sequence covariance analysis for in silico identification. We thus find numerous mutations within the LOV domain that abolish or invert the signal response to incident blue light. These mutations spatially cluster in preferred regions, especially at the A′α/β-sheet interface, indicating crucial involvement of these regions in signal transduction. As similar clusters of mutations affecting signal transduction recur in PAS domains, a general means is provided for rapid reprogramming of the stimulus response in signal receptors.
EXPERIMENTAL PROCEDURES
Molecular Biology and Library Construction
Mutant libraries of YF1 were generated in the background of the pDusk-DsRed reporter plasmid (18) in a two-step process. First, the DNA fragment encoding residues 2–146 of YF1 was amplified by error-prone PCR using Taq polymerase (Fermentas, Schwerte, Germany). Following Cirino et al. (19), the error rate of Taq was enhanced by adding 5 mm MgCl2, 50 μm MnCl2, 0.8 mm dCTP and dTTP nucleotides to the standard PCR mixture. A total of 28 independent PCR were performed to yield mutant libraries 1–28; for somewhat reduced mutation frequency, in libraries 19–28 MnCl2 was left out. Second, these amplified and partly mutagenized DNA fragments served as so-called megaprimers in the amplification of whole plasmids according to the MEGAWHOP protocol (20, 21). PCR was conducted as described except that 250 ng of megaprimer, 2 fmol of the template pDusk-DsRed, and 2.5 units of Phusion High-Fidelity DNA polymerase (Biozym Scientific GmbH, Hessisch Oldendorf, Germany) were used in a 25-μl reaction mixture. Parental template DNA was digested by DpnI according to the QuikChange protocol (Invitrogen), and 4 μl of the resultant reaction mixture was transformed into 50 μl of chemically competent Escherichia coli DH10b cells.
Site-specific mutants of YF1 (V27E, V27T, Y41A, Y41E, Y41F, Y41L, N124I) were constructed in the background of the pDusk-myc-DsRed reporter plasmid (17) via the QuikChange protocol and confirmed by DNA sequencing (GATC Biotech, Konstanz, Germany). Expression of these mutants at near wild-type levels was confirmed by Western blot analysis (17).
Library Screening
The YF1 library was streaked out onto LB agar plates containing 50 μg ml−1 of kanamycin (denoted LB/Kan in the following), followed by incubation at 37 °C for about 20 h under dark conditions. The spatial pattern of bacterial colonies was copied to two fresh LB/Kan plates by replica plating. Both plates where incubated for 20 h at 37 °C where one plate was kept in the dark and the other plate was exposed to constant blue light (100 μW cm−2 470 nm). To monitor expression of the DsRed reporter protein (22), the replica plates (parental, dark, and light) were illuminated with blue light (100 μW cm−2 470 nm) to excite DsRed fluorescence and photographed through a 590-nm high-pass filter (B+W filters 58 mm (090); Canon EOS 1000D). Photographs from the different plates were aligned and compared in the computer. Notably, wild-type YF1 clones show high fluorescence signals under dark conditions and low signals under light conditions (cf. Fig. 2, bottom, majority of colonies). Clones that express variants of YF1 with impaired light regulation can thus be readily identified by their increased fluorescence under light conditions (cf. Fig. 2, bottom, minority of colonies). Corresponding colonies were isolated and used to inoculate 600 μl of LB/Kan medium in deep 96-well plates (Axygen Scientific, Corning, Tewksbury, MA), from which glycerol stocks for long-term storage at −80 °C were prepared. The glycerol stocks were used to inoculate 96-well stab-agar plates containing 50 μg ml−1 of kanamycin (GATC Biotech), which upon 20 h incubation at 37 °C were submitted for DNA sequencing. The resulting sequencing data were analyzed by a custom computer script written in the programming language R.
FIGURE 2.
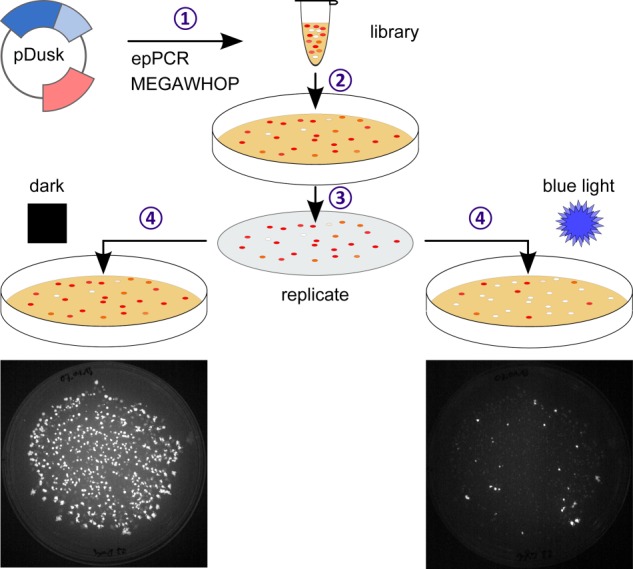
Scheme for random mutagenesis. Residues 2–146 of YF1 within the pDusk-DsRed reporter plasmid (18) were mutagenized using error-prone PCR and the MEGAWHOP strategy (20, 21) (step 1). The resultant plasmid library was transformed into E. coli and plated on agar (step 2). Replica copies were incubated under dark and blue light conditions (100 μW cm−2 470 nm) (step 3). For wild-type YF1, expression of the fluorescence reporter DsRed is repressed in the light compared with dark. Comparison of the dark and light conditions readily identifies clones that show strong fluorescence under light incubation and are hence impaired in their regulation (step 4). Photographs show typical results from one mutant library (bottom).
Activity Assays
Activity measurements for individual YF1 mutants were conducted as described (17). For YF1 variants from random mutagenesis we used a modified protocol in 96-well format; two deep-well plates containing 600 μl of LB/Kan per well were inoculated from the glycerol stocks using a Bel-Blotter tool (VWR, Darmstadt, Germany). Plates were sealed with a gas-permeable film and incubated for 18 h at 37 °C and 800 rpm. One plate was incubated in constant darkness; the other plate was incubated under constant 25 μW cm−2 470-nm light, where the film attenuated the effective light intensity impinging on the cultures to ∼15 μW cm−2. After incubation, cultures were diluted 20-fold in 10 mm Tris/HCl (pH 8.0), 10 mm NaCl. Absorbance at 600 nm (A600) and DsRed fluorescence were measured using black-walled 96-well μClear plates (Greiner BioOne, Frickenhausen, Germany) in a Tecan Infinite M200 PRO plate reader (Tecan Group Ltd., Männedorf, Switzerland). Fluorescence excitation and emission wavelengths were set at 554 ± 9 and 591 ± 20 nm, respectively. Data were normalized to the fluorescence per A600 observed for YF1 under dark conditions and represent the averages of 2 biological replicates ± S.D.
Sequence Alignment and Covariance Analysis
We identified PAS sequences homologous to the B. subtilis YtvA LOV domain, which forms part of YF1 (PHOT_BACSU) using the Pfam database (2). A total of 30,713 PAS sequences belonging to the same Pfam family (PAS_9; PF13426) were retrieved from NCBI (ncbi.nlm.nih.gov) and extended by 25 and 20 residues at their N and C termini, respectively. Sequences were aligned with HMMER 3.0 (23) using the PAS_9 profile from Pfam. For analysis with PSICOV (24), all columns for which the target sequence (PHOT_BACSU) contains a gap were deleted from the alignment. PSICOV was run with the command-line arguments “-d 0.03 -j 3 -g 0.3,” which denotes that covariance values were calculated for pairs of positions that contain fewer than 30% gaps in the alignment and are separated by at least three residues; the lasso regularization parameter ρ was iteratively adjusted to yield a target density of 3% in the final precision matrix (24). Results from the PSICOV analysis were plotted onto the three-dimensional structure of YF1 (17) using custom Python scripts. Molecule graphics in Figs. 1 and 4–6 were prepared with PyMOL (Schrödinger LLC).
FIGURE 4.

Overview of YF1 mutants with altered light regulation. A, sequence representation of mutations leading to disruption or inversion of light regulation. Gold squares denote mutations that cause constitutive activity (ON variants); dark green squares denote mutations with inverted signal polarity, i.e. mutations where activity in the presence of blue light is higher than in the dark (INV variants). Asterisks highlight mutations that cause inverted signal response only when they occur in conjunction with another mutation (superscript numbers), whereas each mutation on its own displays a different phenotype with hashmarks denoting constitutive low activity (17). White dots signify mutants not identified by random mutagenesis but known before. B, ON and INV mutations are mapped onto the structure of YF1 where the color denotes how many different amino acid exchanges at a given position induce these phenotypes (see scale bar).
FIGURE 5.

Detailed view of residues involved in light regulation. Residues for which certain mutations cause constitutive activity (ON variants) are shown in gold; residues for which at least one mutation causes inversion of the signal response are shown in dark green (INV variants); residues for which mutations induce inversion of signal response only when combined with another mutation are shown in bright green; other residues are shown in light blue; water molecules are shown as red spheres. A, the chromophore-binding pocket. B, the interface between the N-terminal A′α coiled-coil and the LOV β sheet. C, the C-terminal Jα coiled-coil. D, structural context of residues Val27 and Tyr41 (turquoise), which were identified by covariance analysis.
FIGURE 6.

Covariance analysis of the PAS_9 Pfam domain family. A, pairwise covariation PC between residues as determined with PSICOV (24) are mapped onto the sequence of YF1 (residues 1–146) and are represented in color code (see scale bar). Notably, residues in the N-terminal A′α helix show high covariation with residues Val27 and Tyr41 within the PAS β sheet; by contrast, consistently low covariation is observed between residues in the C-terminal Jα helix and in the PAS core with the exception of the N terminus of Jα around the conserved DIT motif (4). B, pairwise covariance data are mapped onto the three-dimensional structure of YF1 where the color code is the same as in panel A and the width of the lines is proportional to the value of a given covariation. Residues Val27 and Tyr41 are indicated as turquoise spheres. Only covariance data with PSICOV scores PC exceeding 0.30 are plotted.
For comparison of functional data (Fig. 7), selected PAS domains were aligned based on sequence and three-dimensional structure (where available). Constitutive OFF phenotypes can be due to a number of reasons including failure of certain mutants to correctly express. We hence only included OFF mutants in our analysis for which near wild-type expression levels have been ascertained (17, 25).
FIGURE 7.
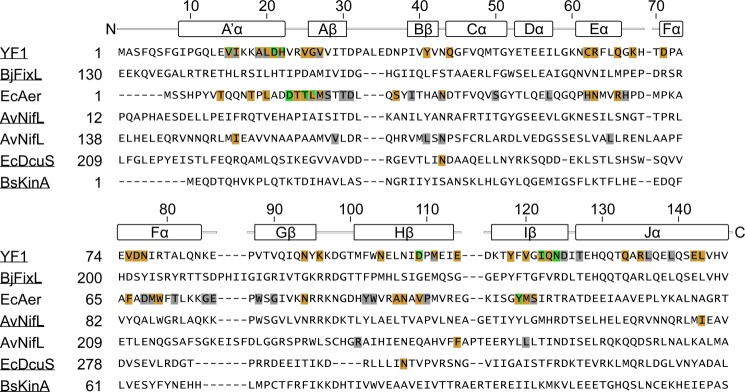
Multiple sequence alignment of selected PAS domains. Amino acid positions for which mutations causing ON phenotypes exist are indicated in gold; positions for which INV mutations exist are indicated in green; gray color denotes positions for which mutants with constitutive low output exist (OFF variants (17, 25, 44, 45)). For all listed OFF variants near wild-type expression levels have been confirmed. Secondary structure elements and sequence numbers above the alignment refer to YF1. High-resolution structures are available for the underlined proteins (YF1 (PDB entry 4GCZ (17)), B. japonicum FixL PAS B (2VV6 (52)), A. vinelandii NifL PAS A (2GJ3 (34)), E. coli DcuS PAS B (2W0N (48)), and B. subtilis KinA PAS A (2VLG (49))).
RESULTS
Random Mutagenesis of the Light-Oxygen-Voltage Photoreceptor YF1
To identify and delineate structural regions of YF1 involved in signal transduction, we implemented a random mutagenesis strategy as illustrated in Fig. 2. Random mutations were introduced into the LOV photosensor of YF1 including a C-terminal coiled-coil denoted Jα (amino acids 2–146) via error-prone PCR (19–21). Mutagenesis was performed in the background of the pDusk-DsRed reporter plasmid (18), which encodes YF1 and its cognate response regulator FixJ that drives expression of the fluorescent reporter DsRed, thus facilitating rapid screening of photoreceptor variants. Upon transformation of the resultant plasmid library into E. coli, single clones expressing individual YF1 variants were separated by plating on agar. We generated two replica copies of the clone library, one was incubated in constant darkness, and one was incubated under constant blue light (100 μW cm−2 470 nm). Under these conditions, clones harboring wild-type YF1 express the reporter DsRed to different levels depending upon light conditions, with high levels when incubated in the dark and low levels when incubated under blue light (18). DsRed expression levels can conveniently be gauged on plate by fluorescence via visual inspection through a 590-nm long-pass filter (Fig. 2). Most of the ∼300–800 clones per plate displayed wild-type behavior, indicating that they carried either no mutation or only neutral mutations. However, a number of colonies showed no or low fluorescence under both dark and light conditions; most likely, in these clones YF1 expression or catalytic activity is disrupted by mutagenesis, and we did not analyze these colonies any further. By contrast, on average 2–3% of the colonies showed a clearly divergent phenotype with bright fluorescence signals when incubated under blue light (Fig. 2); comparison to the dark-incubated replica plate revealed that in the vast majority of these clones, high fluorescence is also obtained in the absence of light, with a few exceptions (see below). Apparently, the YF1 variants expressed in these colonies retain catalytic activity as evidenced by their ability to drive expression of the DsRed reporter, but they have lost proper signal responsiveness as evidenced by their inability to shut down DsRed expression in the light. Hence, we reasoned that the mutations underpinning this phenotype involve amino acids that contribute to the processing of signals and their transmission from the sensor to the effector module.
For enhanced sampling coverage and reduction of redundancies, we generated 28 independent libraries of YF1 variants from which we selected a total of 288 (3 times 96) single colonies with increased DsRed fluorescence under light conditions. Upon DNA sequencing and accounting for duplicate mutations that occurred in several clones, we thus identified 42 single mutants (Table 1) and 102 YF1 variants that bore more than one mutation (supplemental Table S1). For all constructs, we measured DsRed expression and optical density at 600 nm (A600) following incubation under dark and blue light conditions (25 μW cm−2 470 nm) in 96-well format, which affords higher throughput than our previous setup (17, 18) (Fig. 3A and supplemental Table S1). Fluorescence data per cell density were normalized to the reading obtained for dark-adapted, wild-type YF1. Thus, the normalized fluorescence value for wild-type YF1 in the dark by definition amounts to 1.00 ± 0.06; incubation under blue light results in a decreased fluorescence signal of 0.12 ± 0.03. On average, the isolated YF1 variants show normalized fluorescence values of 0.95 ± 0.52 under dark conditions, close to the value obtained for wild-type YF1. Under blue light conditions, across the population slightly lower but overall similar fluorescence values of 0.88 ± 0.44 are observed, indicating that the random mutagenesis strategy indeed led to the identification of variants that have lost proper light regulation. To better compare and classify individual YF1 variants, we introduced the quantity αLD as the ratio between fluorescence obtained under blue light and dark conditions. Most of the isolated variants had largely lost light responsiveness with αLD values ranging from 0.29 to 2.00; we denote them as ON variants in the following. For example, the variant I122T displayed similar fluorescence values as wild-type YF1 in the dark but utterly lost light responsiveness (αLD = 1.16 ± 0.07) (Fig. 3). Intriguingly, we also identified a handful of variants that we denote INV variants in which the signal response to blue light is inverted relative to wild-type YF1 (αLD > 2.00). For example, in the INV mutant D21V the low fluorescence of 0.10 ± 0.01 observed in the dark is up-regulated to 0.92 ± 0.08 in the presence of blue light (αLD = 9.51 ± 0.81) (Fig. 3). Strikingly, most of the ON and INV variants we had previously identified by structure-guided rational mutagenesis (17) were also isolated by random mutagenesis.
TABLE 1.
Mutations identified by random mutagenesis - single mutations
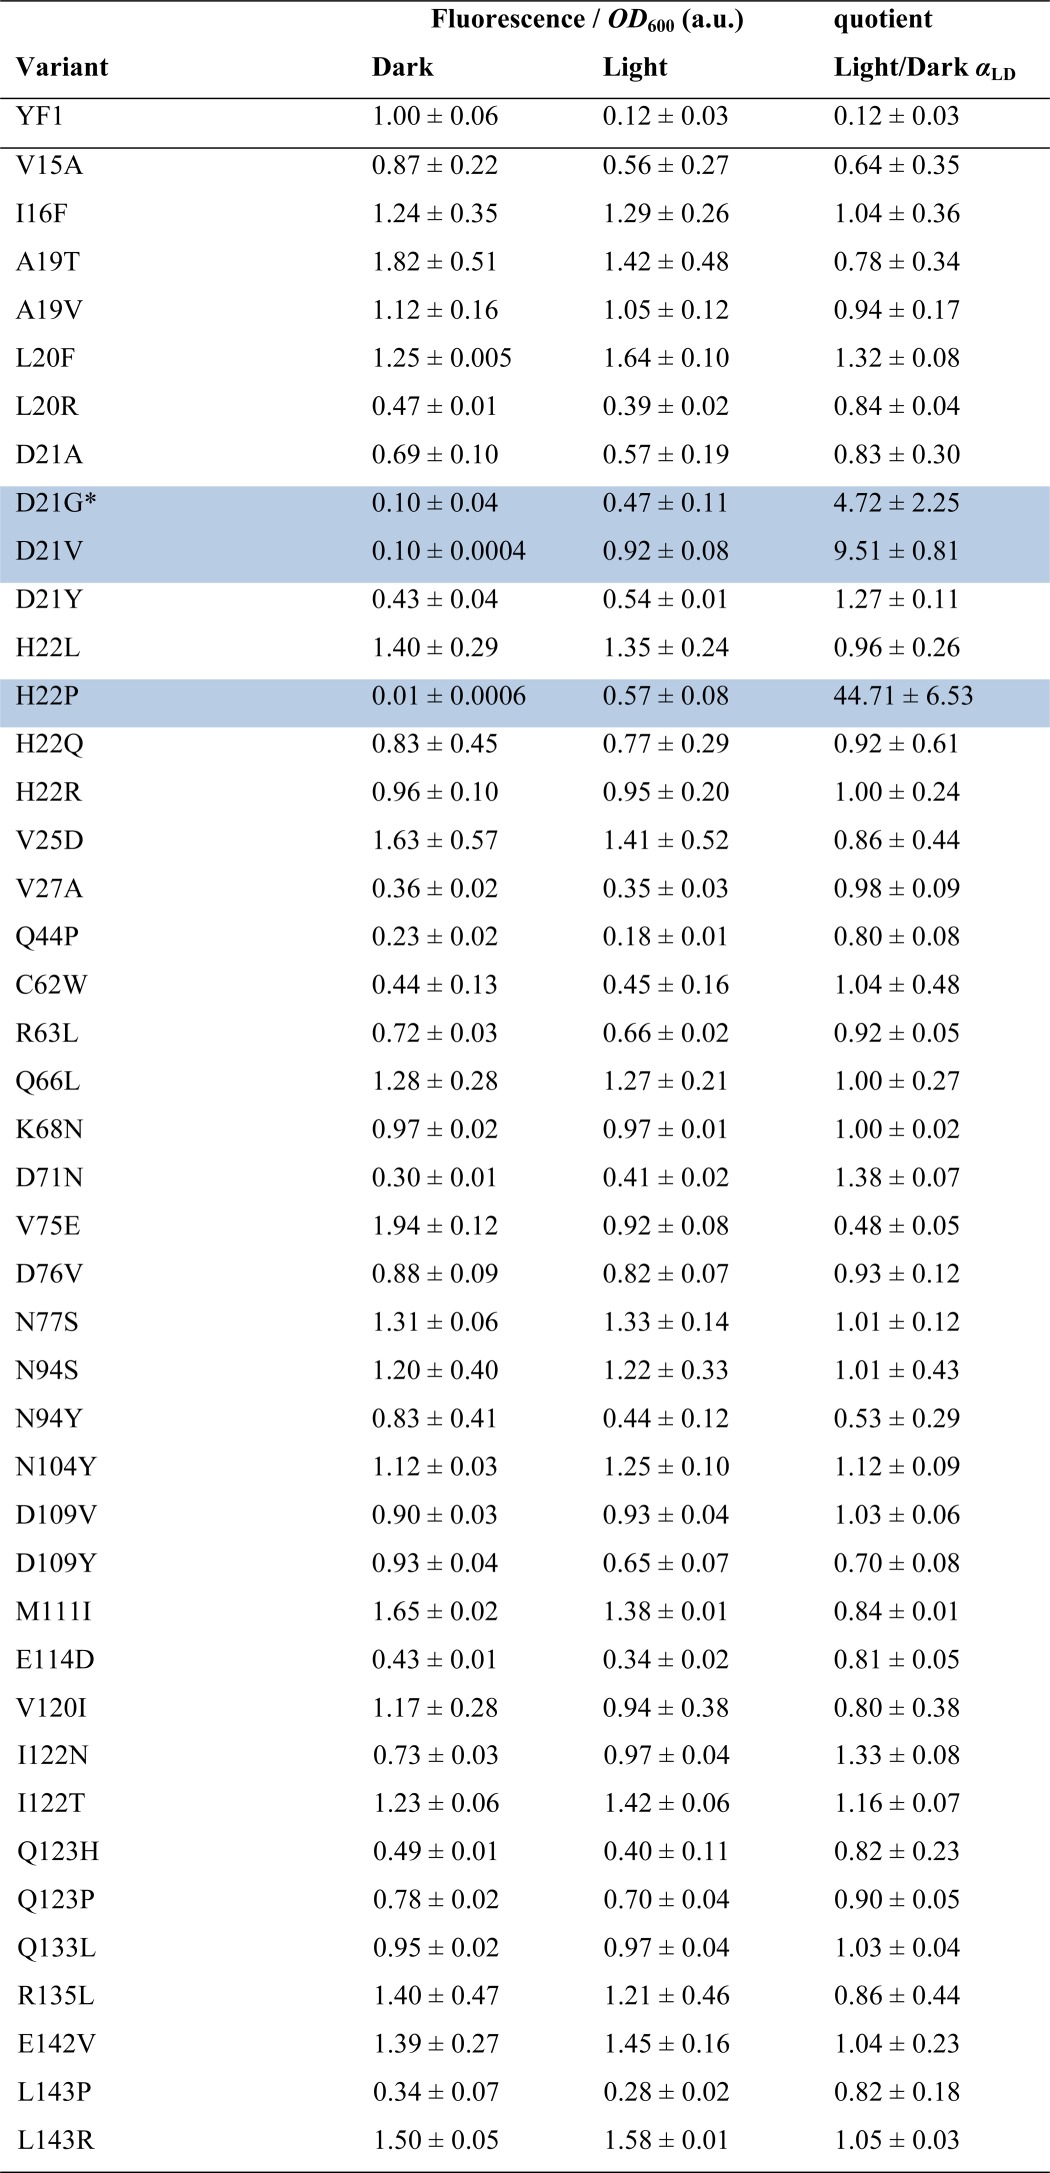
* Mutations giving rise to INV phenotypes (αLD > 2.00) are highlighted by blue shading.
FIGURE 3.
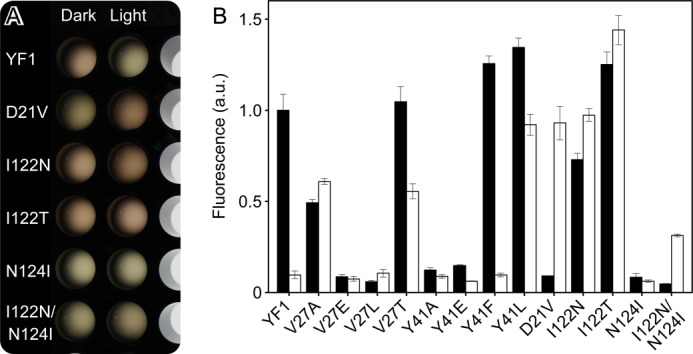
Activity measurements of YF1 variants in 96-well format with the pDusk-DsRed reporter system (18). A, cultures of YF1 variants were grown under dark and blue light conditions in 96-well plates. For measurement of reporter fluorescence and cell density, aliquots of each culture were diluted and transferred to a different multititer plate. B, activity measurements for selected YF1 variants.
Notably, the ON and INV mutations are not uniformly distributed along the sequence of the YF1 SHK but cluster in distinct regions (Fig. 4A). Particularly many such mutations were identified within the N-terminal A′α coiled-coil and the loop that connects it to the Aβ strand. In addition, an increased number of such mutations occur in helices Eα, Fα, and Jα, and in strands Gβ, Hβ, and Iβ of the LOV domain. By contrast, such mutations are largely absent from strand Bβ, helices Cα and Dα, as well as the interconnecting loops. When mapped onto the structure of YF1 (Fig. 4B), the ON and INV mutations can be grouped into three classes: (i) mutations of residues that directly interact with the flavin mononucleotide (FMN) chromophore (Fig. 5A); (ii) mutations of residues within or adjacent to the A′α coiled-coil (Fig. 5B); and (iii) mutations of residues within the C-terminal Jα coiled-coil (Fig. 5C). Given the large number of ON and INV mutations, we describe the most incisive mutants of each class in turn and refer to Table 1 and supplemental Table S1 for a complete list of all isolated variants.
The FMN cofactors are bound within the two YF1 LOV domains in a mode largely conserved across LOV domains (Fig. 5A), where the apolar half of the flavin isoalloxazine ring is embedded between aliphatic residues, and the more polar half is precisely oriented by a hydrogen-bonding network to four amide side chains (residues Gln66, Asn94, Asn104, and Gln123). Interestingly, there is a marked dichotomy in the occurrence of ON mutations among the residues directly contacting the isoalloxazine ring. Although for each of the four amide positions ON mutations could be isolated (Q66L, αLD = 1.00 ± 0.27; N94S, αLD = 1.01 ± 0.43; N94Y, αLD = 0.53 ± 0.29; N104Y, αLD = 1.12 ± 0.09; Q123H, αLD = 0.82 ± 0.23; Q123P, αLD = 0.90 ± 0.05), hardly any ON mutations of hydrophobic residues were found. Moreover, the sole exception, V75E (αLD = 0.48 ± 0.05), is contacting the polar half of the FMN ring. Mutations of several residues in helices Eα and Fα that contact the ribityl chain of the FMN cofactor also give rise to ON phenotypes (C62W, αLD = 1.02 ± 0.48; R63L, αLD = 0.92 ± 0.05; D76V, αLD = 0.93 ± 0.12). Based on in vivo activity measurements, a molecular interpretation of these mutations is difficult because the observed effect could be due to several reasons, including failure to incorporate chromophore (presumably for C62W), failure to undergo proper photochemistry (almost certainly for C62W, Q123H, and Q123P (26)), or impairment of signal transduction.
In line with our previous identification of the N-terminal A′α coiled-coil interface as crucial for signal transduction (17), the majority of the ON mutations and every single INV mutant were identified in this region. The density of ON and INV mutations is particularly high at the C terminus of A′α and the loop connecting to Aβ, whereas the N-terminal part of A′α is largely devoid of such mutations (Fig. 5B). In addition to previously known variants (V15A, D21G, H22L, H22P, V27A, D109V) (17), we isolated several new ON variants in which aliphatic residues within A′α and the LOV β sheet were exchanged, either for other hydrophobic residues (I16F, αLD = 1.04 ± 0.36; L20F, αLD = 1.32 ± 0.08; M111I, αLD = 0.84 ± 0.01; V120I, αLD = 0.80 ± 0.38) or for hydrophilic and charged residues (A19T, αLD = 0.78 ± 0.34; L20R, αLD = 0.84 ± 0.04; V25D, αLD = 0.86 ± 0.44; I122N, αLD = 1.33 ± 0.08; I122T, αLD = 1.16 ± 0.07). We found the absolute highest number of ON and INV mutations for residues Asp21 and His22 at the C-terminal end of A′α, which are involved in polar contacts to Asp109 in strand Hβ and to the amide hydrogen of Gln44 in helix Cα (D21V, αLD = 9.51 ± 0.81; D21Y, αLD = 1.27 ± 0.11; H22Q, αLD = 0.92 ± 0.61; H22R, αLD = 1.00 ± 0.24; Q44P, αLD = 0.80 ± 0.08; D109Y, αLD = 0.70 ± 0.08). Of particular note and of practical utility (18), D21V displays a strong INV phenotype with low dark and high light activity, more pronounced than the previously identified D21G and en par with H22P. Notably, replacement of Gln44 by proline amounts to removal of the amide hydrogen atom and concomitant loss of polar bonding to Asp21. Certain double mutants with ON and INV phenotypes we isolated (supplemental Table S1) showed behavior that deviates from the corresponding single mutants. For example, I122N displayed an ON phenotype, and N124I largely abolished activity; however, when both mutations are combined, an INV phenotype results (αLD = 6.64 ± 0.30) (Fig. 3). Similarly, as separate mutations, D109V and I122T induce ON phenotypes, but in combination they show INV behavior.
Several ON mutations also occur for residues within the C-terminal Jα coiled-coil (Fig. 5C). Mutation of glutamine 133 at the base of Jα to leucine results in ON activity (αLD = 1.03 ± 0.04), as do certain mutations of residues Arg135 and Glu142, which are engaged in an i,i+7 salt bridge (R135L, αLD = 0.86 ± 0.44; E142V, αLD = 1.04 ± 0.23). Last, exchange of Leu143 at the coiled-coil interface by either proline or arginine also caused ON phenotypes (L143P, αLD = 0.82 ± 0.18; L143R, αLD = 1.05 ± 0.03).
Note that data from random mutagenesis should be interpreted with some caveats; in particular, the apparent absence of a given mutation in the screen should not be taken as evidence that this mutation would have no effect on the target process but could merely reflect that this mutation was not included in the initial library. For example, our library is biased by the use of Taq polymerase, which preferentially mutates A/T base pairs to G/C base pairs (19), and by the intentionally chosen, overall low mutation density; the chance of obtaining an amino acid substitution that requires two nucleotide exchanges within one codon is correspondingly low.
Covariance Analysis of Per-ARNT-Sim Domains
To glean additional insight into the architecture and signaling mechanisms of SHKs, LOV receptors, and PAS receptors, we resorted to large-scale sequence analysis. Beyond conservation of certain residues, e.g. the highly conserved NCRFLQ motif within LOV domains, which harbors the essential cysteine (27), additional information is contained in the covariation of pairs of residue positions within a multiple sequence alignment. The basic premise is that during evolution mutations of one residue with adverse effects may be compensated by suitable mutations of a second residue that interacts with the first residue (28, 29). Such interacting residue positions are thus expected not to vary independently but to co-evolve. Observation of covariation between a pair of residue positions within multiple sequence alignment is hence taken as an indication that these residues interact, but some caveats apply (30). First, covariation is commonly interpreted in purely structural terms as evidence for close spatial proximity; however, co-evolution of residue pairs may also stem from interactions at the functional level, e.g. of two residues contributing to the same signal transduction pathway. Second, it can be challenging to untangle direct interactions between residue pairs from indirect interactions mediated by a third intermediary residue that directly interacts with the first two residues. The latter aspect is efficiently addressed by advanced covariance analysis methods (30) such as the direct-coupling analysis (31, 32) and the protein-sparse-inverse-covariance (PSICOV) (24, 33) strategy.
For the generation of a multiple sequence alignment, we retrieved a total of 30,713 protein sequences that according to the Pfam database (2) are annotated as belonging to the same family as the LOV domain of YF1. Notably, the Pfam annotation only encompasses the PAS core domain from strand Aβ through strand Iβ but lacks flanking regions A′α and Jα N- and C-terminal to the core domain. To also obtain covariance information on these regions, we extended each sequence by several residues at their N and C termini, aligned them using HMMER (23), and analyzed the resultant multiple sequence alignment with PSICOV. Each pair of residue positions in the multiple sequence alignment is assigned a PC score ranging from 0 to 1 that reflects how strongly these positions covary (Fig. 6A). Using a PC cutoff of 0.3, strong covariation is observed for 124 residue pairs separated by at least 4 residues (Δn ≥ 4) (supplemental Table S2); of those, 69 pairs are short to medium range in primary structure (4 ≤ Δn < 10), and 55 are longer range in primary structure (Δn ≥ 10). We next mapped the covariance data onto the three-dimensional structure of YF1 (Fig. 6B); note that we cannot discriminate between intramolecular covariation within one LOV monomer and intermolecular covariation across the LOV dimer interface. In our subsequent analysis we thus assigned pairwise covariation as intramolecular or intermolecular based on whether the intramolecular or intermolecular copy of the covarying residue is closer (Fig. 6B). In marked contrast to the primary structural level, at the tertiary structural level virtually all covariation occurs between pairs of residues that are separated by short or at most medium distances in space (supplemental Table S2). On average, the distance between the Cα atoms of covarying residues amounts to 7.8 ± 2.6 Å, which strikingly confirms the validity and robustness of the PSICOV approach, and which indicates that the underlying interactions in our dataset are not spurious but genuine.
Overall, the PSICOV-derived covariance data are distributed non-uniformly across the YF1 structure with covariation being the more frequent and stronger the closer to the dyad interface (Fig. 6B). Particularly strong covariation is detected in the A′α coiled-coil and the adjacent PAS β sheet where also particularly many ON and INV mutations reside (cf. Fig. 4). At the periphery, formed by helices Dα, Eα, Fα, and intervening loops, covariation is less frequent and on average weaker, in line with the more diverse sequence and structure of PAS domains in this region (4). A notable exception is provided by Cys62 in helix Eα, which displays strong covariation with several residues situated at the inner face of the PAS β sheet and within helix Fα, thus spanning the cofactor-binding cavity. Within the PAS β sheet the strongest covariation is found in its lower portion (in the orientation shown in Fig. 6B) that forms the interface to the coaxial A′α and Jα coiled-coils. Both the A′α and Jα regions N- and C-terminal to the PAS domain core display helical signatures with numerous short-range sequential covarying pairs, in agreement with previous evidence for helical confirmation at both the sequence and structural levels (4, 11, 17, 34). As our structural and functional data implicate the A′α and Jα coiled-coils in signal transduction and modulation (see above and Ref. 17), we focused on covariance between these structural elements and the PAS core domains. Strikingly, the only two residues in the PAS core that showed strong covariation with residues in the A′α helices were Val27 and Tyr41. Both residues are situated in the PAS β sheet and display intra- and intermolecular covariation with residues Val15, Ala19, Leu20, Asp21, His22, and Val23, all within the C-terminal half of A′α. The covariation detected by PSICOV is largely in line with structural contacts formed by Val27 and Tyr41 (Fig. 5D). Val27 and Tyr41 are in direct contact and protrude into a hydrophobic cavity lined by Ile16, Ala19, Val23, Val25, Ile29, and Ile122. Notably, mutations of several of these residues have profound effects on catalytic activity and regulation by light of YF1 (see above and Ref. 17). At the C-terminal junction between the PAS core and the Jα coiled-coil, strong covariation is confined to a rather small structural region. Residues Gln91, Trp103, and Glu105 within the Gβ-Hβ hairpin show covariation with residues Ile126, Thr127, His129, and Gln130 at the outer face of the Jα helix. These data correlate with intramolecular contacts seen at the structural level; residue Glu91 forms a bond to Glu105, and Trp103 is in close contact with Gln91, Ile126, and Thr127. Note that residues Ile126 and Thr127 belong to the conserved DIT motif at the interface between PAS domains and Jα coiled-coil, which is pivotal to signal transduction (4, 11, 18). By contrast, no significant covariation occurs between residues in the PAS core and in the C-terminal half of Jα.
As pointed out above, covariation between pairs of residues can be due to interactions at several levels (30), including levels of structure, dynamics, folding, and signal transduction. Furthermore, the PSICOV analysis by necessity amounts to averaging over many thousands of proteins, and interactions thus identified may not be equally important for each individual protein. We therefore interrogated the importance of Val27 and Tyr41 for activity and light regulation by mutagenesis. Previous analysis had shown that mutation of Val27 to other hydrophobic amino acids abolishes proper light regulation and results in variants with either constitutively low (V27L) or constitutively high activity (V27A) (17). We now exchanged Val27 for glutamate, which abolishes activity and for threonine, which attenuates the response to blue light illumination (Fig. 3B). Removal of the bulky side chain of Tyr41 via mutation to alanine or glutamic acid abolishes activity. By contrast, if a similarly large leucine residue is introduced at position 41, constitutively high activity is obtained. Removal of the hydroxyl group of Tyr41 via mutation to phenylalanine had essentially no effect, which concurs with the observation that in the YF1 structure this side chain does not engage in hydrogen bonding.
DISCUSSION
Signal Transduction in the Light-Oxygen-Voltage Photoreceptor YF1
The ON and INV mutations discovered by random mutagenesis preferentially occur in specific parts of the YF1 LOV photosensor, with the highest density in a small structural region comprising the C-terminal half of A′α and strands Hβ and Iβ (cf. Fig. 4). Crucially, every single INV phenotype maps to this region (V15E, D21G, D21V, H22P, V23L/N124Y, D109V/I122T, I122N/N124I). INV variants are apparently still capable of responding to light, but they misinterpret, or rather, reinterpret, how input (light signals) shall be converted into changes of output (effector activity). Put another way, these variants still undergo the initial events of light absorption but display altered transmission of signal to the effector. Evidently, the cluster of amino acids affected by INV mutations plays a key role in signal modulation and transduction. In immediate vicinity of this cluster, the strictly conserved residue Gln123 provides a direct link to the site of photoreception, i.e. the flavin chromophore. In the dark-adapted state of the LOV domain, Gln123 hydrogen bonds to atom O4 of FMN; upon light absorption and subsequent formation of a covalent bond between Cys62 and atom C4a of FMN, the side chain of Gln123 is assumed to flip by 180° to form a hydrogen bond to the newly protonated N5 atom of FMN (35). As a consequence, the structure and dynamics of the β sheet, especially within strands Hβ and Iβ, are perturbed and its affinity to the A′α coiled-coil is modulated. In the rotary-switch model we propose (11, 17), quaternary structural rearrangements of the LOV photosensors ensue that induce torque in the Jα coiled-coil, which propagates to the histidine kinase effector. In support of this model, we find that transmission of signals from photosensor to effector relies on the structural integrity of the intervening α-helical connector; mutations of Arg135 and Glu142 engaged in a salt bridge, or Leu143 (e.g. to proline) at the coiled-coil interface suspend proper signal transduction and yield ON behavior. Interestingly, mutations of Leu136 and Leu139, two and one α-helical turns down relative to Leu143 (Fig. 5C), to proline resulted in constitutively low net kinase activity (17).
Our data also include several ON mutants near the flavin-nucleotide cofactor. Not least spurred by the emerging use of LOV-based photoreceptors in optogenetics (36), a number of residue mutations in the vicinity of the flavin chromophore have been discovered that modulate LOV photocycle kinetics, in particular accelerate dark recovery after photoexcitation (37, 38). Usually, such mutations are studied photochemically at the level of the isolated photosensor domain, and hence a potential impact on effector activity is not addressed. Our data now clearly show that mutations of residues engaged in polar contacts with the flavin cofactor (e.g. R63L, Q66L, N94S, N94Y, N104Y, Q123H, and Q123P) can disrupt proper signal transduction and render the photoreceptor dysfunctional and effectively insensitive to light. Photon absorption induces formation of a thioether bond to the nearby conserved cysteine and concomitant tilting of the isoalloxazine ring by 6–7° (35, 39). Crucially, the coordinating amide side chains of the above residues track the rearrangement of the ring, which is instrumental in coupling light-induced movements of the chromophore to the β-sheet scaffold. This matters as at least some of these positions have been suggested as suitable candidates for adjusting photocycle kinetics, e.g. Asn94 and Asn104 (40), or Gln66 (41). By contrast, our screen for signaling-impaired variants did not turn up any mutations of residues in contact with the apolar part of the isoalloxazine ring, which have also been used for modulation of LOV photocycle kinetics. We thus supply two provisions for future efforts toward altering photocycle kinetics in LOV proteins. First, the effect of each mutation should not only be checked at the photochemical level but also at the functional level in a suitable photosensor-effector construct. Second, we advise to focus such efforts on aliphatic residues (37, 38) as their substitution appears to have less adverse effects on signal transduction.
In the absence of pertinent high-resolution information, it is challenging to confidently assign precise roles in signaling to individual amino acids and to recapitulate the effects of their exchanges. However, a couple of observations can be made. First, even conservative mutations within the sensor module, especially near the dyad interface, suffice to drastically affect catalytic activity and light regulation of the remote effector module. Second, quite different mutations in different locations can induce surprisingly similar net effects. Third, as exemplified by the INV variants D109V/I122T and I122N/N124I, the combination of two mutations can elicit effects quite different from those of each mutation separately. Random mutagenesis can clearly identify such variants that would be hard to find by conventional, rational mutagenesis. Fourth, directed interactions mediated by polar residues appear more important for correct signal transduction than non-directed interactions mediated by apolar residues. For instance, mutations of polar residues, e.g. Asp21 and His22 in A′α, Gln44 in Cα, or Asn94 and Asn104 near the chromophore, have more severe effects than mutations of apolar residues nearby.
Signal Transduction in Per-ARNT-Sim Receptors
Several lines of evidence argue that our present findings more widely apply to signal transduction. The PSICOV covariance data are broadly consistent with the structure of the YF1 LOV domain (cf. Fig. 6B), despite recapitulating information from more than 30,000 PAS sequences. Although reflecting the high degree of structural conservation in the PAS core domain these data also shed light on conserved structural and functional roles of the flanking regions A′α and Jα, N- and C-terminal to the PAS core. The large number of short-range sequential covariations clearly indicate that A′α and Jα generally adopt α-helical conformation, in line with structural evidence for specific PAS domains (4). Moreover, strong covariation is observed between certain residues in the PAS β sheet and the flanking helices A′α and Jα, hinting at important roles for structure and signal transduction of the underlying interactions. Notably, this region largely coincides with the region in which we found most ON and INV mutants (cf. Fig. 4B). In agreement with these observations, a survey of PAS structures revealed numerous interactions of the β sheet with N- and C-terminal flanking helices (4). However, not every single PAS domain conforms to this architecture. In marked contrast to YF1, the well studied LOV2 domain of plant phototropins possesses a C-terminal Jα helix that folds back onto the PAS β sheet (9, 42, 43). Absence of covariation between residues could merely reflect low conservation, and hence should not be taken as proof that the corresponding residues do not interact at the structural and functional levels.
As experimental validation is clearly mandatory, we scoured the literature for functional data on PAS domains and aligned their sequences to that of YF1 (Fig. 7). In the arguably best-studied system, the aerotaxis receptor Aer from E. coli, numerous mutations give rise to constitutive activity (ON variants), to loss of activity (OFF variants), or to inverted response to signal (INV variants) (25, 44, 45). Interestingly, the ON and INV mutations largely occur in regions of the Aer PAS domain equivalent to those in which most such mutations are located in YF1 (cf. Fig. 4), in particular at the A′α/β sheet interface and in helices Eα and Fα. Strikingly, all INV variants in Aer (D17G, T19K, T19P, T19R, L20T, and Y111C) map to the A′α/β sheet interface as also the case for YF1 although the precise location of the involved residues slightly differs. In another example, the PAS B domain of the Azotobacter vinelandii sensor histidine kinase NifL, several ON and OFF variants involve residues in A′α and the β sheet (46). The importance of A′α is further illustrated by a deletion series; successive removal of residues from A′α yielded variants with ON, OFF, or INV phenotype (47). In the C4-dicarboxylate sensor DcuS from E. coli two ON mutations were identified in strand Hβ and in the loop between Bβ and Cα (48). Last, for the widely studied PAS A domain of the B. subtilis sporulation kinase KinA certain mutations of residues within the β sheet affect kinase activity (49); however, as these mutations were only studied in one signal state, their effect on regulation by signal is unknown.
In summary, PAS variants with altered signal response consistently cluster at the A′α/β sheet interface, which taken together with PSICOV covariance analysis indicates widely shared mechanistic principles. Structural perturbations in conserved, narrowly circumscribed regions of the sensor or within the α-helical connector to the effector (see above and Refs. 11 and 50) can elicit profound changes in the activity and stimulus response of signal receptors. The strong impact of even single, seemingly mild mutations strikingly illustrates that comparatively small free energy perturbations suffice to utterly shift the equilibrium between states of the signal receptor of low and high activity (4, 51). Evidently, signal receptors are delicately poised so as to be maximally sensitive toward signal (36). By the same token, a new layer of control over signal transduction is afforded, e.g. for applications in synthetic biology. One can specifically home in on regions critically governing signal transduction and subject them to site-specific or random mutagenesis to rapidly achieve reprogramming of the stimulus-response function of signal receptors (17).
Acknowledgment
We thank members of the Möglich laboratory for discussion.
This work was supported by a Sofja-Kovalevskaya Award from the Alexander-von-Humboldt Foundation (to A. M.) and Deutsche Forschungsgemeinschaft Grant MO 2192/3-1 within research group FOR 1279.

This article contains supplemental Tables S1 and S2.
- LOV
- light-oxygen-voltage
- PAS
- Per-ARNT-Sim
- SHK
- sensor histidine kinase
- DHp
- dimerization/histidine phosphotransfer
- CA
- catalytic/ATP-binding
- MEGAWHOP
- amplification of whole plasmids using megaprimers
- PSICOV
- protein-sparse-inverse covariance.
REFERENCES
- 1. Pawson T., Nash P. (2003) Assembly of cell regulatory systems through protein interaction domains. Science 300, 445–452 [DOI] [PubMed] [Google Scholar]
- 2. Finn R. D., Mistry J., Schuster-Böckler B., Griffiths-Jones S., Hollich V., Lassmann T., Moxon S., Marshall M., Khanna A., Durbin R., Eddy S. R., Sonnhammer E. L., Bateman A. (2006) Pfam. Clans, web tools and services. Nucleic Acids Res. 34, D247–D251 [DOI] [PMC free article] [PubMed] [Google Scholar]
- 3. Aravind L., Iyer L. M., Anantharaman V. (2010) Natural history of sensor domains in bacterial signaling systems. In Sensory Mechanisms in Bacteria. Molecular Aspects of Signal Recognition (Spiro S., Dixon R., eds) Horizon Scientific Press, Norwich, UK [Google Scholar]
- 4. Möglich A., Ayers R. A., Moffat K. (2009) Structure and signaling mechanism of Per-ARNT-Sim domains. Structure 17, 1282–1294 [DOI] [PMC free article] [PubMed] [Google Scholar]
- 5. Möglich A., Yang X., Ayers R. A., Moffat K. (2010) Structure and function of plant photoreceptors. Annu. Rev. Plant Biol. 61, 21–47 [DOI] [PubMed] [Google Scholar]
- 6. Christie J. M., Reymond P., Powell G. K., Bernasconi P., Raibekas A. A., Liscum E., Briggs W. R. (1998) Arabidopsis NPH1. A flavoprotein with the properties of a photoreceptor for phototropism. Science 282, 1698–1701 [DOI] [PubMed] [Google Scholar]
- 7. Herrou J., Crosson S. (2011) Function, structure and mechanism of bacterial photosensory LOV proteins. Nat. Rev. Microbiol. 9, 713–723 [DOI] [PMC free article] [PubMed] [Google Scholar]
- 8. Salomon M., Eisenreich W., Dürr H., Schleicher E., Knieb E., Massey V., Rüdiger W., Müller F., Bacher A., Richter G. (2001) An optomechanical transducer in the blue light receptor phototropin from Avena sativa. Proc. Natl. Acad. Sci. U.S.A. 98, 12357–12361 [DOI] [PMC free article] [PubMed] [Google Scholar]
- 9. Harper S. M., Neil L. C., Gardner K. H. (2003) Structural basis of a phototropin light switch. Science 301, 1541–1544 [DOI] [PubMed] [Google Scholar]
- 10. Zoltowski B. D., Schwerdtfeger C., Widom J., Loros J. J., Bilwes A. M., Dunlap J. C., Crane B. R. (2007) Conformational switching in the fungal light sensor Vivid. Science 316, 1054–1057 [DOI] [PMC free article] [PubMed] [Google Scholar]
- 11. Möglich A., Ayers R. A., Moffat K. (2009) Design and signaling mechanism of light-regulated histidine kinases. J. Mol. Biol. 385, 1433–1444 [DOI] [PMC free article] [PubMed] [Google Scholar]
- 12. Nash A. I., McNulty R., Shillito M. E., Swartz T. E., Bogomolni R. A., Luecke H., Gardner K. H. (2011) Structural basis of photosensitivity in a bacterial light-oxygen-voltage/helix-turn-helix (LOV-HTH) DNA-binding protein. Proc. Natl. Acad. Sci. U.S.A. 108, 9449–9454 [DOI] [PMC free article] [PubMed] [Google Scholar]
- 13. Capra E. J., Laub M. T. (2012) Evolution of two-component signal transduction systems. Annu. Rev. Microbiol. 66, 325–347 [DOI] [PMC free article] [PubMed] [Google Scholar]
- 14. Mascher T., Helmann J. D., Unden G. (2006) Stimulus perception in bacterial signal-transducing histidine kinases. Microbiol. Mol. Biol. Rev. 70, 910–938 [DOI] [PMC free article] [PubMed] [Google Scholar]
- 15. Russo F. D., Silhavy T. J. (1993) The essential tension. Opposed reactions in bacterial two-component regulatory systems. Trends Microbiol. 1, 306–310 [DOI] [PubMed] [Google Scholar]
- 16. Wang C., Sang J., Wang J., Su M., Downey J. S., Wu Q., Wang S., Cai Y., Xu X., Wu J., Senadheera D. B., Cvitkovitch D. G., Chen L., Goodman S. D., Han A. (2013) Mechanistic insights revealed by the crystal structure of a histidine kinase with signal transducer and sensor domains. PLoS Biol. 11, e1001493. [DOI] [PMC free article] [PubMed] [Google Scholar]
- 17. Diensthuber R. P., Bommer M., Gleichmann T., Möglich A. (2013) Full-length structure of a sensor histidine kinase pinpoints coaxial coiled coils as signal transducers and modulators. Structure 21, 1127–1136 [DOI] [PubMed] [Google Scholar]
- 18. Ohlendorf R., Vidavski R. R., Eldar A., Moffat K., Möglich A. (2012) From dusk till dawn. One-plasmid systems for light-regulated gene expression. J. Mol. Biol. 416, 534–542 [DOI] [PubMed] [Google Scholar]
- 19. Cirino P. C., Mayer K. M., Umeno D. (2003) Directed evolution in library creation. Methods Mol. Biol. 231, 3–9 [DOI] [PubMed] [Google Scholar]
- 20. Miyazaki K., Takenouchi M. (2002) Creating random mutagenesis libraries using megaprimer PCR of whole plasmid. BioTechniques 33, 1033–1034, 1036–1038 [DOI] [PubMed] [Google Scholar]
- 21. Miyazaki K. (2011) MEGAWHOP cloning. A method of creating random mutagenesis libraries via megaprimer PCR of whole plasmids. Methods Enzymol. 498, 399–406 [DOI] [PubMed] [Google Scholar]
- 22. Strack R. L., Strongin D. E., Bhattacharyya D., Tao W., Berman A., Broxmeyer H. E., Keenan R. J., Glick B. S. (2008) A noncytotoxic DsRed variant for whole-cell labeling. Nat. Methods 5, 955–957 [DOI] [PMC free article] [PubMed] [Google Scholar]
- 23. Eddy S. R. (1998) Profile hidden Markov models. Bioinformatics 14, 755–763 [DOI] [PubMed] [Google Scholar]
- 24. Jones D. T., Buchan D. W., Cozzetto D., Pontil M. (2012) PSICOV. Precise structural contact prediction using sparse inverse covariance estimation on large multiple sequence alignments. Bioinformatics 28, 184–190 [DOI] [PubMed] [Google Scholar]
- 25. Campbell A. J., Watts K. J., Johnson M. S., Taylor B. L. (2010) Gain-of-function mutations cluster in distinct regions associated with the signalling pathway in the PAS domain of the aerotaxis receptor, Aer. Mol. Microbiol. 77, 575–586 [DOI] [PMC free article] [PubMed] [Google Scholar]
- 26. Nash A. I., Ko W.-H., Harper S. M., Gardner K. H. (2008) A conserved glutamine plays a central role in LOV domain signal transmission and its duration. Biochemistry 47, 13842–13849 [DOI] [PMC free article] [PubMed] [Google Scholar]
- 27. Crosson S., Rajagopal S., Moffat K. (2003) The LOV domain family. Photoresponsive signaling modules coupled to diverse output domains. Biochemistry 42, 2–10 [DOI] [PubMed] [Google Scholar]
- 28. Neher E. (1994) How frequent are correlated changes in families of protein sequences? Proc. Natl. Acad. Sci. U.S.A. 91, 98–102 [DOI] [PMC free article] [PubMed] [Google Scholar]
- 29. Göbel U., Sander C., Schneider R., Valencia A. (1994) Correlated mutations and residue contacts in proteins. Proteins 18, 309–317 [DOI] [PubMed] [Google Scholar]
- 30. de Juan D., Pazos F., Valencia A. (2013) Emerging methods in protein co-evolution. Nat. Rev. Genet. 14, 249–261 [DOI] [PubMed] [Google Scholar]
- 31. Dago A. E., Schug A., Procaccini A., Hoch J. A., Weigt M., Szurmant H. (2012) Structural basis of histidine kinase autophosphorylation deduced by integrating genomics, molecular dynamics, and mutagenesis. Proc. Natl. Acad. Sci. U.S.A. 109, E1733–1742 [DOI] [PMC free article] [PubMed] [Google Scholar]
- 32. Szurmant H., Hoch J. A. (2013) Statistical analyses of protein sequence alignments identify structures and mechanisms in signal activation of sensor histidine kinases. Mol. Microbiol. 87, 707–712 [DOI] [PMC free article] [PubMed] [Google Scholar]
- 33. Nugent T., Jones D. T. (2012) Accurate de novo structure prediction of large transmembrane protein domains using fragment-assembly and correlated mutation analysis. Proc. Natl. Acad. Sci. U.S.A. 109, E1540–E1547 [DOI] [PMC free article] [PubMed] [Google Scholar]
- 34. Key J., Hefti M., Purcell E. B., Moffat K. (2007) Structure of the redox sensor domain of Azotobacter vinelandii NifL at atomic resolution. Signaling, dimerization, and mechanism. Biochemistry 46, 3614–3623 [DOI] [PubMed] [Google Scholar]
- 35. Crosson S., Moffat K. (2002) Photoexcited structure of a plant photoreceptor domain reveals a light-driven molecular switch. Plant Cell 14, 1067–1075 [DOI] [PMC free article] [PubMed] [Google Scholar]
- 36. Möglich A., Moffat K. (2010) Engineered photoreceptors as novel optogenetic tools. Photochem. Photobiol. Sci. 9, 1286–1300 [DOI] [PubMed] [Google Scholar]
- 37. Christie J. M., Corchnoy S. B., Swartz T. E., Hokenson M., Han I. S., Briggs W. R., Bogomolni R. A. (2007) Steric interactions stabilize the signaling state of the LOV2 domain of phototropin 1. Biochemistry 46, 9310–9319 [DOI] [PubMed] [Google Scholar]
- 38. Zoltowski B. D., Vaccaro B., Crane B. R. (2009) Mechanism-based tuning of a LOV domain photoreceptor. Nat. Chem. Biol. 5, 827–834 [DOI] [PMC free article] [PubMed] [Google Scholar]
- 39. Möglich A., Moffat K. (2007) Structural basis for light-dependent signaling in the dimeric LOV domain of the photosensor YtvA. J. Mol. Biol. 373, 112–126 [DOI] [PMC free article] [PubMed] [Google Scholar]
- 40. Raffelberg S., Mansurova M., Gärtner W., Losi A. (2011) Modulation of the photocycle of a LOV domain photoreceptor by the hydrogen-bonding network. J. Am. Chem. Soc. 133, 5346–5356 [DOI] [PubMed] [Google Scholar]
- 41. Zoltowski B. D., Nash A. I., Gardner K. H. (2011) Variations in protein-flavin hydrogen bonding in a light, oxygen, voltage domain produce non-Arrhenius kinetics of adduct decay. Biochemistry 50, 8771–8779 [DOI] [PMC free article] [PubMed] [Google Scholar]
- 42. Harper S. M., Christie J. M., Gardner K. H. (2004) Disruption of the LOV-Jα helix interaction activates phototropin kinase activity. Biochemistry 43, 16184–16192 [DOI] [PubMed] [Google Scholar]
- 43. Halavaty A. S., Moffat K. (2007) N- and C-terminal flanking regions modulate light-induced signal transduction in the LOV2 domain of the blue light sensor phototropin 1 from Avena sativa. Biochemistry 46, 14001–14009 [DOI] [PubMed] [Google Scholar]
- 44. Repik A., Rebbapragada A., Johnson M. S., Haznedar J. O., Zhulin I. B., Taylor B. L. (2000) PAS domain residues involved in signal transduction by the Aer redox sensor of Escherichia coli. Mol. Microbiol. 36, 806–816 [DOI] [PMC free article] [PubMed] [Google Scholar]
- 45. Watts K. J., Sommer K., Fry S. L., Johnson M. S., Taylor B. L. (2006) Function of the N-terminal cap of the PAS domain in signaling by the aerotaxis receptor Aer. J. Bacteriol. 188, 2154–2162 [DOI] [PMC free article] [PubMed] [Google Scholar]
- 46. Slavny P., Little R., Salinas P., Clarke T. A., Dixon R. (2010) Quaternary structure changes in a second Per-Arnt-Sim domain mediate intramolecular redox signal relay in the NifL regulatory protein. Mol. Microbiol. 75, 61–75 [DOI] [PubMed] [Google Scholar]
- 47. Little R., Slavny P., Dixon R. (2012) Influence of PAS domain flanking regions on oligomerisation and redox signalling by NifL. PLoS One 7, e46651. [DOI] [PMC free article] [PubMed] [Google Scholar]
- 48. Etzkorn M., Kneuper H., Dünnwald P., Vijayan V., Krämer J., Griesinger C., Becker S., Unden G., Baldus M. (2008) Plasticity of the PAS domain and a potential role for signal transduction in the histidine kinase DcuS. Nat. Struct. Mol. Biol. 15, 1031–1039 [DOI] [PubMed] [Google Scholar]
- 49. Lee J., Tomchick D. R., Brautigam C. A., Machius M., Kort R., Hellingwerf K. J., Gardner K. H. (2008) Changes at the KinA PAS-A dimerization interface influence histidine kinase function. Biochemistry 47, 4051–4064 [DOI] [PubMed] [Google Scholar]
- 50. Winkler K., Schultz A., Schultz J. E. (2012) The S-helix determines the signal in a Tsr receptor/adenylyl cyclase reporter. J. Biol. Chem. 287, 15479–15488 [DOI] [PMC free article] [PubMed] [Google Scholar]
- 51. Monod J., Wyman J., Changeux J. P. (1965) On the nature of allosteric transitions. A plausible model. J. Mol. Biol. 12, 88–118 [DOI] [PubMed] [Google Scholar]
- 52. Ayers R. A., Moffat K. (2008) Changes in quaternary structure in the signaling mechanisms of PAS domains. Biochemistry 47, 12078–12086 [DOI] [PMC free article] [PubMed] [Google Scholar]