

Background: Little is known about the structural characteristics of the multimodal TRPV1 ion channel.
Results: FRET measurements show the C terminus surrounded by the N terminus arranged with 4-fold symmetry. The N terminus is further away from the plasma membrane than the C terminus.
Conclusion: Domain organization is consistent with a compact structure of the channel.
Significance: This work presents novel insights regarding the structure of TRPV1.
Keywords: Imaging, Pain, Patch Clamp, Plasma Membrane, Spectroscopy, TRP Channels
Abstract
The transient receptor potential vanilloid 1 ion channel is responsible for the perception of high temperatures and low extracellular pH, and it is also involved in the response to some pungent compounds. Importantly, it is also associated with the perception of pain and noxious stimuli. Here, we attempt to discern the molecular organization and location of the N and C termini of the transient receptor potential vanilloid 1 ion channel by measuring FRET between genetically attached enhanced yellow and cyan fluorescent protein to the N or C terminus of the channel protein, expressed in transfected HEK 293 cells or Xenopus laevis oocytes. The static measurements of the domain organization were mapped into an available cryo-electron microscopy density of the channel with good agreement. These measurements also provide novel insights into the organization of terminal domains and their proximity to the plasma membrane.
Introduction
The transient receptor potential vanilloid 1 (TRPV1)3 ion channel is a sensory transducing ion channel that has been found in multiple species, including human, rat, guinea pig, rabbit, mouse, zebrafish, and pig (1). It is involved in the detection of chemical and thermal stimuli. TRPV1 is a nonselective cation channel with a preference for calcium and is activated by capasicin (2), anandamine (3), noxious heat, low pH (<5) (4), voltage (5), and some pungent compounds such as those found in onion and garlic like allicin (6). It is also regulated and activated by some lipids such as phosphatidylinositol 4,5-bisphosphate and lysophosphatidic acid, which have been described as modulator and allosteric activator of the channel, respectively (7, 8).
Not much is known about the structural characteristics of TRPV1. Biochemical (9, 10) and biophysical (11, 12) evidence suggest that the functional channel in the membrane is organized as an homotetramer. By homology with voltage-dependent potassium channels, each subunit of the channel is thought to consist of six transmembrane domains with a short amphipathic region between the fifth and sixth domains and intracellular N and C termini.
The evidence indicates that the pore of the channel is formed by the amphipathic region together with the S5 and S6 segments. It has been shown that the activation gate is located at the S6 segment. This region is similar to that of voltage-dependent potassium channels; it adopts an amphipathic α-helical structure forming an aqueous cavity with two constrictions: one that hinders large ion permeation and one for small ion permeation (13, 14).
The N terminus contains a distal section of 100 amino acids followed by six ankyrin repeats and a linker region between these and the first transmembrane domain (15), which has been implicated in temperature sensing (16). A region of the C terminus that is adjacent to the S6 segment is involved in the oligomerization of the channel (17, 18), the C terminus also contains the highly conserved TRP box that has been shown to be important in channel gating (17, 19). Moreover, the C terminus has also been established as an important region for temperature gating (20, 21).
Each of the activators of TRPV1 acts on different channel regions and, as has been shown for several signals (14), they converge in a final event that is the opening of the activation gate, implying an allosteric conformational change that transmits the signal from the site of action of the agonist to the activation gate. For example, in the case of allicin, whose site of action is expected to be relatively far away from the activation gate, in the second ankyrin repeat at the N-terminal (6), it is proposed that the ankyrin domains suffer a conformational change that leads to the opening of the channel. These conformational changes have been reported for other channels, such as cyclic nucleotide-gated channels, where a portion of the gating ring moves parallel to the plasma membrane during activation (22, 23).
Apart from the structure of the ankyrin repeats (24), no structural information at the atomic level is available for the entire TRPV1 channel; however, some insights have been obtained by using different techniques, such as cryo-electron microscopy (cryoEM) (11) and extensive mutagenesis and functional assays (13, 14, 25). The elucidation of how the channel is assembled from a structural point of view will allow the development of new strategies for the study of this class of ion channels.
Here, we have tried to obtain some insight into the basic architecture of the N and C termini of the TRPV1 ion channel by using FRET measurements between donor and acceptor molecules introduced in the channel. We genetically attached the enhanced yellow and cyan fluorescent proteins to the N- or C-terminal ends of the protein, expressed these TRPV1 chimeras into HEK 293 cells and Xenopus laevis oocytes, and measured FRET by the spectral FRET method (26). We were able to determine the coarse architecture of the N and C termini within the tetramer and their localization relative to the plane of the membrane.
EXPERIMENTAL PROCEDURES
Molecular Biology
Enhanced yellow and cyan fluorescent proteins (FPs) were inserted in the N or C termini (or both) of the rat TRPV1 channel (rTRPV1). The FPs were amplified by PCR from plasmids peYFP or pAmCyan (C1 or N1, Clontech) and inserted into the N or C termini of the channel with the linker GGSGGSGGS in all cases. The construct FP-Linker-rTRPV1-Linker-FP was obtained from the previous FP-Linker-rTRPV1 and rTRPV1-Linker-FP constructs, using NotI and SacII restriction sites. The tandem dimer rTRPV1-rTRPV1 was generated with a similar technique to that reported by Gordon and Zagotta (27) for cyclic nucleotide-gated channels. FPs were inserted at the C terminus of this dimer. A BlpI restriction site was engineered at the beginning of our C-terminally labeled channel (rTRPV1-Linker-FP), where the A protomer of the dimer with a 21-residue linker QQQQQQQQIEGRQQQQQQQQA (released by KpnI and BlpI restriction) was introduced. These constructs were cloned into the pcDNA3 vector (Clontech). Hv1-mCitrine and Hv1-mCerulean were a gift from Dr. Justin Taraska from the NHLBI, National Institutes of Health. These constructs contain the FPs at the end of the C terminus and are cloned into pcDNA6.2-DEST. For expression in oocytes, pcDNA3 plasmids were linearized with Not1, and pcDNA6.2-DEST was linearized with AgeI. mRNA was synthesized in vitro using the mMessage mMACHINE T7 transcription kit (Ambion). All restriction enzymes were purchased from New England Biolabs.
Channel Expression
Human embryonic kidney cells (HEK 293) were grown at 37 °C in a humidified atmosphere of 95% air and 5% CO2. The cells were transfected using Lipofectamine (Invitrogen) or JetPei (Polyplus Transfection) following previously described methods (13) with plasmid containing either the individual constructs or cotransfected with eYFP- and CFP-labeled constructs; experiments were performed 3 or 4 days after transfection.
X. laevis oocytes were surgically extracted and defolliculated as previously described (28). Oocytes were incubated at 18 °C in ND96 solution containing 96 mm NaCl, 2 mm KCl, 1.8 mm CaCl2, 1 mm MgCl2, 5 mm HEPES, 2.5 mm pyruvic acid, 20 μg/ml gentamycin (pH 7.5, NaOH). To increase oocyte survival, the ND96 solution was supplemented with 5% fetal bovine serum (Invitrogen), 1% penicillin/streptomycin (Invitrogen). Oocytes were injected with 36 nl of mRNA (∼1 μg/ml) 1 day after harvesting using a Nanostepper (Drummond Scientific) and pipettes of ∼20-μm-diameter opening. Experiments were performed 3–5 days after injection.
Electrophysiology
Electrophysiological characterization of the constructs was performed in HEK 293 cells. Inside-out patch clamp recordings were made using symmetrical solutions consisting of 130 mm NaCl, 3 mm HEPES, 1 mm EDTA. Membrane patches were perfused with solutions fed by gravity and changed with an RSC-200 rapid solution changer (Molecular Kinetics). Macroscopic ionic currents were sampled at 10 kHz and filtered at 2 kHz with an EPC 10 amplifier (HEKA Elektronik). Membrane patches were initially held at 0 mV for 10 ms, and the voltage was then stepped from 0 to 80 mV for 100 ms and then returned back to 0 mV for 10 ms. These recordings were performed at room temperature (∼23 °C). For all experiments, leak currents in the absence of capsaicin were subtracted from currents in the presence of capsaicin.
FRET Measurements
The apparent FRET efficiency Eapp was measured by the spectra-FRET method (26) in a home-modified TE-2000U (Nikon) inverted epifluorescense microscope. The excitation light source was an argon ion laser (Spectra-Physics); the laser is coupled to a multimode optical fiber using a 3-mm ball lens. Diverging light coming out of the fiber couples to the illumination port by a 50-mm focal length collimating lens and then is focused into the objective by a 300-mm lens.
Cells were imaged with a Nikon 60× oil immersion objective (numerical aperture 1.4). The microscope is coupled to a spectrograph (Acton Instruments) and a EMCCD camera (Luca, Andor) controlled by Micromanager software (29).
Emission spectra where obtained as follows. The spectrograph slit was partially closed to be able to image a small area of a cell (corresponding to the vertical lines in Fig. 1B). The light coming from the cell and passing through the slit was projected across the grating in the spectrograph to obtain a spectral image, which was collected by the camera. From this image, an emission spectrum of the membrane area (see horizontal lines in Fig. 1, B–D) was obtained using a line scan along the wavelength axis. The resulting line scans from the spectral images are shown in Fig. 1E. The emission spectrum of cells expressing channel-CFP constructs was first recorded at 458-nm excitation. Direct excitation (ratioA0) of eYFP constructs by 458-nm light was determined as the ratio of the emission intensities observed by exciting the eYFP at 458 and 488 nm.
FIGURE 1.
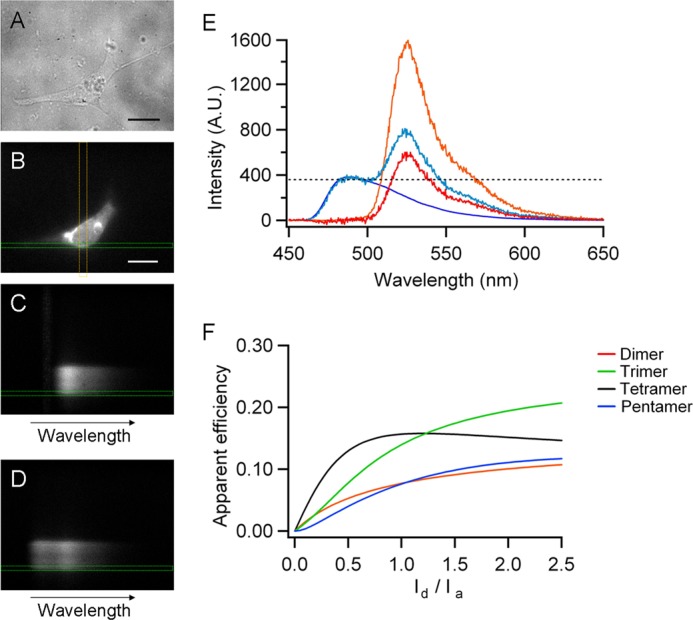
FRET was measured by the spectral FRET method. A and B, HEK 293 cell in bright field (A) and epifluorescence illumination (B). C and D, emission spectra of the same cell exited at 488 and 458 nm, respectively. The yellow vertical lines indicate the position of the spectrograph slit on the image, and the green horizontal lines indicate the zone where the line scan was performed, corresponding to the spatial coordinate of the membrane shown in B. E, the CFP spectra (blue line) was scaled to the first peak of the spectra of the experimental cells (light blue) and then subtracted, leaving only the eYFP spectra (RatioA, red) that contains two components, the first caused by the direct excitation by 458 nm (RatioA0) and the other caused by FRET with CFP (any value above the dotted line). F, predictions for different stoichiometries of the channel with adjacent FPs separated by 6.6 nm. The scale bars in A and B are 20 μm.
When cells cotransfected with a CFP and eYFP constructs are excited at 458 nm, the emission spectrum shows two peaks; the first one at 488 nm is the emission of the CFP protein, and the second at 525 nm is the emission of eYFP. This second peak contains three components, the first caused by bleed-through of CFP fluorescence, the second caused by direct excitation of YFP at 458 nm, and the third caused by FRET with CFP. To quantify the FRET efficiency from this spectrum, the CFP-only spectrum, which was obtained separately (Fig. 1E, blue line), was scaled to the first peak of the emission spectrum of the experimental cells and then subtracted, leaving only the eYFP spectrum. This subtracted spectrum contains two of the aforementioned components: the direct excitation at 458 nm and the FRET with CFP. Eapp is obtained as the difference: Eapp = ratioA − ratioA0, where ratioA is the ratio between the subtracted eYFP spectra and a third spectrum obtained by exciting at 488 nm (Fig. 1E, red and orange lines, respectively). From the emission spectrum for each cell, the fluorescence intensities of donor (Id) and acceptor (Ia) were obtained as the peak intensity of the CFP spectrum and the peak intensity of eYFP. Different values of Id and Ia were attained by varying the expression levels of donor and acceptor by transfecting different ratios of the donor and acceptor DNA.
To measure distances between the membrane and the fluorescent proteins located at the terminal domains of the channel, we used dipicrylamine (DPA) as an energy acceptor pair for eYFP. DPA was synthesized from 2–4-dinitro-N-phenylaniline (Sigma) following reported procedures (30). DPA is a small, negatively charged and nonfluorescent molecule that intercalates in the membrane. Its absorption spectra overlaps with the emission spectra of the FPs; therefore it makes for a good FRET pair with eYFP (31). Xenopus oocytes expressing eYFP labeled channels were placed in a glass coverslip coated with poly-d-lysine that constituted the bottom of the chamber for FRET measurements. After 30–40 min, the oocyte was carefully removed from the chamber by suction with a fire-polished glass pipette, leaving a small sheet of membrane attached to the glass (32). After addition of DPA to the chamber, emission intensity of eYFP was followed. Quenching of eYFP is observed because energy is transferred to the DPA acceptors.
TRPV1 Agonists
Capsaicin was obtained from Sigma and dissolved in ethanol in a stock solution at 4 mm. This stock was later diluted to final concentrations ranging from 10 nm to 4 μm in recording solution. Stock solutions of lysophosphatidic acid (Avanti Polar Lipids) were prepared in DMEM (Invitrogen) with 1% fatty acid-free bovine serum albumin following the previously reported methods (8). For FRET measurements, all agonists were diluted from stocks to saturating concentrations. For experiments involving heat activation of TRPV1, temperature was controlled with a PTC-10 Peltier temperature control system (NPI Electronics) and monitored with a thermistor (Warner Instruments) placed near the cells or the membrane sheets.
Predicting FRET Efficiency
The coupling efficiency of a donor-acceptor pair is given by Forster's equation (33),
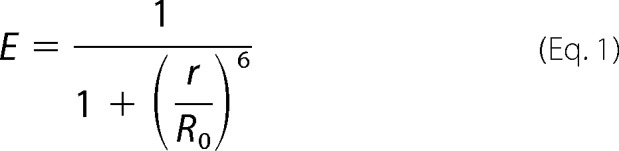 |
where r is the donor-acceptor distance, and R0 is the characteristic distance for transfer.
In our experiments we have a mixture of donors, acceptors, and donor-acceptor pairs. To determine the efficiency of FRET in these conditions, we note that the first two will contribute to the fluorescence but not to the FRET signal.
The rate, k of FRET for a donor-acceptor pair is,
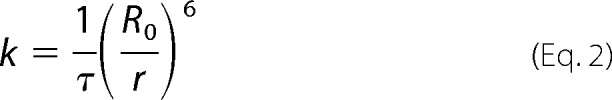 |
where τ is the fluorescence decay life time (rate = 1/τ) when there is no acceptor. If there are two acceptors at distances r1 and r2 from one donor, the rate of transfer should be as follows.
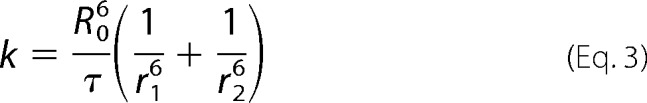 |
The efficiency is as follows.
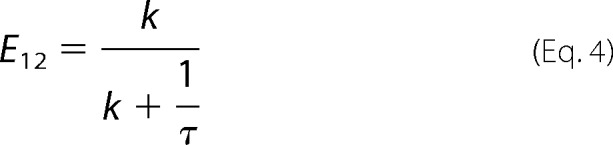 |
In general, for 1 donor and na acceptors,
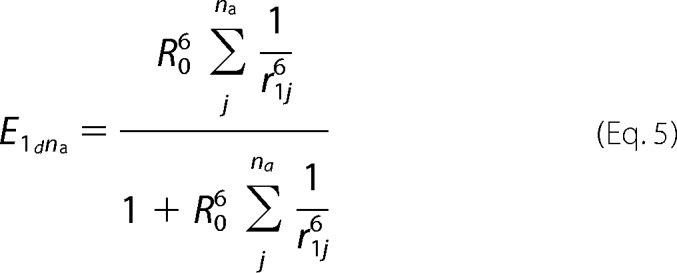 |
Now, if there is more than one donor, each one can excite one acceptor at a time, so the efficiency, E, is the average for the two excitation pathways: k = [(kd1a1 + kd1a2) + (kd2a1 + kd2a2)]. In general for nd donors and na acceptors, the efficiency is as follows.
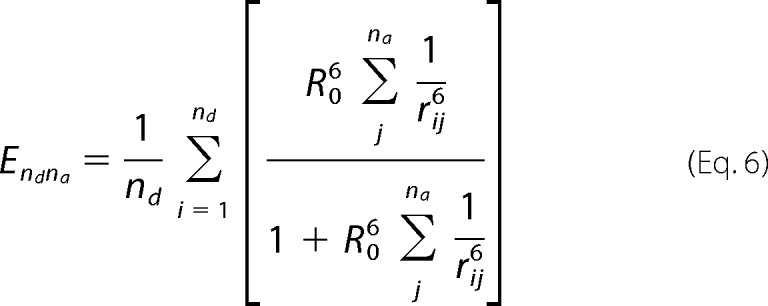 |
The efficiency will depend on the stoichiometry of donors and acceptors. We can calculate the probabilities of forming different populations of channels by,
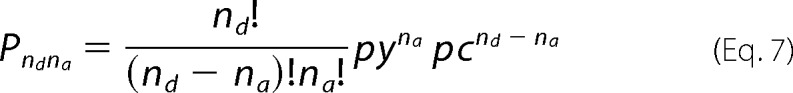 |
where py is the probability of acceptor, pc is the probability of donor, nd is the number of donors, and na is the number of acceptors. In this equation, we have assumed independent association of donor and acceptor subunits.
The apparent FRET for a donor, D, and an acceptor, A, that form a complex DA, is given by the following equation.
 |
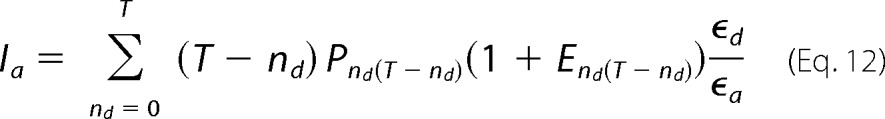
This can be generalized to describe the efficiency for a channel with arbitrary stoichiometry formed by T subunits,
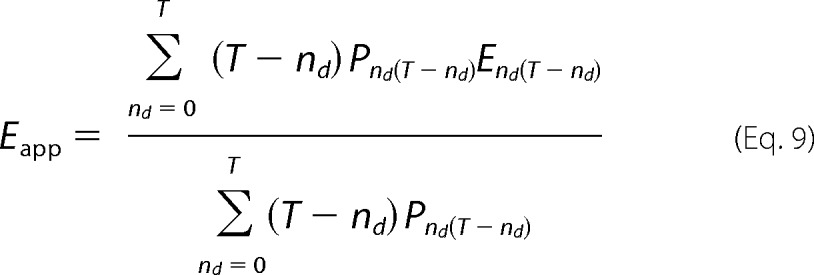 |
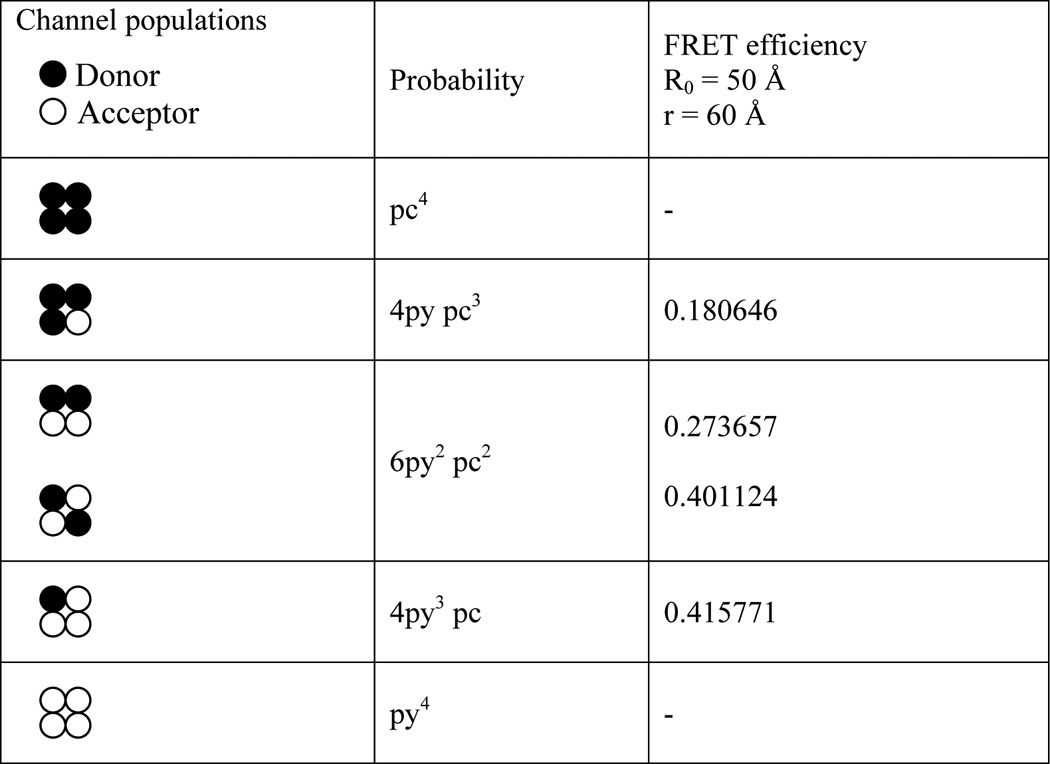
where T is the number of subunits, nd is the number of donors, (T − nd) is the number of acceptors, Pnd(T-nd) is the probability of occurrence of a channel with nd donors and (T − nd) acceptors, and End(T-nd) is the intrinsic efficiency of the same channel. The probabilities of assembly of different tetrameric channel populations and their respective intrinsic efficiency are given in Table 1.
TABLE 1.
Probability of assembly of different tetrameric channel populations and their respective calculated intrinsic FRET efficiency for a hypothetical R0 = 50 Å and separation between adjacent subunits, r = 60 Å
The fluorescence intensity ratio, Fr, is given by the ratio of total donor intensity to total acceptor intensity,
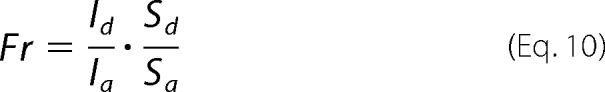 |
where
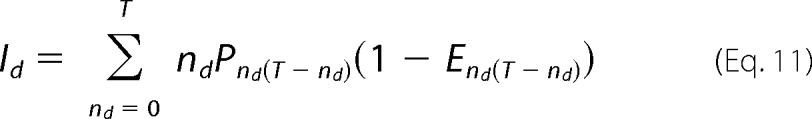 |
 |
and where ϵd and ϵa are the donor and acceptor molar extinction coefficients at the donor excitation wavelength, and Sa and Sd are the detection factors for donor and acceptors, respectively.
The measured values of Eapp are plotted as a function of the fluorescence intensity ratio, Id/Ia. The predictions for the efficiency of FRET for a given model are compared against data by plotting Equation 9 as a function of Equation 10 (Fig. 1F). All data analysis and modeling were done with programs written in IgorPro (Wavemetrics).
Anisotropy measurements
We measured the emission anisotropy to evaluate mobility of the FPs attached to TRPV1. Anisotropy was measured from HEK 293 cells and oocytes expressing eYFP-channel fusion constructs using an epifluorescence microscope with a 60×, 1.4 N.A. objective. An excitation polarizer was placed right before the excitation filter in a horizontal position, and one emission polarizer was placed underneath the filter cube where vertical and horizontal polarization is controlled. Two images were obtained separately from the same sample, one with the two polarizers in the horizontal orientation (parallel position) and the other by switching the emission polarizer to a vertical orientation (perpendicular position). The steady-state anisotropy, A, was calculated as,
 |
where I‖ is the parallel intensity, and I⊥ is the perpendicular intensity with respect to the excitation polarization.
The intrinsic properties of the system were assessed by measuring the anisotropy of fluorescein isothiocyanate (Pierce) dissolved in increasing concentrations of glycerol ranging from 0 to 99%; fluorescein final concentration was always 10 μg/ml. Anisotropy was first measured in an PC1 spectrofluorometer (ISS) and then compared with that measured in the microscope (see Fig. 7A), from which a correction factor of 1.45 was calculated and used to calibrate measurements of fluorescence anisotropy of proteins expressed in cells imaged by our microscope.
FIGURE 7.

Measurements of the anisotropy of fluorescent constructs. A, anisotropy of FITC dissolved in increasing concentrations of glycerol. Anisotropy was measured by fluorometry and microscopy to determine the intrinsic properties of the system. The correction factor was 1/m = 1.45. B, epifluorescence images of HEK 293 cells expressing the C-terminally eYFP-labeled (top panel) and the N-terminally eYFP-labeled channel (bottom panel). Left panels, shown in parallel intensity (I‖); middle panels, shown in perpendicular intensity (I⊥); right panels, the calculated anisotropy shown in pseudocolor scale.
RESULTS
Static Measurements of the Domain Organization of TRPV1 Channels
To estimate the dynamic range of the FRET measuring method and the sensitivity of our optical setup, we first carried out control experiments by coexpressing the dimeric proton channel Hv1, tagged at the C terminus with mCitrine or mCerulean fluorescent proteins. Hv1 proton channels have been determined to be functional dimers (34, 35). Structural information available for this protein indicates that the C terminus of the dimer forms a coiled-coil, suggesting that these terminal regions of the protein may be very close (36). In agreement with this, we find that the efficiency of FRET between the fluorescent protein-tagged channels is very high (Fig. 2A). The apparent FRET efficiency increases monotonically as a function of the fluorescence intensity ratio (Id/Ia) and approaches a constant value, as expected for assembly of channels with fixed stoichiometry. To compare the data with different models of subunit assembly, we plotted Equation 9 as a function of Equation 10 using a known value of Ro = 53 Å (37) for the pair mCitrine-mCerulean and varying the value of the distance between fluorophores. The data can be best fit by a dimmer with fluorophores separated by 4.7 nm.
FIGURE 2.
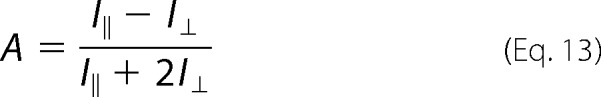
FRET in C-terminal constructs. A, FRET between mCitrine and mCerulean at the C terminus of the Hv1 channel. The black solid and dotted lines are the predictions for a 4.5 ± 0.2 nm interfluorophore distance for a single FRET pair, according to Equations 9 and 10 with T = 2. The blue and green lines are predictions for a tetramer and a trimer, respectively, with the same interfluorophore distance. B, cotransfection of Hv1-mCitrine and TRPV1-CFP subunits yields no FRET. The top images show the differential expression of Hv1 (panel I) and TRPV1 (panel II) in the same HEK 293 cell. The scale bars are 10 μm.
These data demonstrate that the FRET method is capable of determining FRET efficiency and that our model predicts accurately the known degree of oligomerization of the channel. As a negative control, we coexpressed Hv1-mCitrine and TRPV1-CFP. These two proteins should not associate and therefore should not produce any FRET. As expected, the FRET efficiency calculated from these cells is essentially zero and serves as a base line for all subsequent measurements (Fig. 2B).
Genetically labeling TRPV1 channels at the C terminus with either eYFP or CFP yielded functional channels that are activated in a dose-dependent manner by capsaicin (EC50 = 280 and 330 nm, respectively) (Fig. 3A) and preserve other characteristics such as outward rectification of the IV relationship and voltage dependence (data not shown). The EC50 for capsaicin of these constructs is very similar to the corresponding value for WT (nontagged) channels of 232 nm. The fluorescence emission spectra of the FPs attached to the channel correspond to previously published spectra for eYFP or CFP (26, 38). To determine the distance between fluorescent proteins attached to the C terminus of the channel, we coexpressed the eYFP labeled and CFP labeled subunits in HEK 293 cells and measured the efficiency of FRET. As with the Hv1 channel, the efficiency of FRET was graphed as a function of the donor to acceptor intensity ratio (Id/Ia), to compare with the mathematical expressions described under “Experimental Procedures” and estimate the stoichiometry of the channel and the interfluorophore distance. The FRET data for the pair at this position agrees with the prediction that the channel is a tetramer and allowed us to estimate the distance between adjacent FPs. This is because the distance between two diagonally located fluorophores in the same square-shaped plane within a tetramer will correspond to r, where r is the adjacent interfluorophore distance. Using the value Ro = 49.2 Å, the adjacent fluorescent proteins located at the C terminus were determined to be 6.6 ± 2 nm apart (Fig. 3C).
FIGURE 3.

FRET in C-terminal constructs. A and B, capsaicin activates the C-terminally FP-labeled channels (A, n = 8), and the tandem dimer-FP constructs (B, n = 4) in a dose-dependent manner. Solid lines indicate the fit with the Hill equation. C, FRET between CFP and eYFP in the C terminus of TRPV1. The data are presented as the average of the efficiency in 0.1 intervals of the intensity ratio. Solid and dotted lines are the predictions for adjacent FPs separated by 6.6 ± 0.2 nm (r1). D, FRET in a tetramer made of dimers with a single FRET pair at the C terminus; the prediction for a diagonal distance is 8 ± 0.6 nm (r2).
According to this result, if the C termini are located at the corners of a square plane, the distance between two diagonally located fluorophores in the same plane would be 9.5 nm. To have an independent estimate of this distance, we coexpressed TRPV1 tandem dimers labeled with eYFP or CFP at the C terminus (one FP/dimer).
The channels generated by these tandem constructs should be dimers of two dimers and have a single FRET pair in diagonally located C termini (27). The relationship between apparent FRET efficiency and fluorescence intensity ratio for these channels can be described by a model with a single FRET pair. The distance estimated for these functional channels was 8 ± 2 nm, which is similar to the predicted diagonal distance of 9.5 nm (Fig. 3D), and supports the assertion that the C termini are located at the corners of a square plane.
Next, we assessed the FRET efficiency of N-terminally labeled TRPV1 channels with CFP or eYFP (Fig. 4). Both of these chimeras are functional, and the FPs also preserve their emission spectra; they are both activated by capsaicin in a dose-dependent manner, with EC50 = 174 nm for the eYFP channel and 181 nm for the CFP channel. Analysis of cells cotransfected with these constructs yields almost no FRET efficiency, indicating that the distance for the adjacent FPs at the N terminus is at or beyond the limiting distance for FRET between the CFP and eYFP pair. According to the model, again considering tetrameric channels, the distance between FPs at the N terminus was 10 nm or larger.
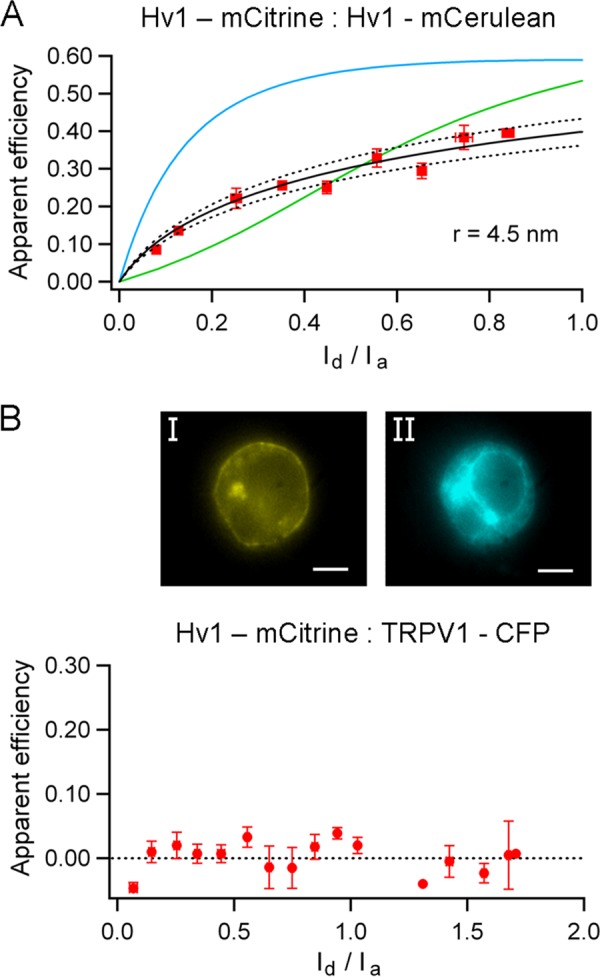
FIGURE 4.
FRET in N-terminal constructs. A, dose-response curves for capsaicin for the N-terminally FP-labeled channels; n = 2 for CFP construct and n = 7 for eYFP construct. The data were fitted to the Hill equation, and the EC50 values are given in the text. B, cotransfection of eYFP and CFP subunits yields a channel with essentially no FRET; therefore the predicted separation for the adjacent FPs is ≥10 nm (r3).
The results above suggest that the N terminus is located peripherally to the C terminus. To gain a better picture of the organization of terminal domains, we determined the distance of the N- and C-terminal domains in the normal direction to the membrane. To this end, we used DPA, which is a nonfluorescent hydrophobic anion that intercalates in the membrane. DPA functions as an energy acceptor with fluorescent proteins, resulting in quenching of their fluorescence emission by a FRET mechanism (23, 39).
The relative distance between the fluorophores attached to the channel and the membrane can then be determined by measuring the efficiency of FRET between these two probes. For these experiments, we used eYFP labeled TRPV1 channels expressed in oocytes and prepared membrane sheets from them (32) to measure fluorescence emission spectra.
When the C-terminally labeled channel is expressed, addition of 20 μm of DPA (23) to the bath solution (intracellular face of the membrane sheet) produces a steady-state reduction of the eYFP fluorescence intensity down to 40% of its initial value. In contrast, when we expressed the N-terminally labeled channel, the eYFP fluorescence was reduced by 20 μm of DPA to 70% of its initial value (Fig. 5B). It has been reported that fluorescence quenching of free GFP in solution by the same concentration of DPA we used is 3% (23), which is consistent with the fact that, at 20 μm, the average distance between DPA molecules in solution should be near 10 nm. We can assume that the quenching of free eYFP will be similar because the R0 for the pair eYFP-DPA is close to that of the GFP-DPA pair (31 and 37 Å, respectively) (31). Therefore, the larger than 3% quenching of fluorescence suggests that eYFP attached to the N or C terminus of the channel was close enough to the DPA intercalated in the membrane to observe FRET.
FIGURE 5.

Quenching of fluorescent proteins attached to terminal domains of Hv1 and TRPV1 by DPA in X. laevis oocyte membrane sheets. A, DPA quenches ∼40% of the fluorescence of the mCitrine-labeled Hv1 channel. B, quenching of eYFP by DPA is different if attached to the N terminus or C terminus of the TRPV1 channel. C, quantitative description of the spatial location of FPs in TRPV1 and DPA. Gray and black spheres represent the C-terminal and N-terminal FPs, respectively; the disk-like arrangement of dots represents the multiple DPA molecules with the empty center indicating where the transmembrane domains of the tetramer should be. The calculation is carried out in a box of 40 nm per side. D, the simulation of FRET predicts a separation of 8.9 nm (r4) for the N-terminal and of 6.7 nm (r5) for the C terminus of the TRPV1 from the membrane.
To relate the magnitude of fluorescence quenching with the separation of the FPs from DPA in the membrane, we developed a quantitative description of FRET between eYFP and DPA that takes into account their relative spatial location. We assumed FRET between a channel with four identical fluorescent proteins and multiple DPA molecules in the membrane (Fig. 5C). In the simulation, each of the four FPs in the channel transfers energy to every DPA molecule in the membrane and the FRET efficiency is calculated according to the following.
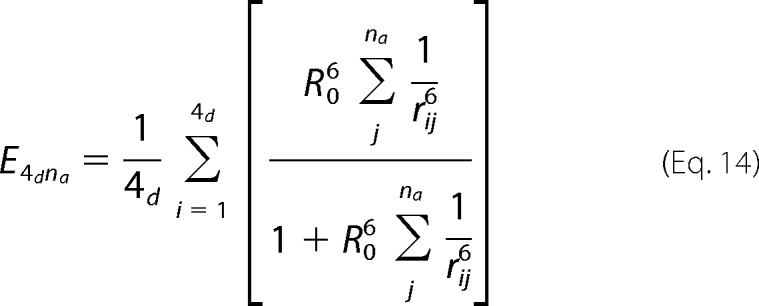 |
In this equation, rij is the distance from the jth DPA to the ith eYFP molecule calculated as follows.
 |
In accordance with the adjacent distances we measured previously and keeping 4-fold symmetry, the absolute values of the coordinates xi,yi for each of the four eYFPs are, in Angstroms (30, 30) in the C terminus and (50, 50) in the N terminus. The coordinates for each DPA molecule were set randomly on a circular plane around the channel with constant zj = 0. The sum over the index j in Equation 14 runs up to the number of DPA acceptors, which we set to be 1400 and which are placed in the intracellular face of the membrane. Because quenching of eYFP by DPA is a direct estimate of the FRET efficiency between this pair, we only varied the coordinate zi until Equation 14 gave an efficiency equal to the quenching level: 0.3 for YFP in the N terminus and 0.6 for YFP in the C terminus.
Thus we determined that the separation of eYFP located at the C-terminal from the DPA in the membrane was 6.7 nm, and if located at the N-terminal, this separation was 8.9 nm (Fig. 5D). Given that the average location of DPA normal to the membrane is voltage-dependent (39) and that in our experiments in membrane sheets the membrane potential is 0 mV, a more accurate position for DPA might be the center of the membrane, because the midpoint of DPA-associated charge movement is close to 0 mV (40). This will shorten our measured distances by ∼1.5 nm.
As a control, we expressed the C-terminally labeled Hv1 channel, for which an x-ray structure of the coiled-coil C-terminal domain is available (36). The addition of 20 μm of DPA to the bath solution (intracellular face of the membrane sheet) produces a steady-state reduction of the mCitrine fluorescence intensity of 40% of its initial value (Fig. 5A). Assuming this level of quenching is proportional to a FRET efficiency of 0.4 and R0 = 32 Å for DPA and mCitrine, Equation 14 modified for a dimmer yields a separation between the two mCitrine and DPA in the membrane of 85 Å. The coiled-coil domain of Hv1 starts almost immediately after the S4 segment and measures ∼65 Å. mCitrine is attached at the end of this domain, and its fluorophore is located approximately in the middle, adding to a total separation from the membrane of ∼90 Å, which is consistent with the estimated separation calculated from the quenching experiment and lends credence to this experimental approach.
Up to here we have determined the spatial location of the terminal domains independent of each other and with respect to the membrane. We next wondered which is the distance and relative orientation of the N and C termini with respect to each other. To this end, we cotransfected N-terminally eYFP-labeled subunits and C-terminally CFP-labeled subunits in HEK 293 cells. Channels formed by these subunits should have FRET efficiencies dominated by transfer from the C-terminal to the N-terminal fluorescent proteins.
As shown in Fig. 6A, FRET efficiency at high Id/Ia ratios is high. Interestingly, an accurate prediction of the observed FRET can be made with a tetrameric model only if there is a ∼40° angular torsion between the plane of the N termini and the plane of the C termini. If the C- and N-terminal planes had the same orientation, their separation distance would be larger, leading to lower levels of FRET than those observed. To corroborate this result, we constructed and functionally expressed a channel labeled with eYFP in the N terminus and CFP in the C terminus of the same subunit. Thus, this construct should assemble into a tetramer with four CFP-eYFP FRET pairs. This channel with eight fluorescent proteins remained activated by capsaicin in a dose-dependent manner with an EC50 = 73 nm. Its cellular distribution was the same as all other constructs and retained a similar expression level in the membrane.
FIGURE 6.

Possible angular torsion between the N- and C-terminal planes. A, FRET between N-terminally eYFP-labeled and C-terminally CFP-labeled subunits. The critical distances are represented in the diagrams as r6, r7, and r8. The gray solid line in the right panel is the prediction for no angular torsion between the terminal planes as shown in (panel i). The only arrangement for the observed FRET corresponds to an approximately 40° rotation between the N- and C-terminal planes as shown in panel ii. B, the assembled double labeled channel with eight fluorescent proteins is activated by capsaicin in a dose-dependent manner (n = 8). The observed FRET in this channel is consistent with a 45° angular torsion between the N- and C-terminal planes. The arrows in the diagram indicate the direction of the energy transfer for one of the four acceptors.
The observed FRET efficiency in this doubled-labeled channel was very high, 0.46 ± 0.08, because of the multiple energy transfer pathways. This value is consistent with the predicted FRET (0.53) of a tetramer with four FRET pairs and a 45° angular torsion between the N- and C-terminal planes (Fig. 6B).
Because FRET efficiency is also dependent on the orientation of the pair of fluorophores, we were interested in determining the mobility of our channel-attached FPs. Fluorescence emission anisotropy measurements can provide an idea of how free the fluorophore is to rotate in space and thus indicate whether a value of the orientation factor, κ2 = 2/3, is justified (33). Although a direct estimate of κ2 from an anisotropy value is not possible, it has been shown that the error between the estimated distance and the actual distance that is introduced by calculating R0 using κ2 = 2/3, is ∼10% if the anisotropy is less than 0.3 (41). Even if fluorophores are not highly mobile, the error introduced in the distance by using κ2 = 2/3 falls within the 67% confidence interval (42).
The anisotropy we measured from eYFP was 0.1 ± 0.04 and 0.11 ± 0.07 if attached to the N and C terminus of the channel, respectively (Fig. 7B). These low anisotropy values are very similar to the anisotropy that has been previously measured for GFP and other variants attached to terminal domains of ion channels (26). Also, these measurements indicate that the yellow fluorescent protein was similarly mobile regardless of the terminal domain to which it was attached in the channel, further indicating that the observed FRET most likely reported distance instead of restricted orientation of the fluorescent proteins attached to different intracellular terminal regions.
To summarize these results, we mapped the estimated distances of the terminal domains into the available cryoEM density of the channel (11). As shown in Fig. 8, there is good agreement between our data on the position of N- and C-terminal domains and the oligomeric size of the TRPV1 channel.
FIGURE 8.
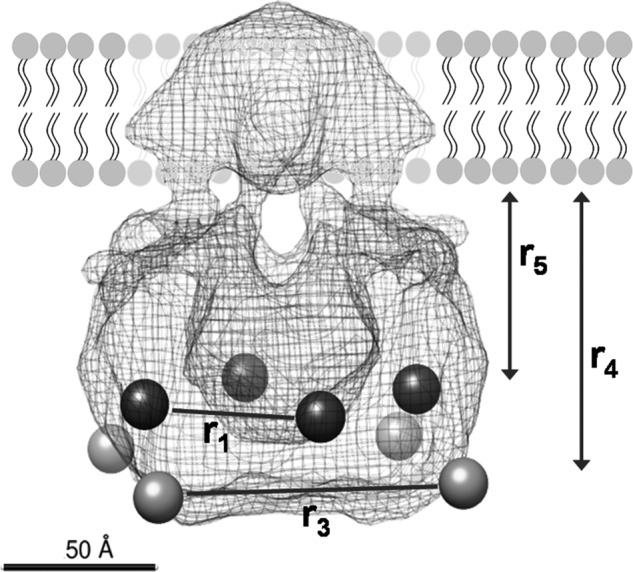
Mapping of the distances determined in our experiments into the 19 Å resolution structure of the TRPV1 determined by single particle electron cryoEM (11). The light gray spheres represent the FPs located at the N terminus, and the dark gray spheres represent the FPs at the C terminus. Mapping was performed with the UCSF Chimera software (46).
Domain Organization of the TRPV1 Channels upon Activation
To determine whether channel activation promotes any conformational changes between the terminal domains, FRET measurements were performed in the presence of capsaicin (4 μm), allicin (200 μm), and lysophosphatidic acid (5 μm) and at three fixed temperatures: 22, 32, and 42 °C; additionally, because TRPV1 channel desensitization by capsaicin occurs in a calcium-dependent manner (43), we measured FRET in the presence of calcium (2 mm) and capsaicin. The results were as follows (Fig. 9).
FIGURE 9.

A–D, the activation of the channel does not modify the FRET efficiency between the FPs located at the C-terminal domains (A), between the C-terminal located eYFP and DPA intercalated in the membrane (B), between the FPs located at the N terminus of the channel (C), and between the N-and C-terminal domains of the same subunit (D). There was no change in FRET by activating the channel in the presence of calcium. E and F, RatioA calculated from the C-terminally labeled TRPV1 (E) and the doubled labeled channel (F). The dotted line represent the ratioA0. The quantity of FRET is obtained by the difference: ratioA − ratioA0. There was no significant change in FRET at the three temperatures tested.
There was no change in FRET between adjacent FPs located at the C terminus after addition of capsaicin, with respect to calcium-free solution either in the presence of calcium in channel-expressing HEK 293 cells or in oocyte membrane sheets. FRET between the C-terminally located eYFP and membrane-intercalated DPA did not change either in the presence of capsaicin, allicin, or lysophosphatidic acid. For the N-terminally labeled channel, there was no change in FRET after addition of capsaicin with and without calcium with respect to calcium-free solution.
We decided to test the agonists in the construct that yields the maximum amount of FRET in our experiments: the double-labeled channel. The observed FRET was the same as in saline, in the presence of capsaicin or allicin.
To measure possible conformational changes caused by temperature, first we monitored the intensity of the fluorescent proteins alone at all the temperature range tested (from 22 to 42 °C). There were no changes in the emission spectra of the two FPs in this temperature range (data not shown). Experiments were performed in oocyte membrane sheets expressing the C-terminally labeled channels and the doubled-labeled channel; there was no change in FRET in either of the two constructs at the three temperatures tested (Fig. 9, E and F).
One explanation for the lack of changes in FRET associated with the activation of the channel is that the conformational change fixes the fluorescent protein in an unfavorable orientation, counteracting the change in FRET caused by distance. To explore this possibility, we measured anisotropy of eYFP attached to the C-terminal of the channel in the presence of capsaicin; the anisotropy was the same as in saline solution, indicating that the FPs are not restricted upon activation of the channel and that our FRET efficiency measurements remain valid when the channel is activated.
DISCUSSION
In this work we have determined the coarse architecture and the relative positions of the terminal domains of the TRPV1 ion channel by means of FRET measurements. We found that the fusion of FPs in the cytoplasmic terminal regions of the channel does not compromise channel function and that it is possible to determine FRET within or between channel subunits. We considered different subunit compositions of TRPV1, and the fit to our data is consistent with a tetrameric stoichiometry. This is in accordance with other measurements of the subunit composition of TRPV1 that have also found a tetrameric arrangement (9, 10).
The measured FRET efficiency in our constructs indicates that the C-terminal domains of adjacent subunits are closer than the adjacent N-terminal domains and also that the C-terminals are closer to the membrane than the N termini. The distance determined from FRET efficiency measurements between labeled N termini within a channel is a minimum distance because the FRET efficiency is close to zero. It seems that this is not the result of a methodological problem, because we could reliably measure FRET in other constructs and other channels (see Fig. 2). Another possibility is that, because FRET originates from a dipole-dipole interaction, the donor and acceptor dipoles in the N-terminal constructs were not in a favorable orientation. It has been reported that the error in distance introduced by the orientation factor (assuming κ2 = 2/3) is relatively small, for molecules with total anisotropy smaller than 0.3, the error introduced is ∼10% (41). Our anisotropy measurements indicate that the FPs attached to either the N or C terminus of the channel are quite mobile under our experimental conditions, suggesting that the FRET efficiency measurements can be reasonably interpreted in terms of distance and that the adjacent N-terminal domains are at least 10 nm apart from each other.
Our data indicate that the plane of FPs located in the C termini is rotated 45° with respect to the N termini plane, forming an alternating arrangement of C and N termini. Although it could be argued that this proposed rotation does not represent the arrangement of the terminal domains of the channel but instead a forced packing caused by the size of the FPs that do not interfere with its function (44), it has been proposed by molecular modeling (45) that there could exist a particular rotation between the terminal domains of the same subunit that stabilizes the channel conformation.
We also determined the relative distances of the C- and N-terminal labels to the plasma membrane via the quenching of eYFP fluorescence by DPA that occurs through a FRET mechanism. These measurements are complicated by the fact that the number of DPA molecules incorporated into the membrane is unknown. The amount of observed quenching is proportional to the FRET efficiency, because this measurement is equivalent to a donor dequenching experiment (33). To reproduce the observed degree of quenching at 20 μm DPA, we carried out a simulation in which 1400 DPA molecules are placed around a channel and occupy a circular area of ∼680 nm2. This is equivalent to a DPA molecular density of ∼2.8 × 10⁻² molecules Å−2. It has been previously estimated that the concentration of DPA in the membrane when 4 μm is present in the bath is equivalent to a density of 10−4 molecules Å−2 (31). So our estimates are not too different and can be explained by our use of an increased concentration of DPA.
Although very robust FRET was observed between the FPs located at the terminal domains and between membrane-intercalated DPA and the FPs, there was no change in FRET efficiency after activation of the channel either by ligands or temperature changes, indicating that the terminal domains do not move relative to each other or relative to the membrane during activation or that the conformational changes are too small to be detected with these probes.
It has been proposed that a calcium-dependent, CaM-mediated interaction between the N- and C-terminal domains occurs concomitant with the desensitized state of the channel (24). This suggests that Ca2+-CaM binding to its N- and C-terminal sites promotes a conformational change in which these terminal domains get closer, producing the desensitization of the channel. This hypothesis has also been incorporated into a homology model of the channel (45). We hypothesized that it could be possible to determine this interaction in our experiments and tried to determine its extent using several of our constructs. The N-terminally labeled construct did not show an increase in FRET upon activation of the channel in the presence of calcium, indicating that the N termini do not approach each other during desensitization. Also, there was no detectable change in FRET in the double-labeled channel, in which we expected to determine whether the N-terminal domain moves closer to the C terminus, because of the proximity of the FPs (which is close to the R0 for the eYFP-CFP pair) and the large efficiency of FRET. These results suggest that the proposed interaction between the terminal domains during desensitization involves a discreet conformational change.
A limitation in our experiments, especially for dynamic measurements of changes in FRET efficiency as a result of channel activation, is that the chromophores in the FPs are located in the center of a 3-nm-diameter barrel, so the calculated distances correspond to the distance separating the FPs chromophores and not the distance between the actual terminal residues. We think that this limits the resolution of the measurements and the interpretation of our results, because distances below ∼3 nm cannot be measured. Despite this limitations, our estimates can be mapped to the available 19 Å resolution structure of TRPV1 channel determined by single particle cryo-electron microscopy (11). The electron density shows an “open basket” structure with a large void space in its center. Our data provide several insights that cannot be gleaned from this cryoEM structure. On the one hand, the FRET data place the C termini surrounded by the N-terminal domains. Moreover, our data suggest that these terminal domains are arranged in an alternating distribution. Another related discovery is that the C terminus is closer to the plasma membrane than the N terminus.
On the other hand, our data suggests a more compact structure than the one proposed by homology modeling (45). One discrepancy between our data and the cryoEM structure is the fact that there is a big void in the density in the middle of the open basket structure, which our data suggest should be occupied by the C-terminal domains. One interesting explanation is the possibility that the cryoEM structure captured a particular conformation favored by the conditions used to reconstitute the protein.
Acknowledgments
We thank Manuel Hernández (Facultad de Medicina, Universidad Nacional Autónoma de México) for expert instrument fabrication, Itzel Llorente (Instituto de Fisiología Celular) for help with cell culture, and Dr. Ronan Le Legadec and Omar Saavedra for help in chemical synthesis.
This work was supported by Consejo Nacional de Ciencia y Tecnologia (CONACYT) Scholarship 309408 (to V. D.-R.), CONACYT Grant 151297, Dirección General de Asuntos del Personal Académico-Programa de Apoyo a Proyectos de Investigación e Inovación Tecnológica (DGAPA-PAPIIT) Grant IN209209, and Instituto de Ciencia y Tecnología del Distrito Federal (ICyT-DF) PIFUTP09-262 (to L.D.I.) and the Marcos Moshinsky Foundation, CONACYT Grant 129474, and PAPIIT Grant IN204111 (to T. R.).
- TRPV1
- transient receptor potential vanilloid 1
- FP
- fluorescent protein
- eYFP
- enhanced yellow fluorescent protein
- CFP
- cyan fluorescent protein
- cryoEM
- cryo-electron microscopy
- DPA
- dipicrylamine.
REFERENCES
- 1. Xia R., Dekermendjian K., Lullau E., Dekker N. (2011) TRPV1. A therapy target that attracts the pharmaceutical interests. Adv. Exp. Med. Biol. 704, 637–665 [DOI] [PubMed] [Google Scholar]
- 2. Caterina M. J., Schumacher M. A., Tominaga M., Rosen T. A., Levine J. D., Julius D. (1997) The capsaicin receptor. A heat-activated ion channel in the pain pathway. Nature 389, 816–824 [DOI] [PubMed] [Google Scholar]
- 3. Zygmunt P. M., Petersson J., Andersson D. A., Chuang H., Sørgård M., Di Marzo V., Julius D., Högestätt E. D. (1999) Vanilloid receptors on sensory nerves mediate the vasodilator action of anandamide. Nature 400, 452–457 [DOI] [PubMed] [Google Scholar]
- 4. Tominaga M., Caterina M. J., Malmberg A. B., Rosen T. A., Gilbert H., Skinner K., Raumann B. E., Basbaum A. I., Julius D. (1998) The cloned capsaicin receptor integrates multiple pain-producing stimuli. Neuron 21, 531–543 [DOI] [PubMed] [Google Scholar]
- 5. Piper A. S., Yeats J. C., Bevan S., Docherty R. J. (1999) A study of the voltage dependence of capsaicin-activated membrane currents in rat sensory neurones before and after acute desensitization. J. Physiol. 518, 721–733 [DOI] [PMC free article] [PubMed] [Google Scholar]
- 6. Salazar H., Llorente I., Jara-Oseguera A., García-Villegas R., Munari M., Gordon S. E., Islas L. D., Rosenbaum T. (2008) A single N-terminal cysteine in TRPV1 determines activation by pungent compounds from onion and garlic. Nat. Neurosci. 11, 255–261 [DOI] [PMC free article] [PubMed] [Google Scholar]
- 7. Ufret-Vincenty C. A., Klein R. M., Hua L., Angueyra J., Gordon S. E. (2011) Localization of the PIP2 sensor of TRPV1 ion channels. J. Biol. Chem. 286, 9688–9698 [DOI] [PMC free article] [PubMed] [Google Scholar]
- 8. Nieto-Posadas A., Picazo-Juárez G., Llorente I., Jara-Oseguera A., Morales-Lázaro S., Escalante-Alcalde D., Islas L. D., Rosenbaum T. (2012) Lysophosphatidic acid directly activates TRPV1 through a C-terminal binding site. Nat. Chem. Biol. 8, 78–85 [DOI] [PubMed] [Google Scholar]
- 9. Kedei N., Szabo T., Lile J. D., Treanor J. J., Olah Z., Iadarola M. J., Blumberg P. M. (2001) Analysis of the native quaternary structure of vanilloid receptor 1. J. Biol. Chem. 276, 28613–28619 [DOI] [PubMed] [Google Scholar]
- 10. Kuzhikandathil E. V., Wang H., Szabo T., Morozova N., Blumberg P. M., Oxford G. S. (2001) Functional analysis of capsaicin receptor (vanilloid receptor subtype 1) multimerization and agonist responsiveness using a dominant negative mutation. J. Neurosci. 21, 8697–8706 [DOI] [PMC free article] [PubMed] [Google Scholar]
- 11. Moiseenkova-Bell V. Y., Stanciu L. A., Serysheva I. I., Tobe B. J., Wensel T. G. (2008) Structure of TRPV1 channel revealed by electron cryomicroscopy. Proc. Natl. Acad. Sci. U.S.A. 105, 7451–7455 [DOI] [PMC free article] [PubMed] [Google Scholar]
- 12. Hellwig N., Albrecht N., Harteneck C., Schultz G., Schaefer M. (2005) Homo- and heteromeric assembly of TRPV channel subunits. J. Cell Sci. 118, 917–928 [DOI] [PubMed] [Google Scholar]
- 13. Jara-Oseguera A., Llorente I., Rosenbaum T., Islas L. D. (2008) Properties of the inner pore region of TRPV1 channels revealed by block with quaternary ammoniums. J. Gen. Physiol. 132, 547–562 [DOI] [PMC free article] [PubMed] [Google Scholar]
- 14. Salazar H., Jara-Oseguera A., Hernández-García E., Llorente I., Arias-Olguín I. I., Soriano-García M., Islas L. D., Rosenbaum T. (2009) Structural determinants of gating in the TRPV1 channel. Nat. Struct. Mol. Biol. 16, 704–710 [DOI] [PubMed] [Google Scholar]
- 15. Gaudet R. (2009) Divide and conquer. High resolution structural information on TRP channel fragments. J. Gen. Physiol. 133, 231–237 [DOI] [PMC free article] [PubMed] [Google Scholar]
- 16. Yao J., Liu B., Qin F. (2011) Modular thermal sensors in temperature-gated transient receptor potential (TRP) channels. Proc. Natl. Acad. Sci. U.S.A. 108, 11109–11114 [DOI] [PMC free article] [PubMed] [Google Scholar]
- 17. García-Sanz N., Fernández-Carvajal A., Morenilla-Palao C., Planells-Cases R., Fajardo-Sánchez E., Fernández-Ballester G., Ferrer-Montiel A. (2004) Identification of a tetramerization domain in the C terminus of the vanilloid receptor. J. Neurosci. 24, 5307–5314 [DOI] [PMC free article] [PubMed] [Google Scholar]
- 18. Zhang F., Liu S., Yang F., Zheng J., Wang K. (2011) Identification of a tetrameric assembly domain in the C terminus of heat-activated TRPV1 channels. J. Biol. Chem. 286, 15308–15316 [DOI] [PMC free article] [PubMed] [Google Scholar]
- 19. Valente P., García-Sanz N., Gomis A., Fernández-Carvajal A., Fernández-Ballester G., Viana F., Belmonte C., Ferrer-Montiel A. (2008) Identification of molecular determinants of channel gating in the transient receptor potential box of vanilloid receptor I. FASEB J. 22, 3298–3309 [DOI] [PubMed] [Google Scholar]
- 20. Brauchi S., Orta G., Salazar M., Rosenmann E., Latorre R. (2006) A hot-sensing cold receptor. C-terminal domain determines thermosensation in transient receptor potential channels. J. Neurosci. 26, 4835–4840 [DOI] [PMC free article] [PubMed] [Google Scholar]
- 21. Gracheva E. O., Cordero-Morales J. F., González-Carcacía J. A., Ingolia N. T., Manno C., Aranguren C. I., Weissman J. S., Julius D. (2011) Ganglion-specific splicing of TRPV1 underlies infrared sensation in vampire bats. Nature 476, 88–91 [DOI] [PMC free article] [PubMed] [Google Scholar]
- 22. Islas L. D., Zagotta W. N. (2006) Short-range molecular rearrangements in ion channels detected by tryptophan quenching of bimane fluorescence. J. Gen. Physiol. 128, 337–346 [DOI] [PMC free article] [PubMed] [Google Scholar]
- 23. Taraska J. W., Zagotta W. N. (2007) Structural dynamics in the gating ring of cyclic nucleotide-gated ion channels. Nat. Struct. Mol. Biol. 14, 854–860 [DOI] [PubMed] [Google Scholar]
- 24. Lishko P. V., Procko E., Jin X., Phelps C. B., Gaudet R. (2007) The ankyrin repeats of TRPV1 bind multiple ligands and modulate channel sensitivity. Neuron 54, 905–918 [DOI] [PubMed] [Google Scholar]
- 25. Cui Y., Yang F., Cao X., Yarov-Yarovoy V., Wang K., Zheng J. (2012) Selective disruption of high sensitivity heat activation but not capsaicin activation of TRPV1 channels by pore turret mutations. J. Gen. Physiol. 139, 273–283 [DOI] [PMC free article] [PubMed] [Google Scholar]
- 26. Zheng J., Trudeau M. C., Zagotta W. N. (2002) Rod cyclic nucleotide-gated channels have a stoichiometry of three CNGA1 subunits and one CNGB1 subunit. Neuron 36, 891–896 [DOI] [PubMed] [Google Scholar]
- 27. Gordon S. E., Zagotta W. N. (1995) Subunit interactions in coordination of Ni2+ in cyclic nucleotide-gated channels. Proc. Natl. Acad. Sci. U.S.A. 92, 10222–10226 [DOI] [PMC free article] [PubMed] [Google Scholar]
- 28. Jara-Oseguera A., Ishida I. G., Rangel-Yescas G. E., Espinosa-Jalapa N., Pérez-Guzmán J. A., Elías-Viñas D., Le Lagadec R., Rosenbaum T., Islas L. D. (2011) Uncoupling charge movement from channel opening in voltage-gated potassium channels by ruthenium complexes. J. Biol. Chem. 286, 16414–16425 [DOI] [PMC free article] [PubMed] [Google Scholar]
- 29. Edelstein A., Amodaj N., Hoover K., Vale R., Stuurman N. (2010) Computer control of microscopes using μManager. Curr. Protoc. Mol. Biol., Chapter 14, Unit 14.20 [DOI] [PMC free article] [PubMed] [Google Scholar]
- 30. Marshall J. (1920) The preparation of exanitrodiphenylamine and its use as a booster for shell charges. J. Ind. Eng. Chem. 12, 336–340 [Google Scholar]
- 31. Wang D., Zhang Z., Chanda B., Jackson M. B. (2010) Improved probes for hybrid voltage sensor imaging. Biophys J 99, 2355–2365 [DOI] [PMC free article] [PubMed] [Google Scholar]
- 32. Ottolia M., Philipson K. D., John S. (2007) Xenopus oocyte plasma membrane sheets for FRET analysis. Am. J. Physiol. Cell Physiol 292, C1519–C1522 [DOI] [PubMed] [Google Scholar]
- 33. Lakowicz J. R. (2006) Principles of Fluorescence Spectroscopy, pp. 443–472, Springer-Verlag New York Inc., New York [Google Scholar]
- 34. Lee S. Y., Letts J. A., Mackinnon R. (2008) Dimeric subunit stoichiometry of the human voltage-dependent proton channel Hv1. Proc. Natl. Acad. Sci. U.S.A. 105, 7692–7695 [DOI] [PMC free article] [PubMed] [Google Scholar]
- 35. Koch H. P., Kurokawa T., Okochi Y., Sasaki M., Okamura Y., Larsson H. P. (2008) Multimeric nature of voltage-gated proton channels. Proc. Natl. Acad. Sci. U.S.A. 105, 9111–9116 [DOI] [PMC free article] [PubMed] [Google Scholar]
- 36. Fujiwara Y., Kurokawa T., Takeshita K., Kobayashi M., Okochi Y., Nakagawa A., Okamura Y. (2012) The cytoplasmic coiled-coil mediates cooperative gating temperature sensitivity in the voltage-gated H+ channel Hv1. Nat. Commun. 3, 816. [DOI] [PubMed] [Google Scholar]
- 37. Salonikidis P. S., Niebert M., Ullrich T., Bao G., Zeug A., Richter D. W. (2011) An ion-insensitive cAMP biosensor for long term quantitative ratiometric fluorescence resonance energy transfer (FRET) measurements under variable physiological conditions. J. Biol. Chem. 286, 23419–23431 [DOI] [PMC free article] [PubMed] [Google Scholar]
- 38. Overton M. C., Blumer K. J. (2000) G-protein-coupled receptors function as oligomers in vivo. Curr. Biol. 10, 341–344 [DOI] [PubMed] [Google Scholar]
- 39. Chanda B., Asamoah O. K., Blunck R., Roux B., Bezanilla F. (2005) Gating charge displacement in voltage-gated ion channels involves limited transmembrane movement. Nature 436, 852–856 [DOI] [PubMed] [Google Scholar]
- 40. Fernández J. M., Taylor R. E., Bezanilla F. (1983) Induced capacitance in the squid giant axon. Lipophilic ion displacement currents. J. Gen. Physiol. 82, 331–346 [DOI] [PMC free article] [PubMed] [Google Scholar]
- 41. Haas E., Katchalski-Katzir E., Steinberg I. Z. (1978) Effect of the orientation of donor and acceptor on the probability of energy transfer involving electronic transitions of mixed polarization. Biochemistry 17, 5064–5070 [DOI] [PubMed] [Google Scholar]
- 42. van der Meer B. W. (2002) Kappa-squared. From nuisance to new sense. J. Biotechnol. 82, 181–196 [DOI] [PubMed] [Google Scholar]
- 43. Rosenbaum T., Gordon-Shaag A., Munari M., Gordon S. E. (2004) Ca2+/calmodulin modulates TRPV1 activation by capsaicin. J. Gen. Physiol. 123, 53–62 [DOI] [PMC free article] [PubMed] [Google Scholar]
- 44. Miranda P., Manso D. G., Barros F., Carretero L., Hughes T. E., Alonso-Ron C., Domínguez P., de la Peña P. (2008) FRET with multiply labeled HERG K+ channels as a reporter of the in vivo coarse architecture of the cytoplasmic domains. Biochim. Biophys. Acta 1783, 1681–1699 [DOI] [PubMed] [Google Scholar]
- 45. Fernández-Ballester G., Ferrer-Montiel A. (2008) Molecular modeling of the full-length human TRPV1 channel in closed and desensitized states. J. Membr. Biol. 223, 161–172 [DOI] [PubMed] [Google Scholar]
- 46. Pettersen E. F., Goddard T. D., Huang C. C., Couch G. S., Greenblatt D. M., Meng E. C., Ferrin T. E. (2004) UCSF chimera. A visualization system for exploratory research and analysis. J. Comput. Chem. 25, 1605–1612 [DOI] [PubMed] [Google Scholar]