

Abstract
The development of tertiary structure during folding of staphylococcal nuclease (SNase) was studied by time-resolved fluorescence resonance energy transfer measured using continuous- and stopped-flow techniques. Variants of this two-domain protein containing intradomain and interdomain fluorescence donor/acceptor pairs (Trp and Cys-linked fluorophore or quencher) were prepared to probe the intradomain and interdomain structural evolution accompanying SNase folding. The intra-domain donor/acceptor pairs are within the β-barrel domain (Trp27/Cys64 and Trp27/Cys97) and the interdomain pair is between the α-helical domain and the β-barrel domain (Trp140/Cys64). Time-resolved energy transfer efficiency accompanying folding and unfolding at different urea concentrations was measured over a time range from 30 μs to ∼10 s. Information on average donor/acceptor distances at different stages of the folding process was obtained by using a quantitative kinetic modeling approach. The average distance for the donor/acceptor pairs in the β-barrel domain decreases to nearly native values whereas that of the interdomain donor/acceptor pairs remains unchanged in the earliest intermediate (<500 μs of refolding). This indicates a rapid nonuniform collapse resulting in an ensemble of heterogeneous conformations in which the central region of the β-barrel domain is well developed while the C-terminal α-helical domain remains disordered. The distance between Trp140 and Cys64 decreases to native values on the 100-ms time scale, indicating that the α-helical domain docks onto the preformed β-barrel at a late stage of the folding. In addition, the unfolded state is found to be more compact under native conditions, suggesting that changes in solvent conditions may induce a nonspecific hydrophobic collapse.
Keywords: protein folding, continuous-flow, stopped-flow, Förster energy transfer, fluorescence
Introduction
Many proteins undergo major conformational changes during early stages of folding that result in formation of compact intermediates with well-developed secondary structure before the rate-limiting step of the folding reactions.1–3 A detailed analysis of the structural, thermodynamic and kinetic properties of these intermediates is a critical step towards understanding the physicochemical principles of protein folding. Hydrogen/deuterium (H/D) exchange coupled with NMR has been the primary source of site-resolved information on hydrogen bond formation and secondary structure acquisition during folding.4–7 A number of studies have combined fluorescence resonance energy transfer (FRET) with rapid mixing techniques to obtain structural and dynamic information on long-range interactions in early folding intermediates.8–19 However, the ensemble of states observed within the first milliseconds of refolding is often structurally heterogeneous,20–23 and it is still unclear whether the initial collapse of the polypeptide chain is driven by specific or nonspecific local and long-range interactions.
Staphylococcal nuclease (SNase) is a 149-residue protein whose structure can be divided into two subdomains: an N-terminal domain consisting of a five-stranded β-barrel and an α-helix, and a C-terminal domain consisting of two α-helices (Fig. 1). Prior studies have shown that SNase folds into the native state via several partially structured intermediates that accumulate over the 10–500-ms time range along multiple parallel pathways.25–30 More recent ultrafast mixing measurements showed that additional states accumulate within the first millisecond of refolding, including a compact state with a partially structured β-barrel domain.31,32 NMR-detected H/D exchange studies revealed protected amide protons in strands II and III of the β-barrel domain early during folding at a folding time, tf, of ∼10 ms while most other amide protons became protected only during the final stages of folding.28,30 Previous studies using stopped-flow circular dichroism indicated that significant helical secondary structure is formed on the 10-ms time scale.26 Walkenhorst et al.27 showed that the state populated at tf ∼10 ms is an obligatory intermediate populated on a direct path between the unfolded ensemble and the native state. Taken together, these results indicate that at least two structural events precede the rate-limiting step in SNase folding: a localized chain collapse in the β-barrel region at tf∼100 μs and the formation of a stable β-hairpin and other elements of secondary structure on the 10-ms time scale. However, it remains unclear (i) whether the early conformational event with a time constant of 80 μs is driven by nonspecific hydrophobic collapse or by specific tertiary interactions, (ii) whether the contacts formed are native-like or non-native, and (iii) whether early structure formation is confined to the β-barrel domain.
Figure 1.

Ribbon diagram of Trp140 SNase (P47G/P117G/H124L) based on the crystal structure (PDB 1SNQ).24 The Cβ atoms of Tyr27, Trp140, Lys64, and Lys97 are shown as spheres. The Cβ-Cβ distances of Tyr27-Lys64, Tyr27-Lys97, and Trp140-Lys64 are shown in dotted lines. The β-barrel domain is encircled.
In order to observe the development of specific nonlocal (tertiary) interactions at various stages of folding of SNase, we combined ultrafast and conventional mixing techniques with FRET detection, using a unique tryptophan residue as a fluorescence donor and a Cys-linked fluorophore as an acceptor.15,19,20,33 We report detailed results on the kinetics of folding and unfolding of SNase for two sets of single Trp/Cys variants: in the first set, the donor and acceptor sites are located within the β-barrel domain; the second set contains a donor in the α-helical domain and an acceptor in the β-barrel domain. Our results indicate that (i) the average distances for all donor/acceptor pairs in the unfolded state of SNase are shorter under folding conditions (at low urea concentrations) than under strongly denaturing conditions (at high urea concentrations), suggesting a more compact unfolded state under native condition, (ii) the central region of the β-barrel domain assumes native-like compactness and tertiary interactions in the earliest intermediate of refolding (within 500 μs of refolding), and (iii) the α-helical domain docks onto the β-barrel domain during the final stages of folding (>100 ms).
Results and Discussion
Single-Trp/Cys variants (Trp27/Cys97, Trp27/Cys64, and Trp140/Cys64) of SNase were constructed by substituting appropriate residues (Y27W/W140H, K64C, and K97C) of the parent protein containing P47G/P117G/H124L mutations (Trp140 SNase, or WT* SNase27,31,32). The Cys-residue in each variant was chemically modified with either 5-((((2-iodoacetyl)amino)ethyl)amino)naphthalene-1-sulfonate (1,5-IAEDANS)34 or 2-nitro-5-thiobenzoic acid (TNB),35 resulting in AEDANS-labeled Trp27/Cys97 and Trp27/Cys64 SNase (Trp27/Cys97-AED and Trp27/Cys64-AED) and TNB-labeled Trp140/Cys64 SNase (Trp140/Cys64-TNB). In the native structure of SNase (Fig. 1),24 residue 27 is located in the turn between strands II and III, residue 64 in the middle of helix H1, and residue 97 between strand V and helix H2. All three residues are within the β-barrel domain. Residue 140 is on helix H3 in the α-helical domain. Therefore, both donor and acceptor are within the β-domain in the case of the Trp27 variants, but in different domains in the case of the Trp140/Cys64 variant. The side chains of Lys64 and Lys97 are fully exposed to the solvent in the native structure and expected to be mobile.
Figure 2 compares fluorescence spectra of the unmodified proteins upon selective excitation of tryptophan at 295 nm with absorption spectra of the dye-labeled proteins measured at 15°C under the native (100 mM sodium acetate at pH 5.3) and acid-denaturing (∼20 mM phosphoric acid at pH 2.0) conditions. Under both conditions, the unmodified proteins exhibit fluorescence spectra identical to the parent single-Trp variants, that is, the quasi-wild type (Trp140 SNase) and the Y27W/W140H variant (Trp27 SNase). In addition to the aromatic band at ∼280 nm, the AEDANS-labeled Trp27 variants exhibit dye absorption bands at ∼340 and 260 nm, and the Trp140/Cys64-TNB protein has a band at ∼340 nm; the absorption spectra are very similar under the native and the acid-denaturing conditions. The overlap of Trp fluorescence and dye absorbance bands between 300 and 400 nm allows energy transfer to occur from the donor (Trp) to the acceptor (AEDANS or TNB). For the quantitative analysis of the FRET efficiencies, we relied on donor quenching (tryptophan emission changes) only, which is generally more reliable than enhancement in acceptor (AEDANS) fluorescence. The Förster distance (R0) under native (R0N) and acid-denaturing (R0U) conditions was calculated on the basis of the absorption spectra of the dye-labeled proteins and the Trp fluorescence spectra of the unmodified proteins from 310 to 400 nm by using Eq. (5) (Table I and Fig. 2 and Supporting Information Fig. S1). The calculated R0 values range from 22 to 30 Å, which is comparable to donor/acceptor distances of the native state (∼20 Å) and the denatured state (∼30 Å; see below) of SNase. Therefore, these FRET pairs are excellent probes for following the conformational changes associated with SNase folding. The following factors contribute to potential errors in estimating R0 values: (i) the overlap integral can be measured only above 310 nm because of aromatic absorbance and scattering backgrounds, (ii) the assumption that donors and acceptors rotate freely (yielding an orientation factor κ2 = 2/3) may not be valid under native conditions (Trp27 and Trp140 are largely buried in the native structure).
Figure 2.

Absorption spectra of the dye-labeled proteins and Trp fluorescence spectra of the unmodified proteins. Absorption spectra of (A) Trp140/Cys64-TNB, (B) Trp27/Cys64-AED, and (C) Trp27/Cys97-AED (at 10 μM with a pathlength of 1 cm) under the native condition (∼100 mM sodium acetate at pH 5.2; black dashed lines) and the acid-denaturing condition (∼20 mM phosphoric acid at pH 2.0; gray solid lines), and Trp fluorescence spectra (dotted lines) of (A) Trp140/Cys64 SNase, (B) Trp27/Cys64 SNase, and (C) Trp27/Cys97 SNase (at 10 μM), under the native (black dotted lines) and the acid-denaturing conditions (gray dotted lines) at 15°C.
Table I.
Förster Distances Between the Pair of the Donor and Acceptor of the Three Variants of SNase Under the Acid-Denaturing (∼20 mM Phosphoric Acid at pH 2.0) and the Native (100 mM Sodium Acetate at pH 5.3) Conditions
| Trp140/Cys64 | Trp27/Cys64 | Trp27/Cys97 | |
|---|---|---|---|
| R0U (Å) | 23.4 | 22.6 | 21.7 |
| R0N (Å) | 29.8 | 21.5 | 21.1 |
Figure 3 shows kinetic traces associated with refolding of the dye-labeled and unmodified proteins induced by sixfold dilution of the acid-denatured protein (in ∼20 mM phosphoric acid at pH 2.0) with refolding buffer (100 mM sodium acetate at pH 5.3) at 15°C, resulting in a pH-jump from 2.0 to 5.2. The kinetic traces obtained from continuous-flow and stopped-flow fluorescence experiments under matching conditions (excitation wavelength at 295 nm) were combined to cover the time range from 30 μs to 20 s. The dead times of the continuous-flow and stopped-flow instruments were 30 μs and 1.4 ms, respectively. The time course of refolding in the absence of denaturant (Fig. 3) was fitted to a sum of three to five exponential functions. The apparent rate constants and relative amplitudes are listed in Table II. Figure 3 also shows the energy transfer efficiency as a function of folding time (FE(tf)), which was calculated from the kinetic traces of the dye-labeled (donor and acceptor) and unmodified (donor-only) proteins according to Eq. (4). The overall change in time-dependent FRET efficiency is significantly different for the Trp27 and the Trp140 variants. FE increases from 0.39 to 0.53 within ∼1 ms of refolding of the Trp27 variants [Fig. 3(B,C)], but increases only slightly (0.36–0.40) in the case of the Trp140/Cys64 variant [Fig. 3(A)]. Given the location of FRET pairs in these two sets of variants (Fig. 1), this observation clearly indicates that formation of the β-barrel domain precedes and is independent of the docking of the C-terminal α-helical domain. Trp140/Cys64 SNase exhibits a large increase in FE during the late stages of the folding (>100 ms) consistent with a major decrease in the average distance between helix H3 and the β-barrel domain, even after accounting for the fact that R0N is larger than R0U (Table I; see below). At the same time, the FRET pairs involving Trp27 and two different acceptors located on the opposite side of the β-barrel domain experience a decrease in FE consistent with a minor expansion of this subdomain during the late stages of folding, based on the similarity between R0N and R0U (Table I).
Figure 3.

Time dependence of fluorescence intensity and the energy transfer efficiency during the folding reactions of (A) Trp140/Cys64, (B) Trp27/Cys64, and (C) Trp27/Cys97 variants initiated by a pH-jump from 2.0 to 5.2 (∼100 mM sodium acetate at pH 5.2) at 15°C. The upper panels show the kinetic traces of the pH-induced folding reaction of the unmodified (D) and the dye-labeled (D&A) proteins. The extrapolated fluorescence intensities of unfolded states at 0 M urea based on equilibrium measurements for each variant are shown in circles. The solid lines show the kinetic traces reproduced by the kinetic modeling. Fluorescence was monitored with a combination of a 305-nm long-pass filter and a 278/366-nm band-pass filter. The lower panels show the energy transfer efficiency (FRET) during folding calculated by Eq. (4).
Table II.
Apparent Rate Constants (λi, bald) and Relative Amplitudes (Ai) of the Folding Kinetics of SNase Variants Induced by a pH-Jump from 2.0 to 5.2 at 15°C Obtained by Multiexponential Least-Squares Fitting of the Combined Continuous-Flow and Stopped-Flow Traces
| Trp140/Cys64-TNB | Trp140/Cys64 | Trp27/Cys64-AED | Trp27/Cys64 | Trp27/Cys97-AED | Trp27/Cys97 | Trp140a | Trp27a | |
|---|---|---|---|---|---|---|---|---|
| Feq | 0.72 ± 0.01 | 5.11 ± 0.01 | 0.57 ± 0.01 | 0.94 ± 0.01 | 0.48 ± 0.01 | 0.87 ± 0.01 | – | – |
| A1 | −0.019 ± 0.001 | −0.16 ± 0.01 | 0.045 ± 0.001 | −0.078 ± 0.001 | 0.12 ± 0.01 | −0.098 ± 0.001 | 0.066 ± 0.011 | 0.051 ± 0.005 |
| λ1 (s−1) | (4.3 ± 0.2) × 103 | (4.7 ± 0.2) × 103 | (5.0 ± 0.1) × 103 | (6.6 ± 0.2) × 103 | (1.6 ± 0.1) × 104 | (8.5 ± 0.2) × 103 | (1.27 ± 0.14) × 104 | (5.50 ± 0.54) × 103 |
| A2 | – | 0.12 ± 0.01 | – | −0.056 ± 0.001 | 0.056 ± 0.001 | −0.025 ± 0.001 | 0.69 ± 0.31 | 0.26 ± 0.11 |
| λ2 (s−1) | – | (2.1 ± 0.1) × 102 | – | (1.6 ± 0.1) × 102 | (1.2 ± 0.1) × 102 | (1.4 ± 0.1) × 102 | 26 ± 4 | 11 ± 2 |
| A3 | 0.16 ± 0.01 | −1.5 ± 0.1 | 0.077 ± 0.001 | 0.32 ± 0.01 | 0.060 ± 0.002 | 0.35 ± 0.01 | −2.16 ± 0.25 | 0.27 ± 0.10 |
| λ3 (s−1) | 7.3 ± 0.1 | 6.8 ± 0.1 | 6.0 ± 0.1 | 4.1 ± 0.1 | 5.3 ± 0.1 | 5.7 ± 0.1 | 11.0 ± 1.2 | 4.0 ± 1.1 |
| A4 | 0.084 ± 0.003 | −1.3 ± 0.1 | 0.040 ± 0.001 | 0.10 ± 0.01 | – | 0.050 ± 0.001 | −0.50 ± 0.06 | 0.05 ± 0.01 |
| λ4 (s−1) | 2.2 ± 0.1 | 0.40 ± 0.01 | 0.30 ± 0.01 | 0.33 ± 0.01 | – | 0.28 ± 0.01 | 2.1 ± 0.4 | 0.35 ± 0.11 |
| A5 | – | −0.80 ± 0.01 | – | – | – | – | −0.29 ± 0.03 | – |
| λ5 (s−1) | – | 0.11 ± 0.01 | – | – | – | – | 0.28 ± 0.07 | – |
Values from Ref. 1.
To gain further insight into the folding mechanism, we studied the kinetics of folding and unfolding for each SNase variant as a function of urea concentration. In refolding experiments, the acid-denatured protein was mixed with a fivefold excess of refolding buffer (100 mM sodium acetate, pH 5.3) in the presence of urea. To observe the time course of unfolding, native protein (in 100 mM sodium acetate at pH 5.3) was mixed with a fivefold excess of unfolding buffer (100 mM sodium acetate and appropriate concentration of urea at pH 5.3). Continuous-flow and stopped-flow experiments were combined to cover the complete time course of folding, whereas stopped-flow experiments were sufficient to monitor unfolding. As in pH-induced folding experiments the traces were fitted to sums of exponential functions. The unfolding traces are well represented by a single exponential function.
Figure 4 shows urea-dependence of the apparent rate constants on a logarithmic scale (chevron plot) and of kinetic amplitudes for folding and unfolding of the SNase variants. The kinetic behavior of the unmodified Trp140/Cys64 variant and its TNB derivative [Fig. 4(A)] is very similar to that of the parent protein, Trp140 SNase, whose folding mechanism has been analyzed in detail in our previous work.27,31 For the quantitative analysis of the present kinetic data, we used the mechanism shown in Scheme 1, which is a simplified version of the mechanism introduced by Maki et al.31 U and U' represent the unfolded species on the major and minor folding pathways, respectively, while I1, I2, and M are intermediates populated along the major pathway leading to the native state, N. In Scheme 1, it is assumed that U and U' are the initial observable species in refolding reactions, that is, there are no additional unresolved species accumulating within the dead time of the continuous-flow measurements under stabilizing conditions, which will be validated below. I1 is required to explain the fastest phase (λ1), which accumulates on the submillisecond time scale under stabilizing conditions. In the case of Trp140 SNase and Trp140/Cys64 SNase, the intrinsic fluorescence yield is similar for I1 and I2, which accounts for a lag phase (λ2) observed at tf ∼10 ms. While at low denaturant concentration the kinetic behavior is complex with as many as five distinct kinetic phases (labeled λ1 – λ5 in Fig. 4), a single phase, λ3, dominates the time course of folding in the unfolding transition region, indicating that this is the rate-limiting process in folding. In support of this conclusion, we note that the rate constant of unfolding decreases with decreasing urea concentration and coincides with the dominant folding phase, λ3, in the transition region. The nonlinear behavior of the folding limb of λ3 at low urea concentration observed in the case of Trp140 SNase can be attributed to I2, which accumulates before the rate-limiting step in folding.31 The curvature in the unfolding limb of the chevron plot, which is especially pronounced for Trp27 variants because of their reduced stability, is attributed to a high-energy native-like intermediate (M), as reported previously for Trp140 SNase and other variants.27,31
Figure 4.
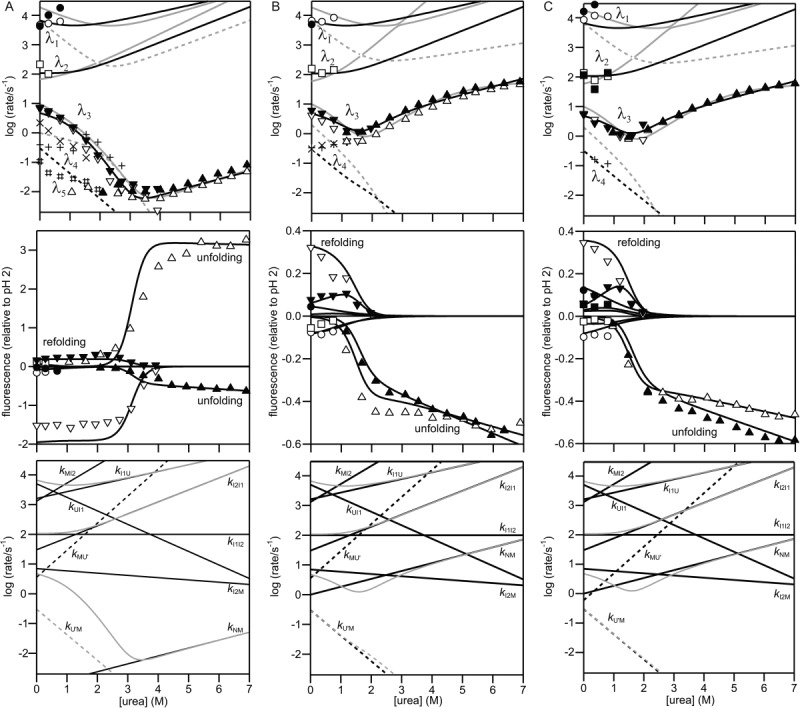
Urea-dependence of the rate constants (chevron plot; upper panels), the kinetic amplitudes (middle panels) and the elementary rate constants obtained by kinetic modeling based on Scheme 1 (lower panels) for the unmodified and the dye-labeled (A) Trp140/Cys64, (B) Trp27/Cys64, and (C) Trp27/Cys97 variants. The refolding and unfolding measurements were carried out in ∼100 mM sodium acetate at pH 5.2 and 15°C. Upper and middle panels: The open and filled symbols show the rate constants and the kinetic amplitudes of the unmodified and the dye-labeled proteins, respectively, on the major folding pathway in Scheme 1. Circles, squares, and lower triangles represent the λ1, λ2, and λ3 phases of the folding, respectively, whereas upper triangles represent the λ3 phase of the unfolding. The corresponding rate constants and kinetic amplitudes are reproduced by the kinetic modeling and shown in black solid lines. Upper panels: The + and # symbols and the × symbols show the rate constants of the unmodified and the dye-labeled proteins, respectively, on the minor folding pathways (including the phase rate-limited by the peptidyl prolyl isomerization). The rate constants reproduced by the kinetic modeling are shown in black dashed lines. Previous kinetic modeling results on Trp140 SNase (A) and Trp76 SNase (B and C) are also shown in gray lines. Lower panels: The elementary rate constants (black lines; Supporting Information Table S1) reproducing the rate constants (gray lines) are shown.
Scheme 1.

Kinetic mechanism of folding of SNase.
A secondary parallel folding pathway leading from U' to M (arrows in dashed lines in Scheme 1) is required to account for a minor slow phase, λ4, and may include additional intermediates.31 Trp140/Cys64 SNase exhibits at least one additional, largely denaturant-independent, slow phase, which could be attributed to the isomerization of proline peptide bonds;27,31,32,36 these minor processes are not considered further in this study.
Using matrix methods to solve the differential equations corresponding to Scheme 1, we were able to reproduce the urea-dependence of the observed rate constants as well as the kinetic amplitudes (Fig. 4) by adjusting the elementary rate constants and their slopes (kinetic m-values) versus urea concentration (Fig. 4 and Supporting Information Table S1). Starting with the parameters reported for Trp140 SNase,31 minor adjustments were sufficient to fit the chevron plots for Trp140/Cys64 and its TNB derivative. The chevron plots of the Trp140/Cys64 variants (Fig. 4) are consistent with that of Trp140 SNase while those of the Trp27 variants are qualitatively similar to that of F76W/W140H variant of Trp140 SNase (Trp76 SNase), another destabilized single-Trp variant.31 The primary factor that leads to the reduced stability of these proteins is the loss of interactions involving the Trp140 side chain in the native state, which results in a major increase in the observed unfolding rates (Fig. 4). On the other hand, the folding behavior at low denaturant concentrations is very similar for all variants; in every case two rapid phases (λ1 ∼ 103–104 s−1 and λ2 ∼ 102 s−1) precede the major folding phase, λ3, with a rate of ∼10 s−1, and the minor phase(s) slower than λ3 is assigned to parallel folding pathways (Scheme 1). We showed by kinetic modeling that the changes in observable kinetics associated with the destabilizing mutations can be fully accounted for by a major increase in the rate constant for the N to M unfolding transition, k0NM (by over three orders of magnitude; Fig. 4 and Supporting Information Table S1). The fact that the elementary rate constants in the folding direction remained essentially unchanged strongly suggests that the folding mechanism is conserved for all mutant and chemically modified forms of SNase studied here.
To validate our kinetic modeling procedure, we used the elementary rate constants obtained from the analysis of the chevron plots and observable amplitudes (Fig. 4 and Supporting Information Table S1) to predict the time course of folding for each variant in the absence of denaturant. After optimizing the intrinsic fluorescence yields for the different states to reproduce the urea-dependence of the observable amplitudes (Fig. 4), we were able to reproduce the observed folding traces quite well out to folding times of ∼1 s (the simplified kinetic model we use here results in systematic deviations at longer times; solid lines in Fig. 3). The intrinsic fluorescence yields of each state are listed in Supporting Information Table S2. We then used Eq. (4) to calculate the FRET efficiency for each state under native condition (∼100 mM sodium acetate, at pH 5.2 and 15°C) from the yield of the donor (Trp) in the presence and absence of acceptor (AEDANS or TNB). We also calculated the corresponding distances [Eq. (7)] using the Förster distances R0U (for U, I1, and I2) and R0N (for M and N). The similarity in the fluorescence yields among U, I1, and I2, and between M and N indicates that the tryptophan side-chains are fully solvent-exposed in U, I1, and I2 whereas they are fully native-like in M and N. Thus, R0 values appropriate to calculate the donor/acceptor distances in U, I1, and I2 and in M and N are R0U and R0N, respectively. In Figure 5, the donor/acceptor distances are plotted as a function of the α-value (see Materials and Methods section), which serves as a reaction coordinate for the folding reaction. The results provide a more quantitative view of the conclusions drawn above, namely, that the 27–64 and 27–97 probe pairs sense a contraction of the β-barrel domain at an early stage of folding (U → I1), whereas the 140-64 donor/acceptor distance significantly decreases only during the later stages as the C-terminal helix (helix H3) forms and docks onto the β-barrel.
Figure 5.
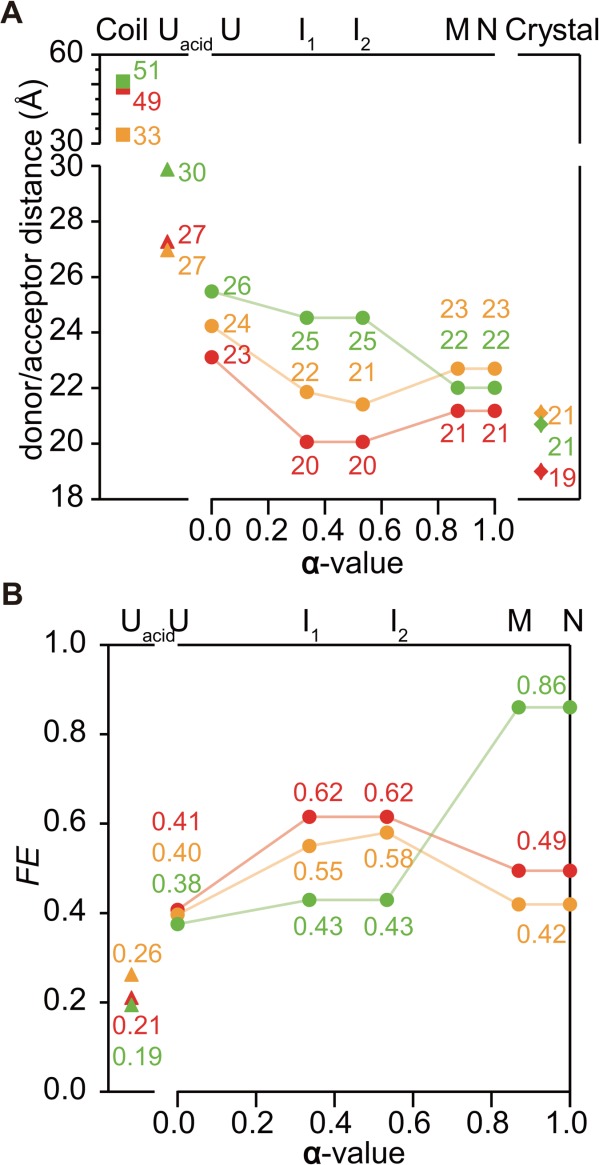
(A) donor/acceptor distances of Trp140/Cys64-TNB (green, upper), Trp27/Cys64-AED (orange, middle), and Trp27/Cys97-AED (red, lower) in each state. Squares show the distances in random coil, estimated according to Refs. 37 and 38. Triangles show the distances in the acid unfolded state. Circles show the distance changes during folding from U to N states as a function of the α-value. Diamonds show Cβ-Cβ distance of the sites in the crystal structure. (B) FRET efficiency of Trp140/Cys64-TNB (green, upper), Trp27/Cys64-AED (orange, middle), and Trp27/Cys97-AED (red, lower) in each state. Triangles show FE in the acid unfolded state. Circles show the changes in FE during folding from U to N states as a function of the α-value.
In Figure 6, the fluorescence intensities at tf = 0 and at long times, approaching equilibrium, are plotted as a function of urea concentration. The equilibrium fluorescence for the Trp27 variants and Trp140/Cys64-TNB increases while that of unmodified Trp140/Cys64 decreases with increasing urea concentration, consistent with the kinetic traces in Figure 3. The initial signal of the kinetic folding and unfolding data (extrapolated to tf = 0) is fully consistent with the fluorescence values of the native and the unfolded states at equilibrium (Fig. 3 and dashed lines in Fig. 6). Direct comparison between the equilibrium transitions and the (un)folding kinetics under identical final conditions shows no evidence for kinetically unresolved changes, which validate the assignment of the observable initial species to U and U' in the kinetic modeling described above. Two-state fits of the observed equilibrium transitions yield estimates for the thermodynamic parameters (mid-point concentrations, CM, m-values, and free energy differences, ΔGH2O, for the transitions; Supporting Information Table S3) and spectroscopic parameters (fluorescence extrapolated to zero urea concentration and the corresponding slopes of the native and the unfolded states). In some cases, the slope of the transition curves was poorly defined, and m-values were fixed to that of the parent protein, as described in Materials and Methods section. Thermodynamic parameters were also calculated from the elementary rate constants and their urea-dependence (kinetic m-values) estimated by the kinetic modeling. Supporting Information Table S3 compares the thermodynamic parameters of the Cys-containing variants studied here with the single-Trp parent proteins, Trp140, and Trp27 SNase, whose urea-induced unfolding transitions were measured under matching experimental conditions (∼100 mM sodium acetate, at pH 5.2 and 15°C), using a scanning fluorometer. As the naturally occurring Trp140 is important for the stability of the native state, the Trp27 variants are less stable than the Trp140-containing proteins.39 Although the thermodynamic parameters estimated from kinetic data are less accurate than those obtained from equilibrium measurements, the results in Supporting Information Table S3 indicate that replacement of the surface-exposed Lys at positions 64 and 97 results in only a small decrease in stability. Addition of an AEDANS group results in a small increase in stability whereas the attachment of a TNB group to Cys64 has little effect on the free energy of unfolding.
Figure 6.

Equilibrium unfolding of the unmodified (open symbols) and the dye-labeled (filled symbols) (A) Trp140/Cys64, (B) Trp27/Cys64, and (C) Trp27/Cys97 variants under matching condition of the kinetic measurements (∼100 mM sodium acetate at pH 5.2 and 15°C). Also shown are final fluorescence intensities of (un)folding kinetics in circles, initial fluorescence intensities of folding kinetics in squares, and initial fluorescence intensities of unfolding kinetics in diamonds.
In Figure 5, we plotted the FRET efficiency, FE, and donor/acceptor distance, RDA, for the acid-denatured (FEUacid and RUacid) and the native state (FEN and RN) calculated based on the fluorescence spectra (Supporting Information Fig. S1), as well as kinetic measurements and the corresponding Förster distances, R0U and R0N. Also plotted in Figure 5 are the donor/acceptor distances estimated using an unstructured polymer model (Rcoil ≅ N0.6 × 3.8 Å, where N is the number of residues separating the donor from the acceptor)37,38 and the Cβ-Cβ distance between the donor and acceptor sites measured in the crystal structure of Trp140 SNase (Rcrystal). Rcoil is larger than RUacid and the difference between RUacid and Rcoil increases with increasing distance along the sequence. This trend was found in previous studies,16 and was attributed to the residual structure in the acid-denatured state. Rcrystal is 1–2 Å smaller than RN; in addition to assumptions made in calculating a Förster distance, R0N, the uncertainty in determining the position of the bulky dye may reflect a shift in the position of the acceptor compared to that in the crystal structure.
The distance between Trp27 and the acceptors at positions 64 and 97, respectively, is within 1–2 Å of RN compared with those in the unfolded state under the native condition, RU. These donor/acceptor pairs span the β-barrel domain with Trp27 located at one end and Cys64 and Cys97 (on helix H1 and the βV-H2 loop, respectively) adjacent to the opposite end (Fig. 1). In both cases, RU is much smaller than RUacid, indicating that the β-barrel domain already adopts a compact conformation in the unfolded state found under native condition just after the drop in denaturant concentration in refolding experiments. The fact that two different probes separated by over 30 residues along the chain approach the donor to within 2 Å of the final distance is consistent with an overall compactness and arrangement of the β-strands and helix H1 resembling the native structure. The donor/acceptor distances approach native values even in I1 (tf ∼ 500 μs) and remain nearly constant throughout the folding reaction (Fig. 5). Our observation that the unmodified Trp27 variants undergo only a slight change in fluorescence in the conversion from U to I2 (Supporting Information Table S2) suggests that the Trp27 side chain is still exposed and relatively mobile in I1 and I2. This further supports our conclusion that the observed changes in FE reflect a major conformational change rather than changes in donor environment or mobility. A previous study on SNase folding probed by 1-anilinonaphthalene-8-sulfonate (ANS) binding showed that solvent-accessible hydrophobic pockets appear within ∼100 μs of refolding.31 Since there is no evidence for compact structure elsewhere in the protein (see below), we conclude that the binding site(s) for ANS are located within the β-barrel domain. Taken together, these results indicate that the β-barrel domain becomes nearly as compact as the native state and forms native-like tertiary interactions in I1.
In contrast to the Trp27 variants, the donor/acceptor distance for TNB-labeled Trp140/Cys64 SNase decreases substantially as the native state is formed (Fig. 5). The donor/acceptor distance is ∼4 Å larger in I1 than in N, whereas the corresponding distances for the Trp27 variants are very close to the native values. The Trp140/Cys64-TNB distance at the beginning of the folding reaction (under native conditions), RU = 26 Å, remains essentially constant in I1 and I2, and decreases to its native value (22 Å) in M and N. The final folding phase with a rate of ∼10 s−1 is accompanied not only by a major enhancement in Trp140 fluorescence of the unlabeled protein, but also a significant quenching of the donor in the presence of the TNB acceptor (Fig. 3) consistent with a ∼3 Å decrease in donor/acceptor distance. Taken together, the results for all three FRET pairs indicate that during the rate-limiting step of folding the C-terminal helix (helix H3) docks onto the preformed β-barrel domain. As we do not have any FRET pairs with both donor and acceptor within the α-helical domain we cannot rule out the possibility that both domains acquire some structure at an early stage and dock to each other during the rate-limiting step of folding, as reported for dihydrofolate reductase, an α/β-type protein.19
For all three donor/acceptor pairs studied, the average distance in the acid-denatured state at pH 2 is substantially larger (by at least 3 Å) than that of the unfolded state at pH 5.2, which corresponds to the kinetically observed state at the beginning of the folding reaction (based on the kinetic modeling results). The similarity among the variants indicates that under folding conditions (pH 5.2, low denaturant concentration) the polypeptide chain is uniformly more compact than under denaturing conditions (pH 2 or high urea concentration). It appears that this state, which can be considered the denatured state under native conditions, has undergone a general collapse of the chain driven by a combination of hydrophobic and electrostatic interactions. The low affinity for ANS suggests that this conformational ensemble is mobile and lacks a persistent hydrophobic core.31 In contrast, the donor/acceptor distances differ significantly among the variants in I1 populated at tf ∼ 500 μs, indicating that specific side-chain interactions are formed within the first few 100 μs of folding. If this process were a uniform compaction, one would expect similar donor/acceptor distances for the Trp27/Cys97 and Trp140/Cys64 pairs, since their separation along the chain is similar (71 and 77 residues, respective). These findings indicate that the earliest intermediate ensemble, I1, formed on the 100-μs time scale is structurally bimodal: the core structure of the β-barrel domain is formed and has native-like compactness while the C-terminal helix (helix H3) is still unfolded and/or detached; the two subdomains associate only during the final stages of folding.
Magg et al. suggested on the basis of detailed kinetic experiments that a partially collapsed state of Bacillus caldolyticus cold shock protein (Bc-Csp) represents the unfolded state under native conditions rather than a barrier-limited intermediate.13,16 Although the overall topology is different, both SNase and Bc-Csp contain a β-barrel structure, and the partially collapsed initial state might be a common feature. One possibility to consolidate these findings is that the starting conformation of SNase at tf = 0 is analogous to the compact denatured ensemble of Bc-Csp, whereas the I1 state populated on the 100-μs time scale represents a partially structured intermediate not present in the smaller cold-shock protein.
The FRET probes studied here, along with prior observations, provide qualitative information on the structural properties of the I1 intermediate. We have previously studied the microsecond folding kinetics of Trp76 SNase, an SNase variant containing a Trp at position 76,32 located at the C-terminal end of β-strand IV on the same face of the β-barrel as Trp27 (Fig. 1). The observation that the fluorescence of both Trp27 and Trp76 is partially enhanced during phase 1 (U → I1) is consistent with the assembly of a loosely packed cluster of hydrophobic side chains at one end of the β-barrel. The presence of a dynamic clustering of hydrophobic side chains is supported by the fact that ANS binds preferentially to an intermediate populated on the 100-μs time scale.31 The near-native distance for the Trp27/Cys64-AED pair suggests that helix H1 is already formed and interacting with the structured region of the I1 state. The Cys97-AED FRET probe also places the loop following strand V within the collapsed core of the intermediate. In addition, earlier H/D exchange labeling studies showed that amide protons in β-strands II and III are already protected from exchange at this early stage of folding, suggesting the presence of a hydrogen-bonded β-hairpin.28,30 Thus, the chain compaction observed here appears to encompass most of the β-barrel as well as helix H1. While the combined results are consistent with native-like topology, more detailed structural information will be needed to confirm this conclusion (e.g., we have no probes reporting on the structure of β-strand I). On the other hand, the observation that the distance between Trp140 and Cys64 remains unchanged in phase 1 (U → I1) demonstrates that helix H3 is still detached from the structural core of the I1 intermediate. The observation of a bimodal P(r) function in SAXS measurements on a C-terminally truncated SNase variant40 further supports our conclusion that an early event in SNase folding gives rise to a partially structured state with a compact β-barrel/H1 subdomain and a more disordered C-terminal region.
Materials and Methods
Site-directed mutagenesis was carried out by QuickChange (Agilent, CA). The single-Trp/Cys variants of SNase (Trp27/Cys64, Trp27/Cys97, and Trp140/Cys64 SNase) constructed were expressed and purified according to a previous report.31 Before the modification of Trp140/Cys64 SNase with TNB, 100 mM Tris-HCl/7 M urea/2 mM dithiothreitol (DTT) (pH 8.0) was purged by argon gas for 2 h to remove oxygen in the buffer, followed by addition of lyophilized Trp140/Cys64 SNase and concentrated 5,5′-dithiobis-(2-nitrobenzoic acid) solution with 157-fold molar excess to the protein. The reaction was performed in dark at room temperature for 2 h. The unmodified protein and side-reaction products were removed by ion exchange chromatography (Bio-Rex70, Bio-Rad, CA). The fractions of modified protein was dialyzed against ∼50 mM ammonium bicarbonate (pH ∼ 7), followed by lyophilization. The labeling efficiency (percent of the protein molecular labeled) was estimated by the ratio of Trp140/Cys64 SNase to TNB attached to the protein through independently determined concentrations of TNB and Trp140/Cys64 SNase. Specifically, labeled protein in Tris-HCl (pH 8.0) was reduced by ∼1 mM DTT, resulting in a mixture of free TNB and Trp140/Cys64. The concentrations were then determined spectrophotometrically by the molar extinction coefficients of free TNB35 (εTNB412 nm = 14,150 M−1 cm−1 and εTNB280 nm = 2900 M−1 cm−1) and Trp140/Cys64 SNase (εTrp140/Cys64280 nm = 14,700 M−1 cm−1). AEDANS labeling of Trp27/Cys64 and Trp27/Cys97 SNase was carried out in a similar way of TNB-labeling with minor change in the procedure. Specifically, a 100-fold molar excess of 1,5-IAEDANS was used for the modification. The labeled protein was purified by Sephadex G-50 and dialyzed against ∼50 mM ammonium bicarbonate (pH ∼ 7), followed by lyophilization. The labeling efficiency was estimated by measuring the ratio of each variant to AEDANS attached to the protein. Their concentrations were determined spectrophotometrically according to the molar extinction coefficients of free 1,5-IAEDANS34 (εAEDANS336 nm = 5700M−1 cm−1 and εAEDANS280 nm = 1310 M−1 cm−1), Trp27/Cys64 (εTrp27/Cys64280 nm = 12,700 M−1 cm−1), and Trp27/Cys97 (εTrp27/Cys97280 nm = 12,700 M−1 cm−1). The overall labeling efficiency was about 100%.
The refolding reaction was initiated by six-fold dilution of the acid-unfolded protein solution in ∼20 mM phosphoric acid (pH 2.0) with 100 mM sodium acetate (pH 5.3) with varying concentrations of urea, giving a final pH of 5.2, while the unfolding reaction was initiated by six-fold dilution of the native protein solution in 100 mM sodium acetate (pH 5.3) with 100 mM sodium acetate at (pH 5.3) with varying concentrations of urea. The solutions for the measurements on the unmodified proteins contained 2 mM DTT for keeping the proteins reduced. The protein concentration was 10 μM for all the experiments. All the experiments were conducted at 15°C. The time-dependent change in fluorescence was recorded with the combination of a 305-nm long pass filter and a 287/366-nm band pass filter with the excitation at 295 nm. The dead time of the continuous-flow device was 30 μs, which was estimated by measuring the quenching of N-acetyl-l-tryptophan fluorescence by N-bromosuccinmide.41 The stopped-flow measurements were conducted on an SX-20 (Applied Photophysics, UK) with a dead time of ∼1.4 ms. The kinetic traces were fitted by nonlinear least-squares method to the following equation:
| (1) |
where F(t) and Feq are the observed values of the fluorescence at time t and infinite time at the equilibrium, respectively, while Ai and λi are the fluorescence change (amplitude) and the apparent rate constant, respectively, of the ith kinetic phase.
Standard numeric methods were used to solve the linear differential equation system representing the folding scheme, using IGOR software (Wavemetrics, OR) to determine the eigenvalues and eigenvectors of the corresponding rate matrix. The urea concentration dependence of the elementary rate constants were assumed to follow Eq. (2):
| (2) |
where k0ij is the elementary rate constant in the absence of urea and m‡ij is the corresponding slope (kinetic m-value). R and T are the gas constant and absolute temperature, respectively. The various sets of the elementary rate constants, the slopes (kinetic m-values), and the fluorescence intensity of each state were explored systematically to model the apparent rate constants and amplitudes observed in the kinetic measurements, as well as the equilibrium thermodynamic parameters, according to the associated rate matrix. The α-value of the i-state was calculated as the summation of the kinetic m-values from U to the i-state relative to the total change in the kinetic m-values, which is a measure of the change in solvent-accessible surface area relative to U. Free energy of each state was also calculated from the elementary rate parameters obtained. The activation energy for crossing the barriers between states was calculated as follows:
| (3) |
using an arbitrary value of 1 × 10⁶ s−1 for the pre-exponential factor, A0.
The FRET efficiency, FE, was calculated using fluorescence intensity according to Eq. (4):42
| (4) |
where FD and FDA are the fluorescence intensity in the absence and presence of the accepter, respectively. The Förster distance R0 was calculated as:
| (5) |
where κ2 is the orientation factor as a function of the relative orientation of the transition dipoles of the donor and the acceptor in space, which was assumed to rotate freely (κ2 = 2/3), ΦD is the quantum yield of the donor, which was determined by estimating the fluorescence intensity relative to N-acetyl-l-tryptophanamide (NATA) assuming a quantum yield of 0.14 for NATA,43 n is the refractive index of the medium, and J is the overlap integral of the emission of the donor and the absorption of the acceptor, which was calculated by the normalized fluorescence spectrum of the protein with only donor and the absorbance spectrum of the acceptor according to Eq. (6):
| (6) |
where FD (λ) and εA (λ) are the fluorescence intensity of the donor and the extinction coefficient of the acceptor, respectively, at a wavelength, λ. The R0 values under the native and the acid-denaturing conditions (R0N and R0U, respectively) were calculated. The distance between the donor and the acceptor sites (RDA) was calculated from the FE and appropriate R0 values (R0U for U, I1, and I2 and R0N for M and N) thus obtained by the equation:
| (7) |
The equilibrium unfolding transition curves were obtained by plotting the Feq values versus urea concentrations. The baselines of the unfolded state and the native state were obtained by extrapolating the refolding and the unfolding traces to zero time. The equilibrium unfolding transition curves of the modified and unmodified variants were fitted to a two-state model using IGOR Pro software package (Wavemetrics, OR). The m-values for the Trp140 variants were fixed to the corresponding value of Trp140 SNase because of the low quality of kinetically derived equilibrium data.
Acknowledgments
The Spectroscopy Support Facility of the Fox Chase Cancer Center provided access to spectrometers.
Glossary
- AEDANS
5-(((acetylamino)ethyl)amino)naphthalene-1-sulfonate
- ANS
1-anilinonaphthalene-8-sulfonate
- Bc-Csp
Bacillus caldolyticus cold shock protein
- DTT
dithiothreitol
- FRET
fluorescence resonance energy transfer
- H/D
hydrogen/deuterium
- 1,5-IAEDANS
5-((((2-iodoacetyl)amino)ethyl)amino)naphthalene-1-sulfonate
- NATA
N-acetyl-L-tryptophanamide
- SNase
staphylococcal nuclease
- TNB
2-nitro-5-thiobenzoic acid
- Trp140 SNase
P47G/P117G/H124L variant of SNase
- Trp27 SNase
Y27W/W140H variant of Trp140 SNase
- Trp76 SNase
F76W/W140H variant of Trp140 SNase
- Trp27/Cys97 SNase
Y27W/K97C/W140H variant of Trp140 SNase
- Trp27/Cys64 SNase
Y27W/K64C/W140H variant of Trp140 SNase
- Trp140/Cys64 SNase
K64C variant of Trp140 SNase
- Trp27/Cys97-AED
Trp27/Cys97 SNase with modification with AEDANS at Cys97
- Trp27/Cys64-AED
Trp27/Cys64 SNase with modification with AEDANS at Cys64
- Trp140/Cys64-TNB
Trp140/Cys64 SNase with modification with TNB at Cys64
Supplementary material
Additional Supporting Information may be found in the online version of this article.
The fluoresecence spectra of the dye-labeled (red) and unmodified (blue) variants at pH 5.2 (A, C and E) and pH 2.0 (B, D and F). Panels A and B show the spectra of Trp 140/Cys64 SNase and TepCys64-TNB. Panels E and F show the spectra of Trp27/Cys97 SNase and Trp27/Cys97-AED.
References
- 1.Baldwin RL, Rose GD. Is protein folding hierarchic? II. Folding intermediates and transition states. Trends Biochem Sci. 1999;24:77–83. doi: 10.1016/s0968-0004(98)01345-0. [DOI] [PubMed] [Google Scholar]
- 2.Arai M, Kuwajima K. Role of the molten globule state in protein folding. Adv Protein Chem. 2000;53:209–282. doi: 10.1016/s0065-3233(00)53005-8. [DOI] [PubMed] [Google Scholar]
- 3.Roder H, Maki K, Cheng H. Early events in protein folding explored by rapid mixing methods. Chem Rev. 2006;106:1836–1861. doi: 10.1021/cr040430y. [DOI] [PMC free article] [PubMed] [Google Scholar]
- 4.Udgaonkar JB, Baldwin RL. NMR evidence for an early framework intermediate on the folding pathway of ribonuclease A. Nature. 1988;335:694–699. doi: 10.1038/335694a0. [DOI] [PubMed] [Google Scholar]
- 5.Roder H, Wüthrich K. Protein folding kinetics by combined use of rapid mixing techniques and NMR observation of individual amide protons. Proteins. 1986;1:34–42. doi: 10.1002/prot.340010107. [DOI] [PubMed] [Google Scholar]
- 6.Roder H, Elöve GA, Englander SW. Structural characterization of folding intermediates in cytochrome c by H-exchange labelling and proton NMR. Nature. 1988;335:700–704. doi: 10.1038/335700a0. [DOI] [PMC free article] [PubMed] [Google Scholar]
- 7.Miranker A, Robinson CV, Radford SE, Aplin RT, Dobson CM. Detection of transient protein folding populations by mass spectrometry. Science. 1993;262:896–899. doi: 10.1126/science.8235611. [DOI] [PubMed] [Google Scholar]
- 8.James E, Wu PG, Stites W, Brand L. Compact denatured state of a staphylococcal nuclease mutant by guanidinium as determined by resonance energy transfer. Biochemistry. 1992;31:10217–10225. doi: 10.1021/bi00157a008. [DOI] [PubMed] [Google Scholar]
- 9.Wu P, Brand L. Conformational flexibility in a staphylococcal nuclease mutant K45C from time-resolved resonance energy transfer measurements. Biochemistry. 1994;33:10457–10462. doi: 10.1021/bi00200a029. [DOI] [PubMed] [Google Scholar]
- 10.Lillo MP, Szpikowska BK, Mas MT, Sutin JD, Beechem JM. Real-time measurement of multiple intramolecular distances during protein folding reactions: a multisite stopped-flow fluorescence energy-transfer study of yeast phosphoglycerate kinase. Biochemistry. 1997;36:11273–11281. doi: 10.1021/bi970789z. [DOI] [PubMed] [Google Scholar]
- 11.Ratner V, Sinev M, Haas E. Determination of intramolecular distance distribution during protein folding on the millisecond timescale. J Mol Biol. 2000;299:1363–1371. doi: 10.1006/jmbi.2000.3814. [DOI] [PubMed] [Google Scholar]
- 12.Navon A, Ittah V, Landsman P, Scheraga HA, Haas E. Distributions of intramolecular distances in the reduced and denatured states of bovine pancreatic ribonuclease A. Folding initiation structures in the C-terminal portions of the reduced protein. Biochemistry. 2001;40:105–118. doi: 10.1021/bi001946o. [DOI] [PubMed] [Google Scholar]
- 13.Magg C, Schmid FX. Rapid collapse precedes the fast two-state folding of the cold shock protein. J Mol Biol. 2004;335:1309–1323. doi: 10.1016/j.jmb.2003.11.050. [DOI] [PubMed] [Google Scholar]
- 14.Sinha KK, Udgaonkar JB. Dependence of the size of the initially collapsed form during the refolding of barstar on denaturant concentration: evidence for a continuous transition. J Mol Biol. 2005;353:704–718. doi: 10.1016/j.jmb.2005.08.056. [DOI] [PubMed] [Google Scholar]
- 15.Teilum K, Maki K, Kragelund BB, Poulsen FM, Roder H. Early kinetic intermediate in the folding of acyl-CoA binding protein detected by fluorescence labeling and ultrarapid mixing. Proc Natl Acad Sci USA. 2002;99:9807–9812. doi: 10.1073/pnas.152321499. [DOI] [PMC free article] [PubMed] [Google Scholar]
- 16.Magg C, Kubelka J, Holtermann G, Haas E, Schmid FX. Specificity of the initial collapse in the folding of the cold shock protein. J Mol Biol. 2006;360:1067–1080. doi: 10.1016/j.jmb.2006.05.073. [DOI] [PubMed] [Google Scholar]
- 17.Bilsel O, Matthews CR. Molecular dimensions and their distributions in early folding intermediates. Curr Opin Struct Biol. 2006;16:86–93. doi: 10.1016/j.sbi.2006.01.007. [DOI] [PubMed] [Google Scholar]
- 18.Orevi T, Ben Ishay E, Pirchi M, Jacob MH, Amir D, Haas E. Early closure of a long loop in the refolding of adenylate kinase: a possible key role of non-local interactions in the initial folding steps. J Mol Biol. 2009;385:1230–1242. doi: 10.1016/j.jmb.2008.10.077. [DOI] [PubMed] [Google Scholar]
- 19.Arai M, Iwakura M, Matthews CR, Bilsel O. Microsecond subdomain folding in dihydrofolate reductase. J Mol Biol. 2011;410:329–342. doi: 10.1016/j.jmb.2011.04.057. [DOI] [PubMed] [Google Scholar]
- 20.Shastry MCR, Roder H. Evidence for barrier-limited protein folding kinetics on the microsecond time scale. Nat Struct Biol. 1998;5:385–392. doi: 10.1038/nsb0598-385. [DOI] [PubMed] [Google Scholar]
- 21.Hagen SJ, Eaton WA. Two-state expansion and collapse of a polypeptide. J Mol Biol. 2000;297:781–789. doi: 10.1006/jmbi.2000.3508. [DOI] [PubMed] [Google Scholar]
- 22.Akiyama S, Takahashi S, Kimura T, Ishimori K, Morishima I, Nishikawa Y, Fujisawa T. Conformational landscape of cytochrome c folding studied by microsecond-resolved small-angle x-ray scattering. Proc Natl Acad Sci USA. 2002;99:1329–1334. doi: 10.1073/pnas.012458999. [DOI] [PMC free article] [PubMed] [Google Scholar]
- 23.Uzawa T, Akiyama S, Kimura T, Takahashi S, Ishimori K, Morishima I, Fujisawa T. Collapse and search dynamics of apomyoglobin folding revealed by submillisecond observations of α-helical content and compactness. Proc Natl Acad Sci USA. 2004;101:1171–1176. doi: 10.1073/pnas.0305376101. [DOI] [PMC free article] [PubMed] [Google Scholar]
- 24.Truckses DM, Somoza JR, Prehoda KE, Miller SC, Markley JL. Coupling between trans/cis proline isomerization and protein stability in staphylococcal nuclease. Protein Sci. 1996;5:1907–1916. doi: 10.1002/pro.5560050917. [DOI] [PMC free article] [PubMed] [Google Scholar]
- 25.Schechter AN, Chen RF, Anfinsen CB. Kinetics of folding of staphylococcal nuclease. Science. 1970;167:886–887. doi: 10.1126/science.167.3919.886. [DOI] [PubMed] [Google Scholar]
- 26.Sugawara T, Kuwajima K, Sugai S. Folding of staphylococcal nuclease A studied by equilibrium and kinetic circular dichroism spectra. Biochemistry. 1991;30:2698–2706. doi: 10.1021/bi00224a018. [DOI] [PubMed] [Google Scholar]
- 27.Walkenhorst WF, Green SM, Roder H. Kinetic evidence for folding and unfolding intermediates in Staphylococcal nuclease. Biochemistry. 1997;63:5795–5805. doi: 10.1021/bi9700476. [DOI] [PubMed] [Google Scholar]
- 28.Jacobs MD, Fox RO. Staphylococcal nuclease folding intermediate characterized by hydrogen exchange and NMR spectroscopy. Proc Natl Acad Sci USA. 1994;91:449–453. doi: 10.1073/pnas.91.2.449. [DOI] [PMC free article] [PubMed] [Google Scholar]
- 29.Ikura T, Tsurupa GP, Kuwajima K. Kinetic folding and cis/trans prolyl isomerization of staphylococcal nuclease. A study by stopped-flow absorption, stopped-flow circular dichroism, and molecular dynamics simulations. Biochemistry. 1997;36:6529–6538. doi: 10.1021/bi963174v. [DOI] [PubMed] [Google Scholar]
- 30.Walkenhorst WF, Edwards JA, Markley JL, Roder H. Early formation of a beta hairpin during folding of staphylococcal nuclease H124L as detected by pulsed hydrogen exchange. Protein Sci. 2002;11:82–91. doi: 10.1110/ps.28202. [DOI] [PMC free article] [PubMed] [Google Scholar]
- 31.Maki K, Cheng H, Dolgikh DA, Shastry MC, Roder H. Early events during folding of wild-type staphylococcal nuclease and a single-tryptophan variant studied by ultrarapid mixing. J Mol Biol. 2004;338:383–400. doi: 10.1016/j.jmb.2004.02.044. [DOI] [PubMed] [Google Scholar]
- 32.Maki K, Cheng H, Dolgikh DA, Roder H. Folding kinetics of staphylococcal nuclease studied by tryptophan engineering and rapid mixing methods. J Mol Biol. 2007;368:244–255. doi: 10.1016/j.jmb.2007.02.006. [DOI] [PMC free article] [PubMed] [Google Scholar]
- 33.Shastry MCR, Luck SD, Roder H. A continuous-flow capillary mixing method to monitor reactions on the microsecond time scale. Biophys J. 1998;74:2714–2721. doi: 10.1016/S0006-3495(98)77977-9. [DOI] [PMC free article] [PubMed] [Google Scholar]
- 34.Hudson EN, Weber G. Synthesis and characterization of two fluorescent sulfhydryl reagents. Biochemistry. 1973;12:4154–4161. doi: 10.1021/bi00745a019. [DOI] [PubMed] [Google Scholar]
- 35.Riddles PW, Blakeley RL, Zerner B. Ellman's reagent:5,5'-dithiobis(2-nitrobenzoic acid)—a reexamination. Anal Biochem. 1979;94:75–81. doi: 10.1016/0003-2697(79)90792-9. [DOI] [PubMed] [Google Scholar]
- 36.Maki K, Ikura T, Hayano T, Takahashi N, Kuwajima K. Effects of proline mutations on the folding of staphylococcal nuclease. Biochemistry. 1999;38:2213–2223. doi: 10.1021/bi981962+. [DOI] [PubMed] [Google Scholar]
- 37.Kato S, Kamikubo H, Hirano S, Yamazaki Y, Kataoka M. Nonlocal interactions are responsible for tertiary structure formation in staphylococcal nuclease. Biophys J. 2010;98:678–686. doi: 10.1016/j.bpj.2009.10.048. [DOI] [PMC free article] [PubMed] [Google Scholar]
- 38.Edwards SF. The statistical mechanics of polymers with excluded volume. Proc Phys Soc. 1965;85:613–624. [Google Scholar]
- 39.Goldenberg DP. Computational simulation of the statistical properties of unfolded proteins. J Mol Biol. 2003;326:1615–1633. doi: 10.1016/s0022-2836(03)00033-0. [DOI] [PubMed] [Google Scholar]
- 40.Flanagan JM, Kataoka M, Shortle D, Engelman DM. Truncated staphylococcal nuclease is compact but disordered. Proc Natl Acad Sci USA. 1992;89:748–752. doi: 10.1073/pnas.89.2.748. [DOI] [PMC free article] [PubMed] [Google Scholar]
- 41.Peterman BF. Measurement of the dead time of a fluorescence stopped-flow instrument. Analytical Biochemistry. 1979;93:442–444. doi: 10.1016/s0003-2697(79)80176-1. [DOI] [PubMed] [Google Scholar]
- 42.Lakowicz JR. Principles of fluorescence spectroscopy. New York: Springer; 2006. [Google Scholar]
- 43.Eftink MR, Jia Y, Hu D, Ghiron CA. Fluorescence studies with tryptophan analogues: excited state interactions involving the side chain amino group. J Phys Chem. 1995;99:5713–5723. [Google Scholar]
Associated Data
This section collects any data citations, data availability statements, or supplementary materials included in this article.