Abstract
The ability of glioma cells to escape the immune system remains a significant barrier to successful immunotherapy. Here we demonstrate that loss of the PTEN tumor suppressor gene, with associated activation of the PI3K/Akt/mTOR pathway, leads to a human glioma phenotype that induces autologous T-cell apoptosis upon contact. The PTEN status of pathologically confirmed glioblastoma specimens was defined, and primary cultures established after surgical resection of tumor from 26 patients. Autologous T-cells were isolated from these patients, and after T-cell activation was induced, these cells were co-cultured with matched autologous glioma cells, either alone, or after treatment with one of three inhibitors of the PI3K/Akt/mTOR pathway. When co-cultured with autologous T-cells, PTEN wild-type tumor cells induced apoptosis in a minimal number of activated T-cells (6–12% of T-cells), whereas tumors with PTEN loss induced much more profound levels of T-cell apoptosis (42–56% of T-cells). Prior treatment of PTEN-deficient tumor cells with specific inhibitors of the PI3K/Akt/mTOR pathway diminished T-cell apoptosis to levels seen after co-culture with wild-type PTEN tumor cells, suggesting that PTEN loss confers this immunoresistant phenotype through the PI3K/Akt/mTOR pathway. These results suggest that PTEN-deficient glioblastoma patients are suboptimal candidates for immunotherapy. In addition, our results raise the possibility of combining T-cell based immunotherapy protocols with clinical inhibitors of the PI3K/Akt/mTOR pathway.
Keywords: Akt, Immunoresistance, PI3K, PTEN tumor suppressor gene
1. Introduction
Glioblastoma multiforme is a notoriously immunoresistant tumor that serves as a model for the immunoediting hypothesis particularly within the context of T-cell based immunotherapy trials.1 Immunoediting is a concept that describes the immune system’s role in the control of developing cancer in three sequential stages.1 The first stage, the elimination phase, represents the traditional concept of immunosurveillance in which the immune system suppresses tumor growth through recognition and destruction of tumor cells.1–4 The second stage, the equilibrium phase, occurs when a tumor cell population acquires a mechanism that allows it to evade immunosurveillance, and establishes a viable population that is kept in check by the immune system. During this period a rapidly mutating tumor cell population is sculpted by the immune system to select a progressively immunoresistant phenotype. 1–4 The final stage, the escape phase, occurs when a tumor cell population is no longer restrained by the immune system, and becomes clinically detectable.
We have previously shown that loss of the tumor suppressor PTEN results in a glioma phenotype that is resistant to killing by antigen-specific, genetically engineered alloreactive T-cells, in part due to aberrant expression of the immunoresistant protein B7-H1.3,5–8 In this study, we provide evidence demonstrating the clinical applicability of these findings using specimens from glioblastoma patients matched with the patient’s own autologous peripheral blood lymphocytes (PBL). Specifically, we show that when co-cultured with autologous T-cells, PTEN wild-type tumors cause a minimal low level of T-cell apoptosis, whereas tumors with PTEN loss induced significant levels of T-cell apoptosis. Prior treatment of PTEN-deficient tumors with specific inhibitors of the PI3K/Akt/mTOR pathway diminished T-cell apoptosis to levels seen after co-culture with wild-type PTEN tumor. In essence, we demonstrate that PTEN loss confers immunoresistance, mechanistically linked to the PI3K/Akt/mTOR pathway, providing a potential therapeutic avenue for clinical optimization of immunotherapy.
2. Methods
2.1. Glioma cell isolation
Primary human glioblastoma cell lines were derived from tumor samples that were resected from patients treated at the University of California at San Francisco (UCSF) Medical Center, with the approval of the UCSF Medical Center Institutional Review Board and Committee on Human Research. Of note, none of these patients received dexamethasone prior to tissue harvest or blood collection. Glioma cells were isolated by mechanical and enzymatic dissociation, followed by density separation using a Percoll gradient (Sigma-Aldrich; St Louis, MO, USA). In short, glioma tissue was mechanically dissociated using a razor blade, and placed in 5 mL of T-cell media containing 1 mg/mL collagenase for 1–2 hours. This mixture was then added to 25 mL of T-cell media and centrifuged for 8 minutes at 675g. The pellet was then resuspended in 5 mL of 70% Percoll, which was then overlayed with 5 mL of 37% Percoll, followed by a 5 mL overlay of 30% Percoll. This was centrifuged for 20 minutes at 720g. The glioma cell fraction was then isolated from the interface between the first and second layers of this gradient.
Twenty-six different glioblastoma multiforme lines were established and cultured in RPMI-1640 (Invitrogen-Gibco; Carlsbad, CA, USA) with 25M Hepes and 2.0 g/L NaHCO3, with 25% fetal bovine serum (FBS), 1% penicillin–streptomycin, 1 mM sodium pyruvate, and 10 mM non-essential amino acids. These isolated cells could be demonstrated to be glioma cells, as opposed to neurons or contaminating astrocytes, because we were able to establish primary cell lines with these isolates, which stain with astrocytic lineage markers, and have a large nuclear to cytoplasmic ratio suggestive of neoplastic cells (Fig. 1). Further, based on our experience, we have found that stromal cells and endothelial cells typically do not adhere under these conditions, and are lost after the initial passage
Fig. 1.
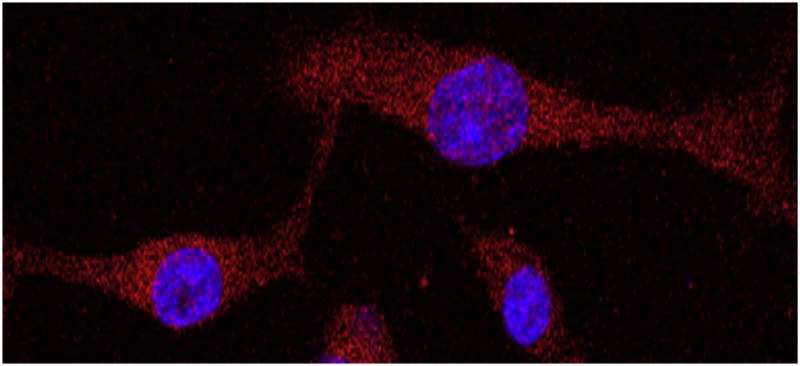
Representative immunocytochemical image of isolated primary cell lines demonstrating that these cultures are glioma cells. Nuclei are stained with 4,6′-diamidino-2-phenylindole (blue) and cells with glial fibrillary acidic protein (GFAP) (red) and imaged using confocal microscopy at (×40) magnification. The large nuclear to cytoplasmic ratio suggests that these cells are neoplastic, and the lack of GFAP-negative cells suggests that these are not neurons in culture. (This figure is available in colour at www.sciencedirect.com)
2.2. Isolation of autologous T-cells
Peripheral blood lymphocytes (PBL) were isolated from the whole blood of patients collected at the time of surgery by density gradient using Ficoll-Paque (GE HealthCare; Piscataway, NJ, USA). This was performed by adding 38 mL of whole blood collected in heparized tubes over the top of 12 mL of Ficoll-Paque, then centrifuging for 20 minutes at 900g. The PBL layer was then harvested from the interface between the top and middle layers of the gradient.
T-cells were isolated from the population of PBL using the CD3 Human T-cell Enrichment Kit (StemCell Technologies; Vancouver, Canada). In short, we prepared a mononuclear cell suspension at a concentration of 5 × 10⁷ cells/mL, and placed in a 5 mL (12 × 75 mm) polystyrene tube to fit into the Purple EasySep® Magnet (StemCell Technologies). Cells were then placed in Cell Enrichment Cocktail (StemCell Technologies) at 50 μL/mL cells, mixed well and incubated at room temperature for 10 minutes. This mixture purifies T-cells with negative selection using a mixture of antibodies bound in bispecific Tetrameric Antibody Complexes (TAC) that are directed against cell surface antigens on human blood cells (CD14, CD16, CD19, CD20, CD36, CD56, CD123, glycophorin A) and dextran. The mouse monoclonal antibody subclass is Immunoglobulin G1 (IgG1). They were then mixed with 100 μL of Magnetic Nanoparticles (StemCell Technologies) by vigorously pipetting more than five times, and incubated at room temperature for 10 minutes. The tube was then placed into the provided magnet, and set aside for 5 minutes. The desired fraction was then poured into a new 5 mL polystyrene tubes. The negatively selected, enriched cells in the new tubes were then used in T-cell experiments.
2.3. T-cell–glioma cell co-culture experiments
After isolation, glioma cells were initially grown as a primary culture until 70% confluent. T-cells were cultured in the complete T-cell medium containing RPMI–1640 25M Hepes and 2.0 g/L NaHCO3, with 10% FBS, 1% penicillin–streptomycin, 1 mM sodium pyruvate, 10 mM non-essential amino acids, and expanded by stimulation with anti-CD3 (2 mg/mL) and anti-CD28 (5 mg/mL) antibodies (eBioscience; San Diego, CA, USA). Once confluent, glioma cells were subjected to the experimental conditions described below. After washing out the pre-incubated small molecule inhibitor with medium, autologous T-cells were added to the culture dish, and these cells were co-incubated for 24 hours. Following this co-incubation, cells were harvested and stained as described below, with T-cells in this mixed cell population differentiated from glioma cells using CD45 staining.
2.4. Inhibition of the PI3K/Akt/mTOR pathway
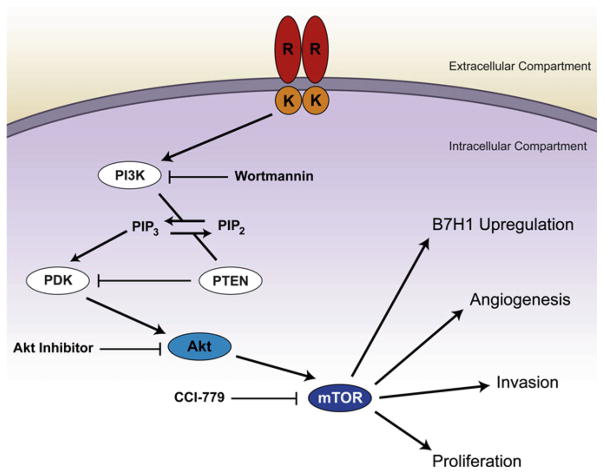
Glioma cells were treated with one of the following three inhibitors of the PI3K/Akt/mTOR pathway for 48 hours: (i) wortmannin at a final concentration of 100 μM (Calbiochem; San Diego, CA, USA), AKT inhibitor III (AKT III) at a final concentration of 50 μM (Calbiochem), and CCI-779 at a final concentration of 10 μM (Wyeth-Ayerst Laboratories; Pearl River, NY, USA). Accordingly, different steps of the PI3K/Akt/mTOR pathway were targeted as follows: PI3K by wortmannin, Akt by AKT III, and mTOR by CCI-779. These cells were washed three times in media prior to subsequent co-culturing with T-cells to limit inhibition of this pathway to glioma cells.
2.5. Immunohistochemistry
Immunohistochemistry was performed at the Department of Pathology, UCSF, and analyzed by an experienced neuropathologist. Hematoxylin and eosin and PTEN stains were performed on paraffin blocks of tumor samples processed on BenchMark XT (Ventana Medical Systems; Tucson, AZ, USA). Rabbit anti-human PTEN antibody (Cell Signaling; Danvers, MA, USA) was used at 1:100 dilution. The average percentage of tumors cells with positivity to PTEN stain was measured in three high powered fields per patient to categorize tumors into the four widely accepted PTEN score categories: 0–25%, 26–50%, 51–75%, and 76–100%2 (Table 1).
Table 1.
PTEN staining of tumor cells (measured in three high-powered fields) of the 26 patients included in this study
| PTEN staining (%) | No. patients |
|---|---|
| 0–25 | 6 |
| 26–50 | 6 |
| 51–75 | 5 |
| 76–100 | 9 |
2.6. Immunocytochemistry
Cells (3000) were plated in an eight-well poly-D-lysine coated culture slide (BD Biosciences; San Jose, CA, USA) in growth media and allowed to adhere overnight at 37 °C. Subsequently, the media was aspirated and the cells were placed on ice and washed with cold phosphate-buffered saline (PBS) twice for 5 minutes. The cells were then fixed in 4% paraformaldehyde for 15 minutes at room temperature. Cells were washed again in cold PBS twice for 5 minutes. Cells were then permeabilized with PBS containing 0.5% saponin (w/v) for 10 minutes, and then washed in cold PBS twice for 5 minutes. Cells were blocked in 10% donkey serum in PBS with 0.05% Tween and 0.3 M glycine for 10 minutes at room temperature. Subsequently, cells were incubated overnight in a humidified chamber at 4 °C in primary antibody rabbit-anti human glial fibrillary acidic protein (GFAP) (Dako; Glostrup, Denmark) at 1:500 in 10% FBS in PBS. Cells were then washed with cold 10% FBS in PBS three times for 5 minutes each, and then incubated in a humidified chamber in the dark at room temperature for 1 hour in secondary antibody AlexaFluor 568 donkey anti-rabbit (Invitrogen-Gibco) at 1:375 in 10% FBS in PBS. Cells were then washed with 10% FBS in PBS three times for 5 minutes each in the dark and then once with PBS. The slide chambers were removed and the coverslip was mounted and sealed with 200 μL of Vectashield containing 4,6′-diamidino-2-phenylindole (DAPI) counterstain (Vector Laboratories; Burlingame, CA, USA) and the slides were kept at 4 °C in the dark. Cells were imaged on a Zeiss LSM 510 confocal microscope (Carl Zeiss MicroImaging; Jena, Germany). Images were exported as JPEG files and processed in Adobe Photoshop CS (Creative Suite) (Adobe Systems; San Jose, CA, USA).
2.7. Flow cytometry
Samples from co-cultures were stained for flow cytometry with allophycocyanin (APC)-conjugated anti-CD45 antibody (eBioscience) and PE-Annexin-V (BD Biosciences). In short, cells were harvested and first stained with PE-Annexin-V in Annexin Binding Buffer for 10 minutes at room temperature. The cells were then pelleted and washed in 2% bovine serum albumin (BSA) in PBS. They then were incubated with the APC-conjugated anti-CD45 antibody for 25 minutes on ice in the dark. The cells were then washed three times in 2% BSA in PBS followed centrifugation for 8 minutes at 720g. Flow cytometry data were gathered on BD FACSCaliber Flow Cytometer using the CellQuest Pro software (BD Biosciences), and analyzed with the FlowJo software (Treestar, Ashland, OR, USA). Appropriate controls (negative isotype controls, unstained cells, unconjugated Annexin-V) and compensation were analyzed to optimize the experiments prior to data analysis.
Tumor cells treated with or without PI3K/Akt/mTOR pathway inhibitors were plated at 1 × 10⁵ cells/mL and allowed to adhere; next, stimulated autologous T-cells were added to the same patient’s tumor cells (at a ratio of 1:1). Cells were co-cultured for 18 hours, and prepared for flow cytometric analysis. As a positive control for apoptosis, cells treated with 1 μM staurosporine, a non-specific kinase inhibitor (Sigma-Aldrich) were used.
During flow cytometric analysis, cell viability was monitored by gating on cell size and granularity, and counting of cells that were CD45 positive, but Annexin V negative.
2.8. Statistical analysis
To compare two samples, the 2-tailed Student’s t-test was used with statistical significance at p < 0.05. For multiple comparisons, analysis of variance (ANOVA) was used, with multiple between-group post-hoc comparisons made with Tukey’s test, when relevant. Significance levels for multiple comparison tests were adjusted using the Bonferroni correction. Data for figures were collected from independent experiments performed in triplicate. Error bars represent standard deviation, unless otherwise stated.
3. Results
3.1. PTEN loss in glioma patients correlates with the apoptosis of autologous T-cells
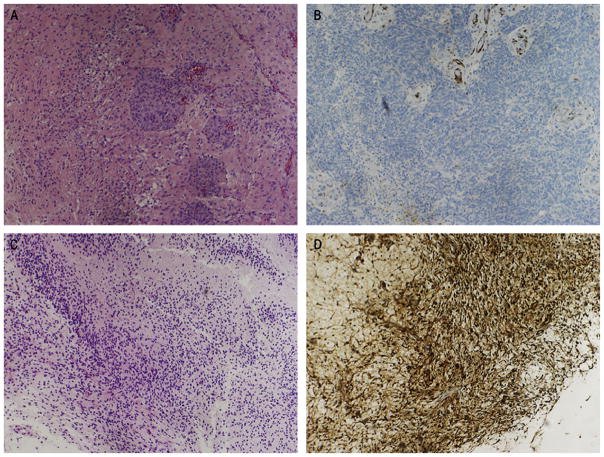
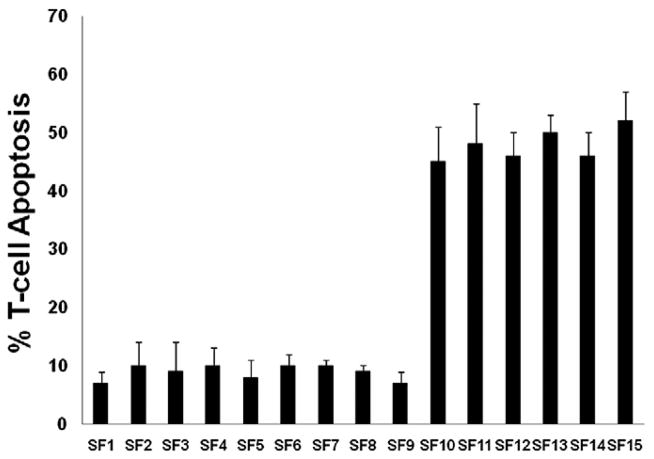
We screened tumor specimens for PTEN status taken from 26 patients undergoing primary resection of glioma prior to any additional therapy (Fig. 2). Six of 26 patients had tumors that demonstrated loss of PTEN, and nine patients had tumors that were graded as possessing levels of PTEN expression in the highest quartile of expression (Table 1).2 PBL were harvested from each of the 15 patients, and autologous T-cells were isolated. They were then activated with the non-specific agent ConA, and co-cultured at a 1:1 ratio with matched glioma cells harvested from the same patient. The apoptosis of CD3+ cells in the PBL population was then evaluated, and a comparison of the two patient populations revealed that the mean number of activated CD3+ cells that underwent apoptosis when exposed to autologous glioma cells ranged from 6% to 12% in patients with PTEN wild-type tumors compared to 42% to 56% of activated CD3+ cells (p < 0.01) in the PTEN-deficient patient population (Fig. 3).
Fig. 2.
(A, C) Representative hematoxylin and eosin and (B, D) immunohistochemical staining for PTEN status demonstrating (A, B) a PTEN-deleted tumor and (C, D) a high PTEN-expressing wild-type tumor (×10). (This figure is available in colour at www.sciencedirect.com)
Fig. 3.
Bar graphs depicting the fraction of activated T-cells undergoing apoptosis following exposure to autologous glioma cells. Each bar represents the mean and standard deviation for combined results from several trials using cells from an individual patient. Patients SF1 to SF9 had PTEN wild-type tumors, while patients SF10 to SF15 had PTEN-deficient tumors.
3.2. Apoptosis of autologous human CD3+ PBL is reversible with inhibition of the PI3K/Akt pathway
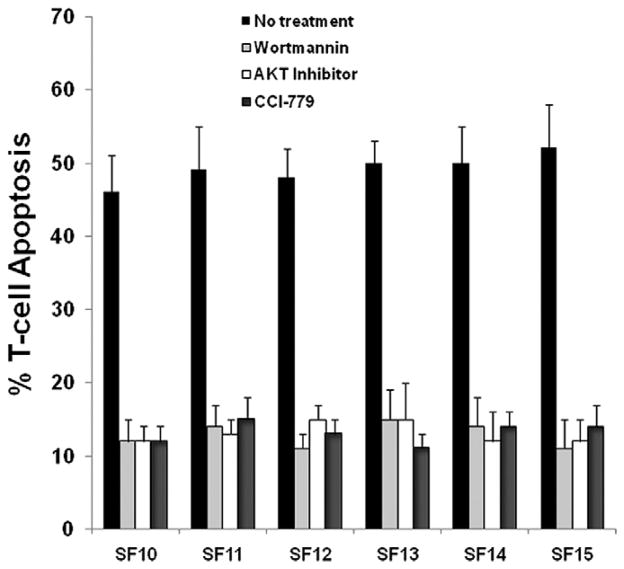
Given the large increase in T-cell apoptosis witnessed in the patient population with PTEN loss, we elected to selectively inhibit the PI3K/AKT/mTOR pathway to evaluate for reversibility. We employed three inhibitors targeted at molecular elements downstream of PTEN in the PI3K/AKT signaling cascade (Fig. 4). To assess specificity we utilized wortmannin, an inhibitor of PI3K, a direct AKT inhibitor, and CCI-779, an inhibitor of mTOR. Inhibition with wortmannin, AKT III, and CCI-779 all reduced the mean fraction of activated T-cells undergoing apoptosis after exposure to autologous glioma cells to 12%–16% of cells tested compared to 42%–56% of T-cells (ANOVA; p < 0.01) in the untreated baseline PTEN-deleted cell population (Fig. 5). Within-patient rates of T-cell apoptosis (Fig. 5) were statistically similar for samples treated with different PI3K/Akt/mTOR inhibitors, which strongly suggests that these molecules work in a common and necessary causal pathway to confer immunoresistance in PTEN-deficient cells.
Fig. 4.
Diagram depicting the PI3K/Akt/mTOR pathway and indicating the mechanism of pathway inhibition utilized in this study. (This figure is available in colour at www.sciencedirect.com)
Fig. 5.
Bar graphs depicting fraction of activated T-cells undergoing apoptosis following exposure to autologous glioma cells in the six patients with PTEN deficient tumors. Each bar represents the mean and standard deviation for combined results from several trials using cells from an individual patient exposed to one of four conditions (left to right): (i) either no treatment (black bar); (ii) PI3K inhibition with wortmannin (light gray bar); (iii) Akt inhibition with Akt III (white bar); or (iv) mTOR inhibition with CCI-779 (dark gray bar). Treatment with any of the three inhibitors caused a significant decrease in activated T-cell apoptosis compared to no treatment. All three inhibitors decreased T-cell apoptosis in all six patients equally.
4. Discussion
In this study, we correlate an oncogenic event commonly associated with the molecular pathogenesis of malignant gliomas with the induction of T cell apoptosis in a cohort of patients who have recently undergone surgical resection of a malignant glioma. The group of patients with PTEN loss demonstrated a marked increase in autologous T cell apoptosis that was absent in the group with intact PTEN function. This increase in autologous T cell apoptosis was reversible with inhibition of three different downstream components of the PI3K/AKT/mTOR pathway. All of the patients were undergoing initial resection, and had no potentially confounding medical, radiation, or surgical treatments prior to their initial surgery. Accordingly the primary cultures established are an accurate representation of intracranial pathology, as opposed to treatment effect.
Currently, there are no widely accepted standards regarding entry into immunotherapy trials based on the presence or absence of immunoresistant tumor cell phenotypes.2,5–13 Based on this work, and previous efforts with other tumor types, we suggest that perhaps inclusion of patients with an immunoresistant phenotype may have contributed to the lack of overall clinical benefit seen in some trials.14 This possibility is further supported by one-third of patients in this cohort demonstrating evidence of immunoresistance, and, if recognized, this could be modulated using pharmacologic agents. In previous work, we have demonstrated the potential for chemotherapeutic modulation of some of these immunoresistance mechanisms, without significantly impacting T-cell function, 3 which represents one approach to potentially augment immunotherapy. The exact mechanisms of glioma immunoresistance in PTEN-deficient tumors have not been exhaustively evaluated; however, our previous work has linked this immunoresistance in part to alterations of post-transcriptional regulation of the immunoresistance protein B7-H1 caused by PTEN loss.8 While in vivo proof of the impact of PTEN-deficiency on immunoresistance is lacking, we are evaluating the impact of PTEN status on response to immunotherapy in recurrent glioma patients being treated with an autologous vaccine (as part of an National Institutes of Health-funded study). The data shown in this paper hopefully will provide the impetus for other investigators to evaluate their results in a similar manner.
Glioma immunotherapies continue to evolve; however, an effective clinical benefit has yet to be consistently demonstrated for T-cell based therapies.14 The discordance between peripheral anti-tumor immunity and clear clinical benefit may be due to the variable presence of immunoresistant clonal populations within some tumors. Our results suggest that PTEN-deficient glioblastoma patients are suboptimal candidates for immunotherapy. In addition, our results raise the possibility of combining T-cell based immunotherapy protocols with clinical inhibitors of the PI3K/ Akt/mTOR pathway.4,12,13
Acknowledgments
This work was funded in part by NIH NRSA NCI F32 CA126307-01A1, UCSF Brain SPORE: Project 5: 2P50 CA097257-06.
References
- 1.Dunn GP, Bruce AT, Ikeda H, et al. Cancer immunoediting: from immunosurveillance to tumor escape. Nat Immunol. 2002;3:991–8. doi: 10.1038/ni1102-991. [DOI] [PubMed] [Google Scholar]
- 2.Baeza N, Weller M, Yonekawa Y, et al. PTEN methylation and expression in glioblastomas. Acta Neuropathol. 2003;106:479–85. doi: 10.1007/s00401-003-0748-4. [DOI] [PubMed] [Google Scholar]
- 3.Crane C, Panner A, Pieper RO, et al. Honokiol-mediated inhibition of PI3K/mTOR pathway: a potential strategy to overcome immunoresistance in glioma, breast, and prostate carcinoma without impacting T cell function. J Immunother. 2009;32:585–92. doi: 10.1097/CJI.0b013e3181a8efe6. [DOI] [PMC free article] [PubMed] [Google Scholar]
- 4.Yang I, Kremen TJ, Giovannone AJ, et al. Modulation of major histocompatibility complex Class I molecules and major histocompatibility complex-bound immunogenic peptides induced by interferon-alpha and interferon-gamma treatment of human glioblastoma multiforme. J Neurosurg. 2004;100:310–9. doi: 10.3171/jns.2004.100.2.0310. [DOI] [PubMed] [Google Scholar]
- 5.Dong H, Chen L. B7–H1 pathway and its role in the evasion of tumor immunity. J Mol Med. 2003;81:281–7. doi: 10.1007/s00109-003-0430-2. [DOI] [PubMed] [Google Scholar]
- 6.Dong H, Strome SE, Salomao DR, et al. Tumor-associated B7–H1 promotes T-cell apoptosis: a potential mechanism of immune evasion. Nat Med. 2002;8:793–800. doi: 10.1038/nm730. [DOI] [PubMed] [Google Scholar]
- 7.Dong H, Zhu G, Tamada K, et al. B7–H1, a third member of the B7 family, co-stimulates T-cell proliferation and interleukin-10 secretion. Nat Med. 1999;5:1365–9. doi: 10.1038/70932. [DOI] [PubMed] [Google Scholar]
- 8.Parsa AT, Waldron JS, Panner A, et al. Loss of tumor suppressor PTEN function increases B7–H1 expression and immunoresistance in glioma. Nat Med. 2007;13:84–8. doi: 10.1038/nm1517. [DOI] [PubMed] [Google Scholar]
- 9.Saudemont A, Quesnel B. In a model of tumor dormancy, long-term persistent leukemic cells have increased B7–H1 and B7. 1 expression and resist CTL-mediated lysis. Blood. 2004;104:2124–33. doi: 10.1182/blood-2004-01-0064. [DOI] [PubMed] [Google Scholar]
- 10.Soos JM, Krieger JI, Stuve O, et al. Malignant glioma cells use MHC class II transactivator (CIITA) promoters III and IV to direct IFN-gamma-inducible CIITA expression and can function as nonprofessional antigen presenting cells in endocytic processing and CD4(+) T-cell activation. Glia. 2001;36:391–405. doi: 10.1002/glia.1125. [DOI] [PubMed] [Google Scholar]
- 11.Thompson RH, Gillett MD, Cheville JC, et al. Costimulatory molecule B7–H1 in primary and metastatic clear cell renal cell carcinoma. Cancer. 2005;104:2084–91. doi: 10.1002/cncr.21470. [DOI] [PubMed] [Google Scholar]
- 12.Wilmotte R, Burkhardt K, Kindler V, et al. B7-homolog 1 expression by human glioma: a new mechanism of immune evasion. Neuroreport. 2005;16:1081–5. doi: 10.1097/00001756-200507130-00010. [DOI] [PubMed] [Google Scholar]
- 13.Wintterle S, Schreiner B, Mitsdoerffer M, et al. Expression of the B7-related molecule B7–H1 by glioma cells: a potential mechanism of immune paralysis. Cancer Res. 2003;63:7462–7. [PubMed] [Google Scholar]
- 14.Weller M, Fontana A. The failure of current immunotherapy for malignant glioma. Tumor-derived TGF-beta, T-cell apoptosis, and the immune privilege of the brain. Brain Res Brain Res Rev. 1995;21:128–51. doi: 10.1016/0165-0173(95)00010-0. [DOI] [PubMed] [Google Scholar]


